| Param | Original file | Final file |
|---|---|---|
| Filename | modeM0/AS1A06_006T01_9000002720_18286cztM0_level2.evt | modeM0/AS1A06_006T01_9000002720_18286cztM0_level2_quad_clean.evt |
| Size (bytes) | 714,715,200 | 92,364,480 |
| Size | 681.6 MB | 88.1 MB |
| Events in quadrant A | 3,341,591 | 614,110 |
| Events in quadrant B | 3,689,535 | 613,910 |
| Events in quadrant C | 3,374,289 | 598,745 |
| Events in quadrant D | 10,759,714 | 475,380 |
| Mode SS | |||
|---|---|---|---|
| Quadrant | BADHDUFLAG | Total packets | Discarded packets |
| A | 0 | 144 | 0 |
| B | 0 | 144 | 0 |
| C | 0 | 144 | 0 |
| D | 0 | 142 | 0 |
| Mode M9 | |||
|---|---|---|---|
| Quadrant | BADHDUFLAG | Total packets | Discarded packets |
| A | 0 | 3 | 0 |
| B | 0 | 3 | 0 |
| C | 0 | 3 | 0 |
| D | 0 | 3 | 0 |
| Mode M0 | |||
|---|---|---|---|
| Quadrant | BADHDUFLAG | Total packets | Discarded packets |
| A | 0 | 14625 | 1 |
| B | 0 | 15519 | 1 |
| C | 0 | 14760 | 1 |
| D | 0 | 37025 | 1 |
| Quadrant | Total seconds | Saturated seconds | Saturation percentage |
|---|---|---|---|
| A | 7098 | 41 | 0.577628% |
| B | 7099 | 66 | 0.929708% |
| C | 7099 | 85 | 1.197352% |
| D | 7099 | 2403 | 33.849838% |
Noise dominated data is calculated using 1-second bins in cleaned event files. If a bin has >2000 counts, and if more than 50% of those come from <1% of pixels, then it is considered to be noise-dominated and hence unusable.
| Quadrant | # 1 sec bins | Bins with >0 counts | Bins with >2000 counts | High rate bins dominated by noise | Noise dominated (total time) | Noise dominated (detector-on time) | Marked lightcurve |
|---|---|---|---|---|---|---|---|
| A | 7353 | 7099 | 2 | 2 | 0.03% | 0.03% |  |
| B | 7354 | 7100 | 7 | 7 | 0.10% | 0.10% |  |
| C | 7354 | 7100 | 3 | 3 | 0.04% | 0.04% |  |
| D | 7354 | 7100 | 2342 | 2342 | 31.85% | 32.99% | 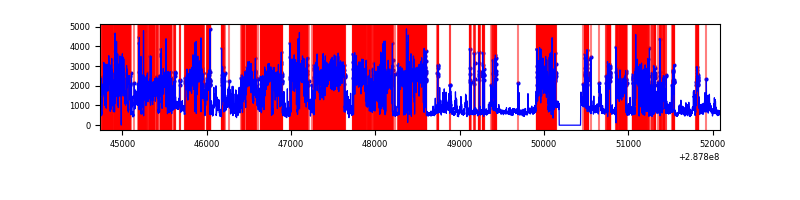 |
Top three noisy pixels from each quadrant. If the there are fewer than three noisy pixels in the level2.evt file, extra rows are filled as -1
| Pixel properties | Quadrant properties | ||||||
|---|---|---|---|---|---|---|---|
| Quadrant | DetID | PixID | Counts | Sigma | Mean | Median | Sigma |
| A | 15 | 174 | 22825 | 125.85 | 861 | 845 | 174.7 |
| A | 0 | 226 | 7565 | 38.47 | 861 | 845 | 174.7 |
| A | 12 | 194 | 6635 | 33.15 | 861 | 845 | 174.7 |
| B | 7 | 220 | 154865 | 928.1 | 857 | 835 | 166.0 |
| B | 0 | 244 | 69296 | 412.51 | 857 | 835 | 166.0 |
| B | 0 | 190 | 29587 | 173.24 | 857 | 835 | 166.0 |
| C | 14 | 238 | 124869 | 639.3 | 820 | 825 | 194.0 |
| C | 0 | 207 | 38833 | 195.89 | 820 | 825 | 194.0 |
| C | 3 | 248 | 7431 | 34.05 | 820 | 825 | 194.0 |
| D | 1 | 52 | 5351873 | 30649.98 | 719 | 700 | 174.6 |
| D | 7 | 238 | 1860657 | 10653.3 | 719 | 700 | 174.6 |
| D | 13 | 168 | 668435 | 3824.59 | 719 | 700 | 174.6 |
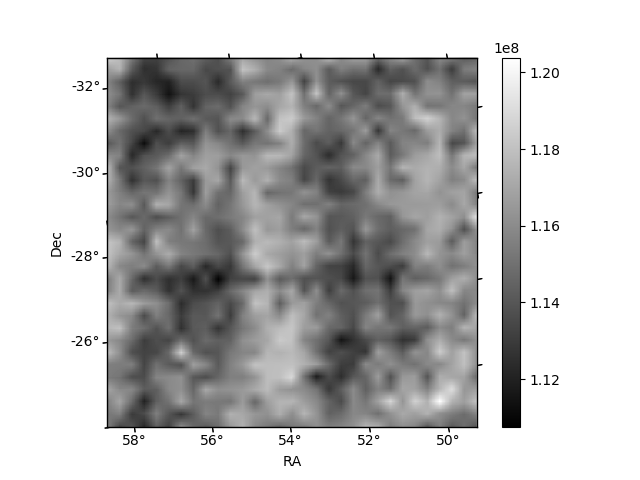
Histogram calculated using DETX and DETY for each event in the final _common_clean file
| Quadrant A | 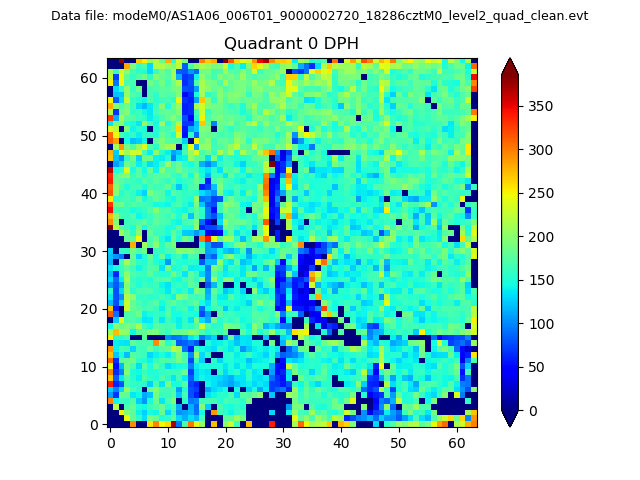 |
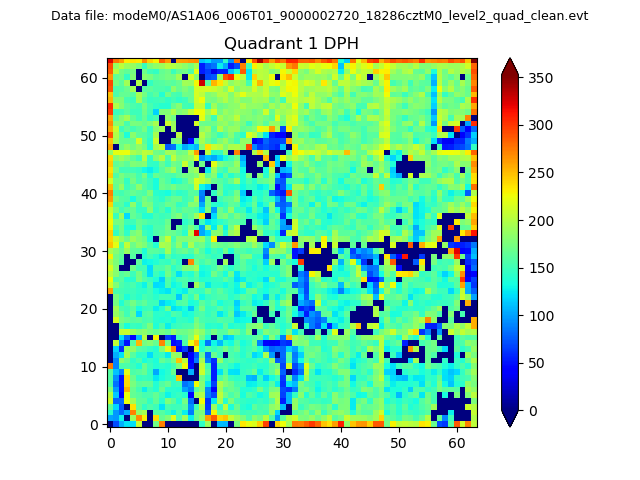 |
Quadrant B |
|---|---|---|---|
| Quadrant D |  |
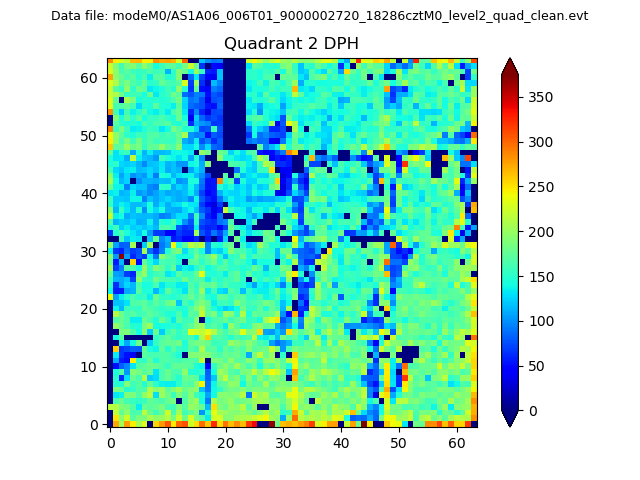 |
Quadrant C |
| Plot type | Count rate plots | Images |
|---|---|---|
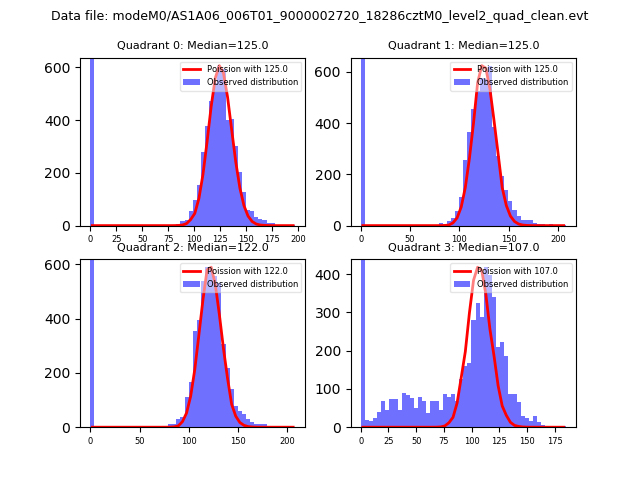
| Comparison with Poisson distribution Blue bars denote a histogram of data divided into 1 sec bins. Red curve is a Poisson curve with rate = median count rate of data. |
 |
 |
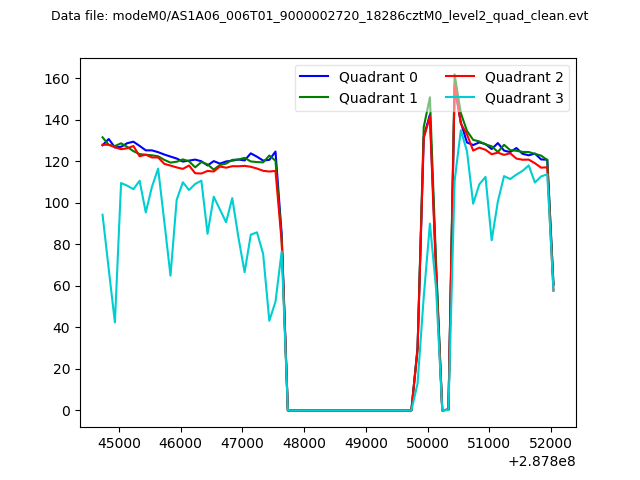
| Quadrant-wise count rates Data is divided into 100 sec bins |
 |
|
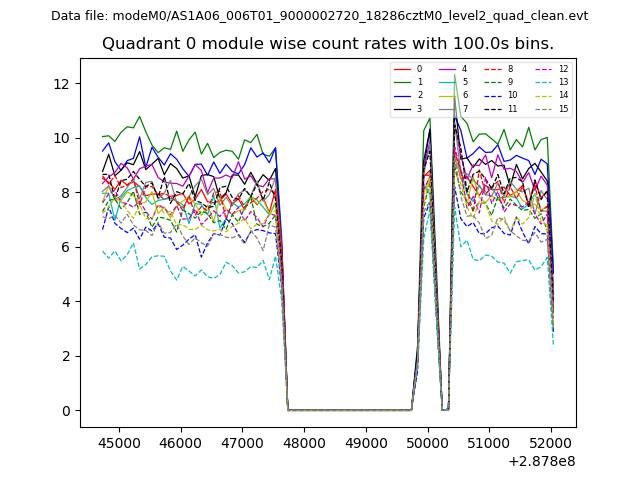
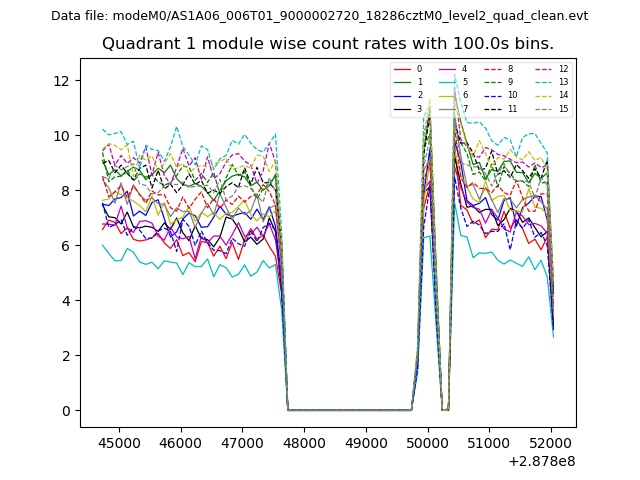
| Module-wise count rates for Quadrant A Data is divided into 100 sec bins |
 |
 |
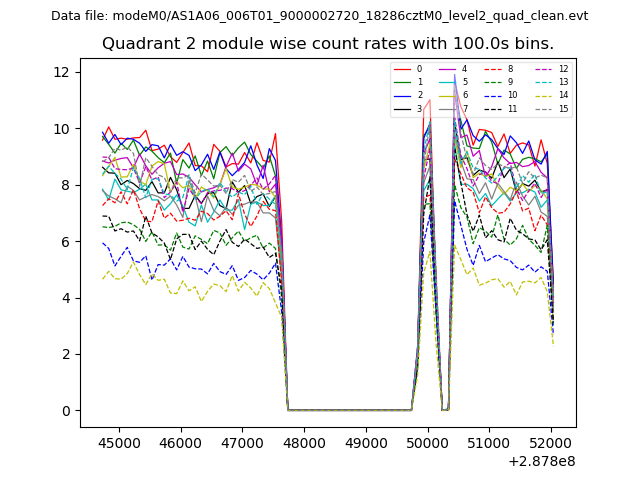
| Module-wise count rates for Quadrant B Data is divided into 100 sec bins |
 |
 |
| Module-wise count rates for Quadrant C Data is divided into 100 sec bins |
 |
 |
| Module-wise count rates for Quadrant D Data is divided into 100 sec bins |
 |
 |
| Parameter | Plot |
|---|---|
| CZT HV Monitor |  |
| D_VDD | 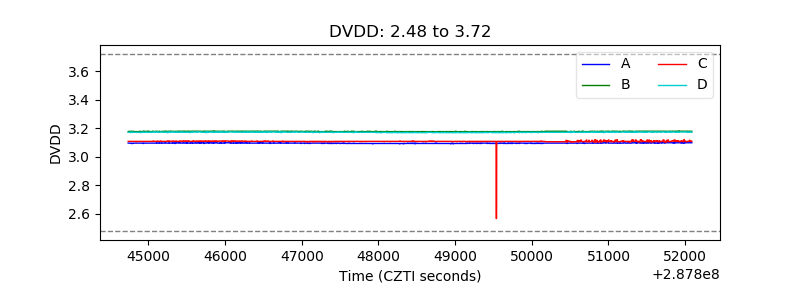 |
| Temperature 1 | 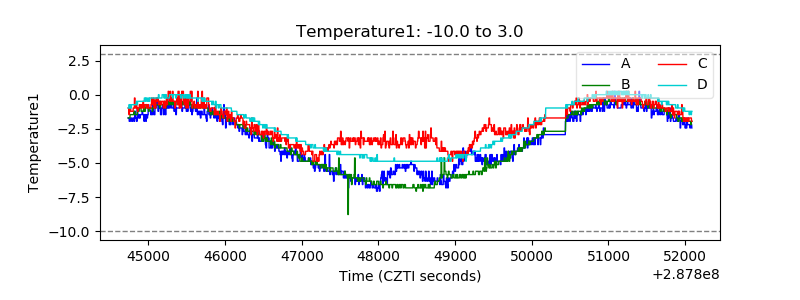 |
| Veto HV Monitor | 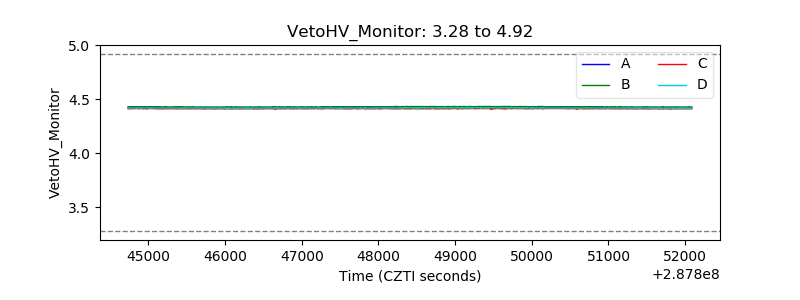 |
| Veto LLD |  |
| Alpha Counter | 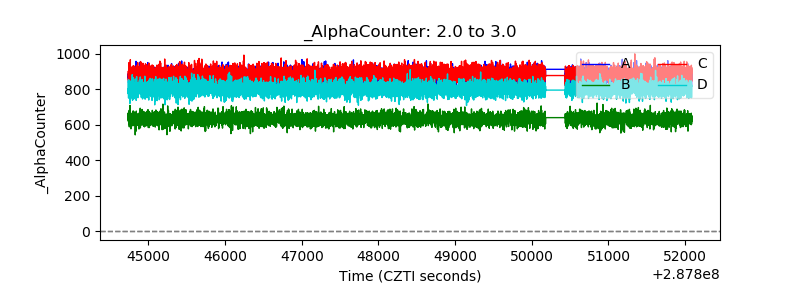 |
| _CPM_Rate | 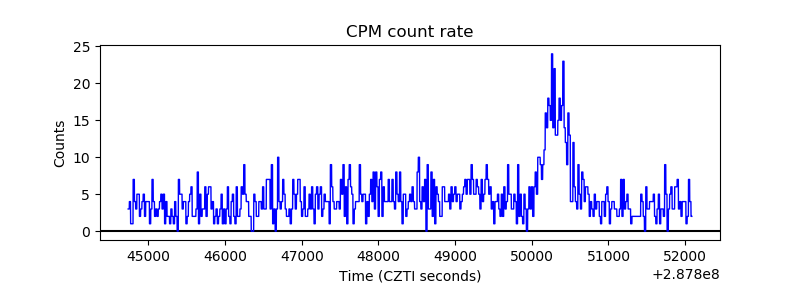 |
| CZT Counter | 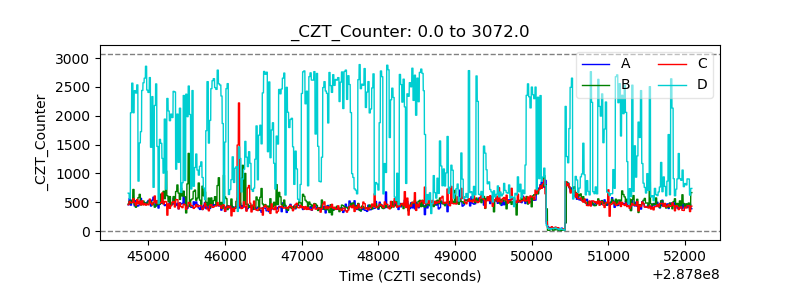 |
| +2.5 Volts monitor |  |
| +5 Volts monitor |  |
| _ROLL_ROT |  |
| _Roll_DEC | 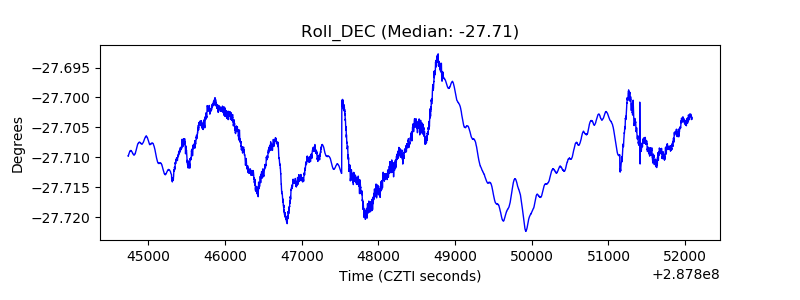 |
| _Roll_RA | 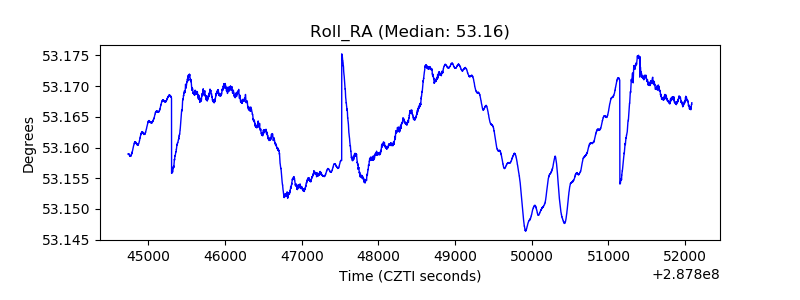 |
| Veto Counter | 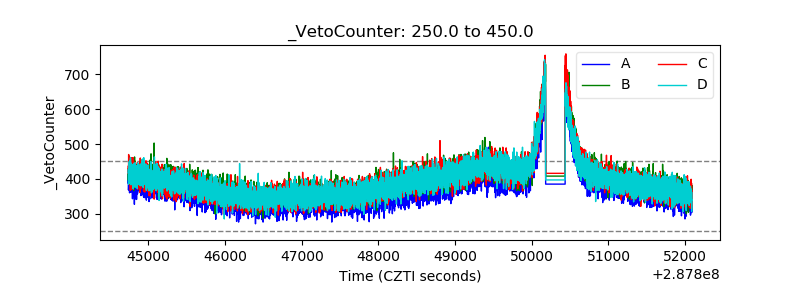 |