| Param | Original file | Final file |
|---|---|---|
| Filename | modeM0/AS1A06_006T01_9000002720_18287cztM0_level2.evt | modeM0/AS1A06_006T01_9000002720_18287cztM0_level2_quad_clean.evt |
| Size (bytes) | 604,713,600 | 91,969,920 |
| Size | 576.7 MB | 87.7 MB |
| Events in quadrant A | 3,238,215 | 592,422 |
| Events in quadrant B | 3,517,375 | 591,720 |
| Events in quadrant C | 3,261,516 | 578,205 |
| Events in quadrant D | 7,823,706 | 535,985 |
| Mode SS | |||
|---|---|---|---|
| Quadrant | BADHDUFLAG | Total packets | Discarded packets |
| A | 0 | 140 | 0 |
| B | 0 | 140 | 0 |
| C | 0 | 140 | 0 |
| D | 0 | 140 | 0 |
| Mode M9 | |||
|---|---|---|---|
| Quadrant | BADHDUFLAG | Total packets | Discarded packets |
| A | 0 | 5 | 0 |
| B | 0 | 5 | 0 |
| C | 0 | 5 | 0 |
| D | 0 | 5 | 0 |
| Mode M0 | |||
|---|---|---|---|
| Quadrant | BADHDUFLAG | Total packets | Discarded packets |
| A | 0 | 14323 | 1 |
| B | 0 | 15024 | 1 |
| C | 0 | 14374 | 1 |
| D | 0 | 28277 | 1 |
| Quadrant | Total seconds | Saturated seconds | Saturation percentage |
|---|---|---|---|
| A | 6989 | 35 | 0.500787% |
| B | 6990 | 91 | 1.301860% |
| C | 6989 | 59 | 0.844184% |
| D | 6989 | 921 | 13.177851% |
Noise dominated data is calculated using 1-second bins in cleaned event files. If a bin has >2000 counts, and if more than 50% of those come from <1% of pixels, then it is considered to be noise-dominated and hence unusable.
| Quadrant | # 1 sec bins | Bins with >0 counts | Bins with >2000 counts | High rate bins dominated by noise | Noise dominated (total time) | Noise dominated (detector-on time) | Marked lightcurve |
|---|---|---|---|---|---|---|---|
| A | 7394 | 6990 | 0 | 0 | 0.00% | 0.00% | 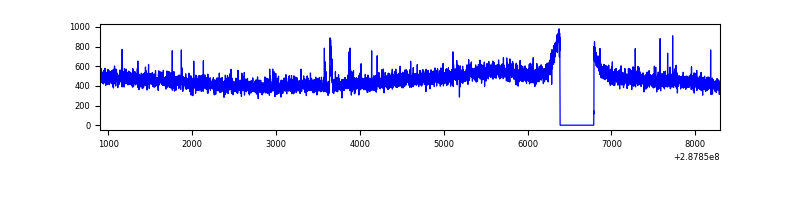 |
| B | 7395 | 6991 | 24 | 24 | 0.32% | 0.34% | 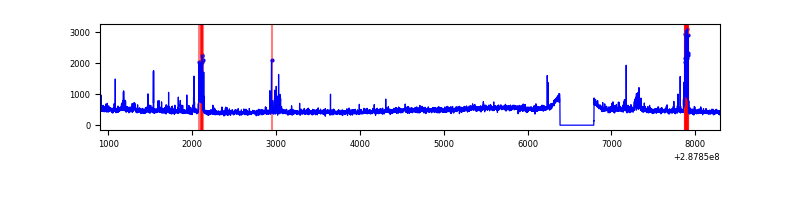 |
| C | 7394 | 6990 | 1 | 1 | 0.01% | 0.01% | 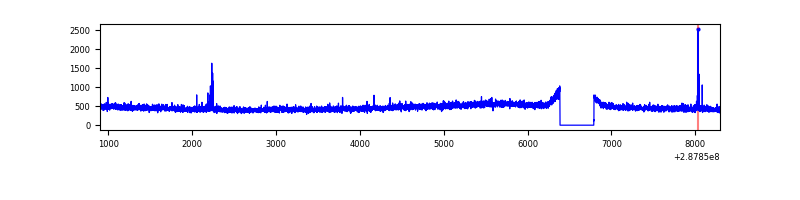 |
| D | 7394 | 6990 | 825 | 825 | 11.16% | 11.80% | 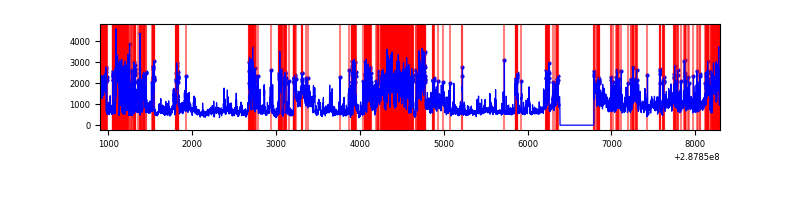 |
Top three noisy pixels from each quadrant. If the there are fewer than three noisy pixels in the level2.evt file, extra rows are filled as -1
| Pixel properties | Quadrant properties | ||||||
|---|---|---|---|---|---|---|---|
| Quadrant | DetID | PixID | Counts | Sigma | Mean | Median | Sigma |
| A | 15 | 174 | 15095 | 83.84 | 837 | 819 | 170.3 |
| A | 0 | 226 | 7225 | 37.62 | 837 | 819 | 170.3 |
| A | 12 | 194 | 6708 | 34.58 | 837 | 819 | 170.3 |
| B | 0 | 190 | 173651 | 1067.38 | 831 | 809 | 161.9 |
| B | 0 | 197 | 25282 | 151.13 | 831 | 809 | 161.9 |
| B | 4 | 216 | 25101 | 150.01 | 831 | 809 | 161.9 |
| C | 14 | 238 | 119878 | 635.35 | 795 | 801 | 187.4 |
| C | 0 | 207 | 25723 | 132.97 | 795 | 801 | 187.4 |
| C | 8 | 128 | 8586 | 41.54 | 795 | 801 | 187.4 |
| D | 7 | 238 | 2724030 | 14276.77 | 774 | 751 | 190.7 |
| D | 1 | 52 | 1229864 | 6443.61 | 774 | 751 | 190.7 |
| D | 13 | 168 | 687142 | 3598.4 | 774 | 751 | 190.7 |
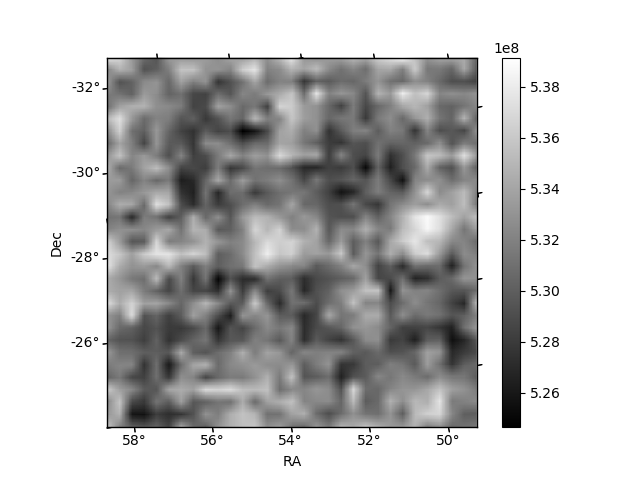
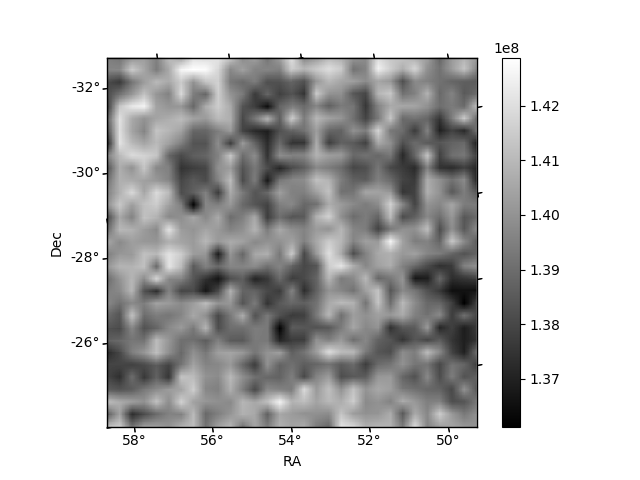
Histogram calculated using DETX and DETY for each event in the final _common_clean file
| Quadrant A | 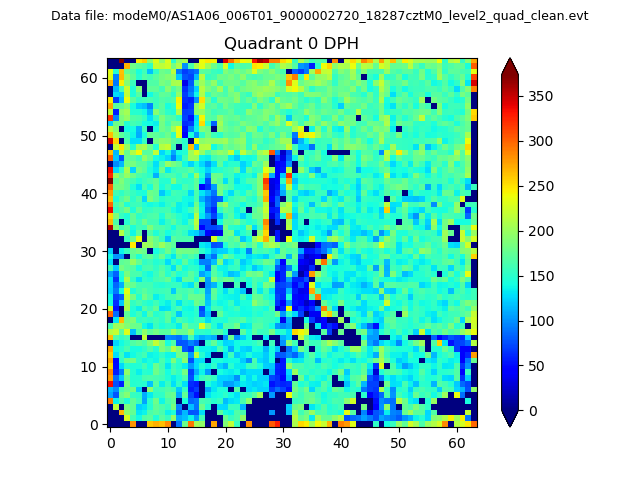 |
 |
Quadrant B |
|---|---|---|---|
| Quadrant D | 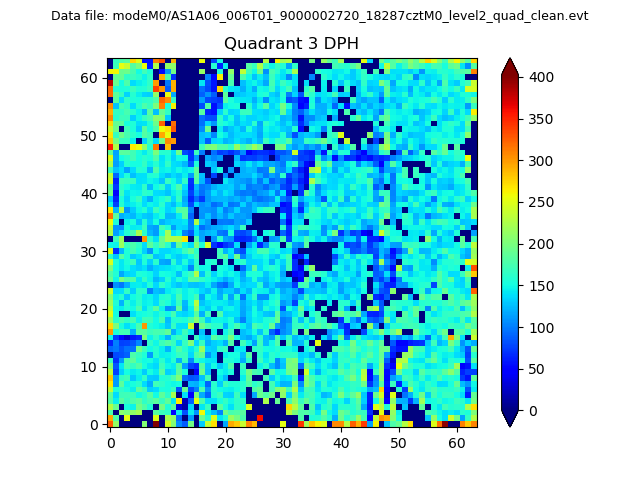 |
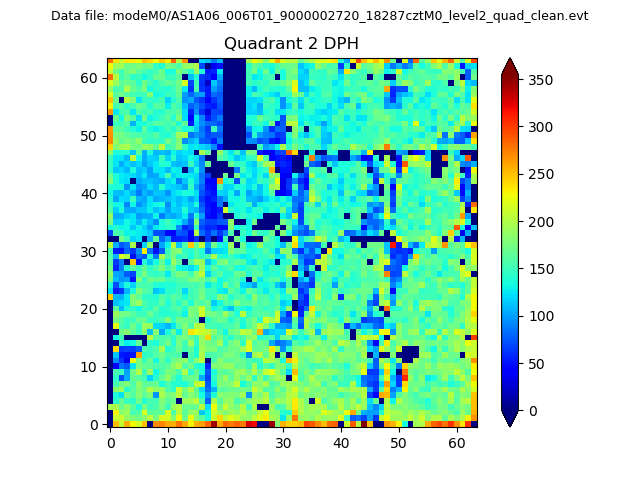 |
Quadrant C |
| Plot type | Count rate plots | Images |
|---|---|---|
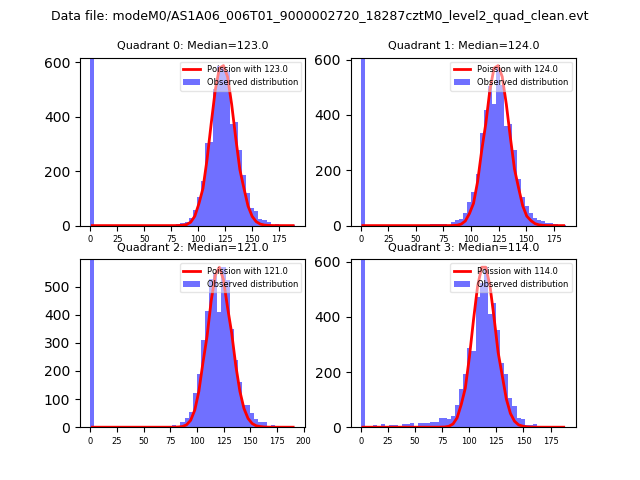
| Comparison with Poisson distribution Blue bars denote a histogram of data divided into 1 sec bins. Red curve is a Poisson curve with rate = median count rate of data. |
 |
 |
| Quadrant-wise count rates Data is divided into 100 sec bins |
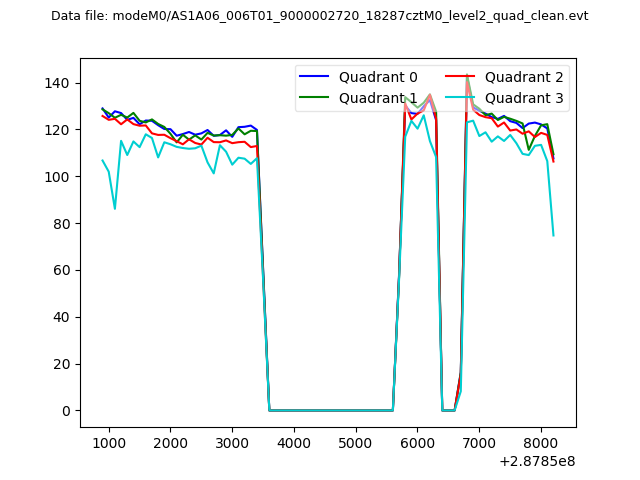 |
|
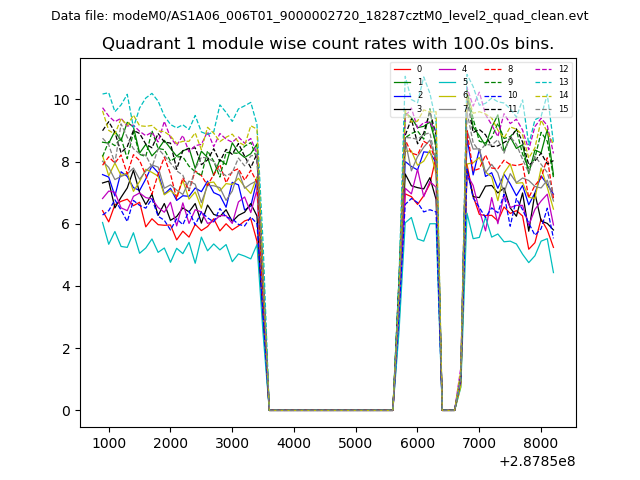
| Module-wise count rates for Quadrant A Data is divided into 100 sec bins |
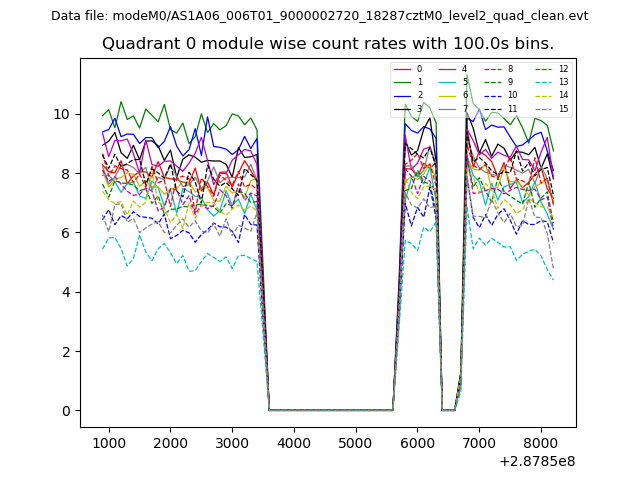 |
 |
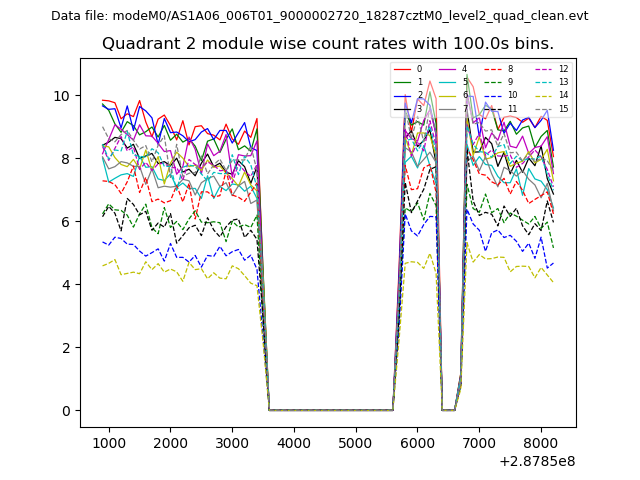
| Module-wise count rates for Quadrant B Data is divided into 100 sec bins |
 |
 |
| Module-wise count rates for Quadrant C Data is divided into 100 sec bins |
 |
 |
| Module-wise count rates for Quadrant D Data is divided into 100 sec bins |
 |
 |
| Parameter | Plot |
|---|---|
| CZT HV Monitor | 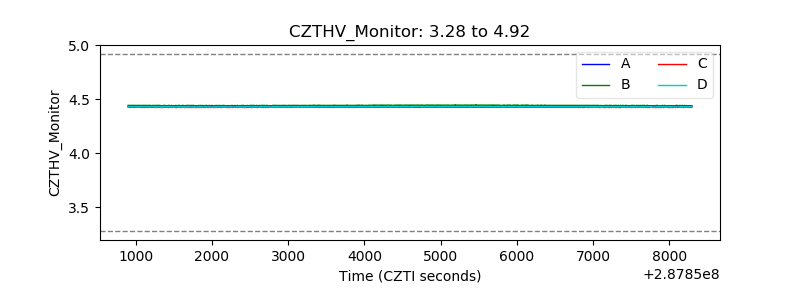 |
| D_VDD | 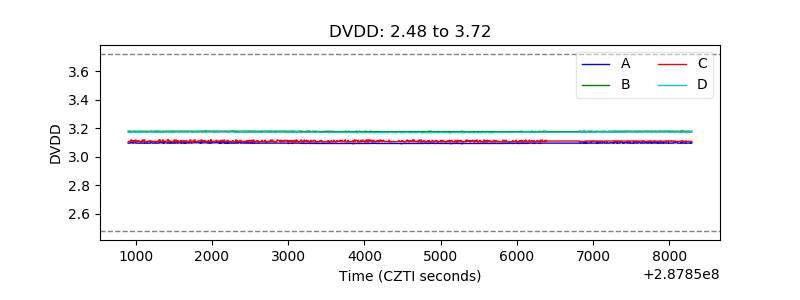 |
| Temperature 1 | 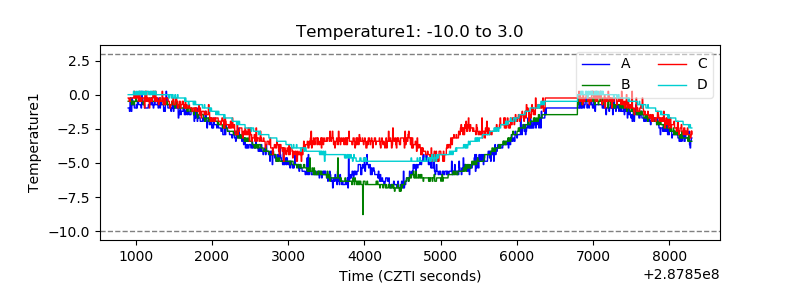 |
| Veto HV Monitor | 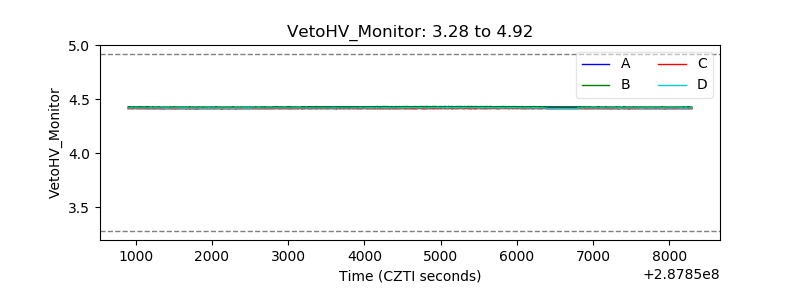 |
| Veto LLD |  |
| Alpha Counter | 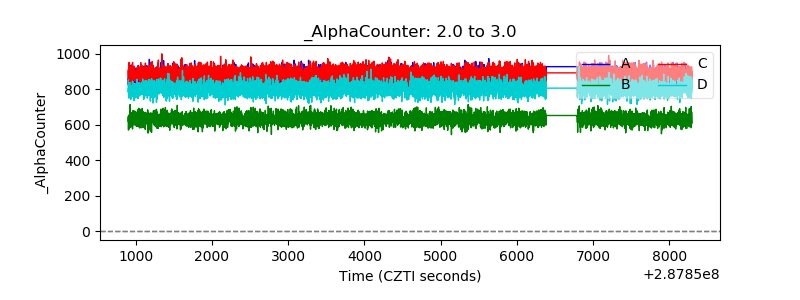 |
| _CPM_Rate | 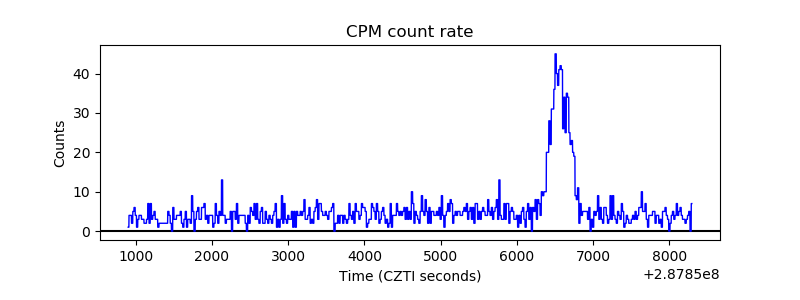 |
| CZT Counter | 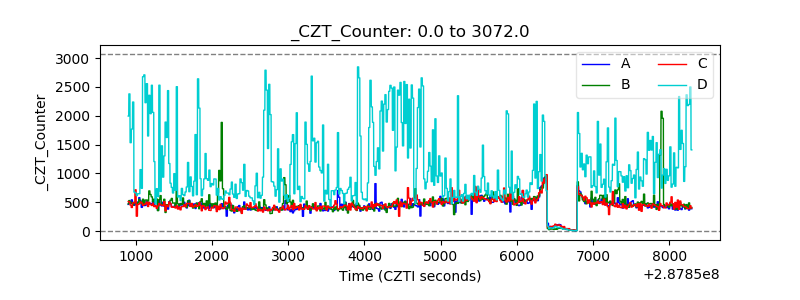 |
| +2.5 Volts monitor |  |
| +5 Volts monitor |  |
| _ROLL_ROT | 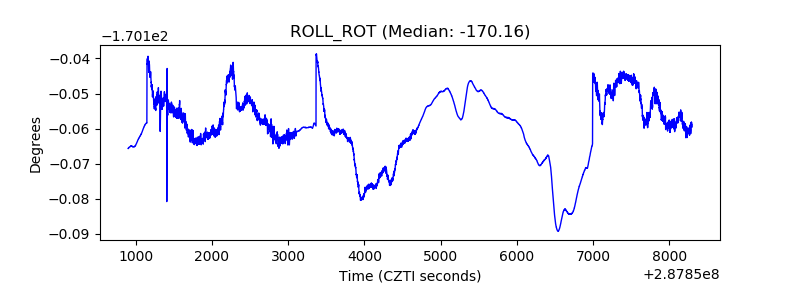 |
| _Roll_DEC | 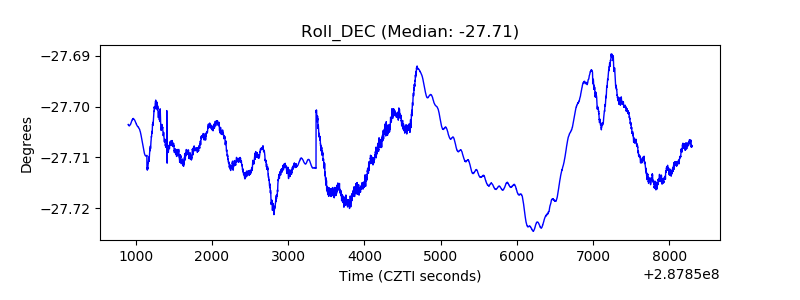 |
| _Roll_RA | 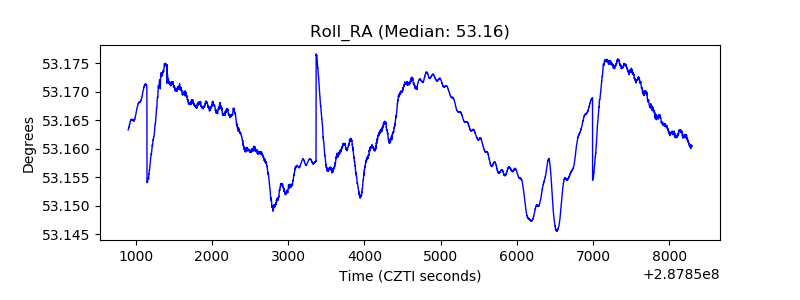 |
| Veto Counter | 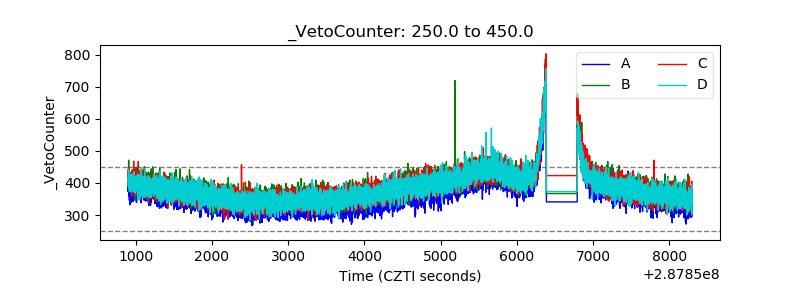 |