| Param | Original file | Final file |
|---|---|---|
| Filename | modeM0/AS1A06_006T01_9000002720_18289cztM0_level2.evt | modeM0/AS1A06_006T01_9000002720_18289cztM0_level2_quad_clean.evt |
| Size (bytes) | 1,115,265,600 | 162,797,760 |
| Size | 1.0 GB | 155.3 MB |
| Events in quadrant A | 6,119,173 | 1,051,082 |
| Events in quadrant B | 6,351,534 | 1,053,609 |
| Events in quadrant C | 6,022,296 | 1,028,784 |
| Events in quadrant D | 14,418,200 | 911,011 |
| Mode SS | |||
|---|---|---|---|
| Quadrant | BADHDUFLAG | Total packets | Discarded packets |
| A | 0 | 260 | 0 |
| B | 0 | 260 | 0 |
| C | 0 | 260 | 0 |
| D | 0 | 260 | 0 |
| Mode M9 | |||
|---|---|---|---|
| Quadrant | BADHDUFLAG | Total packets | Discarded packets |
| A | 0 | 16 | 0 |
| B | 0 | 17 | 0 |
| C | 0 | 17 | 0 |
| D | 0 | 17 | 0 |
| Mode M0 | |||
|---|---|---|---|
| Quadrant | BADHDUFLAG | Total packets | Discarded packets |
| A | 0 | 26784 | 3 |
| B | 0 | 27270 | 3 |
| C | 0 | 26370 | 3 |
| D | 0 | 51783 | 3 |
| Quadrant | Total seconds | Saturated seconds | Saturation percentage |
|---|---|---|---|
| A | 12811 | 82 | 0.640075% |
| B | 12811 | 123 | 0.960112% |
| C | 12811 | 70 | 0.546405% |
| D | 12811 | 1929 | 15.057373% |
Noise dominated data is calculated using 1-second bins in cleaned event files. If a bin has >2000 counts, and if more than 50% of those come from <1% of pixels, then it is considered to be noise-dominated and hence unusable.
| Quadrant | # 1 sec bins | Bins with >0 counts | Bins with >2000 counts | High rate bins dominated by noise | Noise dominated (total time) | Noise dominated (detector-on time) | Marked lightcurve |
|---|---|---|---|---|---|---|---|
| A | 14116 | 12813 | 29 | 29 | 0.21% | 0.23% | 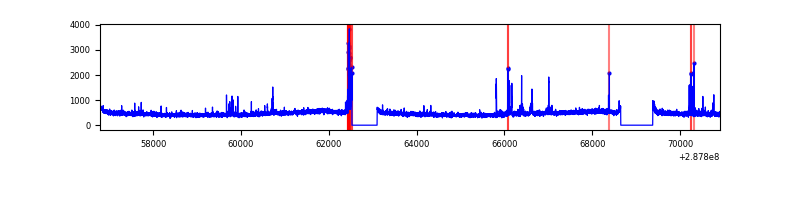 |
| B | 14116 | 12813 | 41 | 41 | 0.29% | 0.32% | 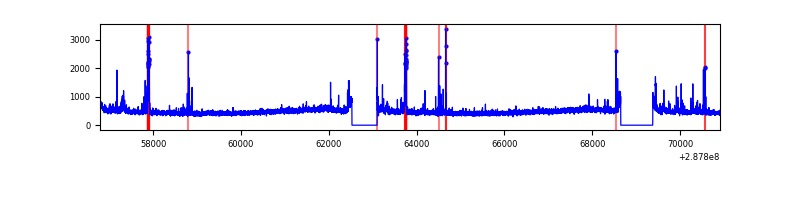 |
| C | 14116 | 12813 | 2 | 2 | 0.01% | 0.02% | 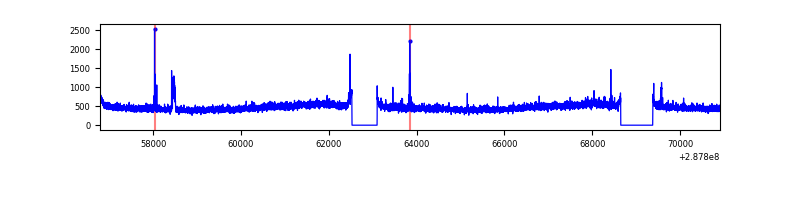 |
| D | 14116 | 12812 | 1625 | 1625 | 11.51% | 12.68% | 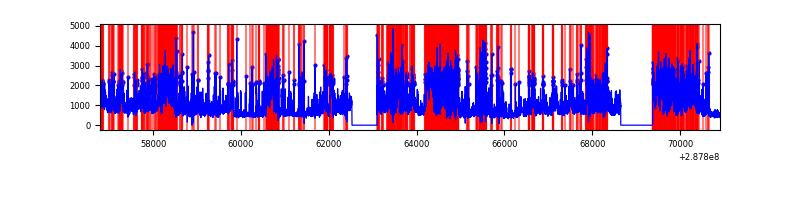 |
Top three noisy pixels from each quadrant. If the there are fewer than three noisy pixels in the level2.evt file, extra rows are filled as -1
| Pixel properties | Quadrant properties | ||||||
|---|---|---|---|---|---|---|---|
| Quadrant | DetID | PixID | Counts | Sigma | Mean | Median | Sigma |
| A | 15 | 174 | 242544 | 784.94 | 1517 | 1484 | 307.1 |
| A | 9 | 143 | 32767 | 101.86 | 1517 | 1484 | 307.1 |
| A | 4 | 2 | 16270 | 48.15 | 1517 | 1484 | 307.1 |
| B | 0 | 190 | 179226 | 611.69 | 1518 | 1481 | 290.6 |
| B | 7 | 220 | 70901 | 238.9 | 1518 | 1481 | 290.6 |
| B | 0 | 197 | 51018 | 170.47 | 1518 | 1481 | 290.6 |
| C | 14 | 238 | 219974 | 640.35 | 1453 | 1461 | 341.2 |
| C | 3 | 233 | 87114 | 251.0 | 1453 | 1461 | 341.2 |
| C | 0 | 207 | 37055 | 104.31 | 1453 | 1461 | 341.2 |
| D | 7 | 238 | 4728739 | 13771.36 | 1394 | 1348 | 343.3 |
| D | 1 | 52 | 2497267 | 7270.86 | 1394 | 1348 | 343.3 |
| D | 13 | 168 | 832873 | 2422.31 | 1394 | 1348 | 343.3 |
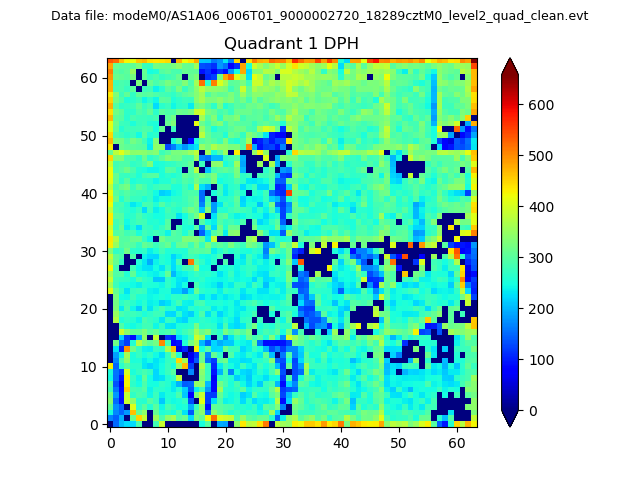
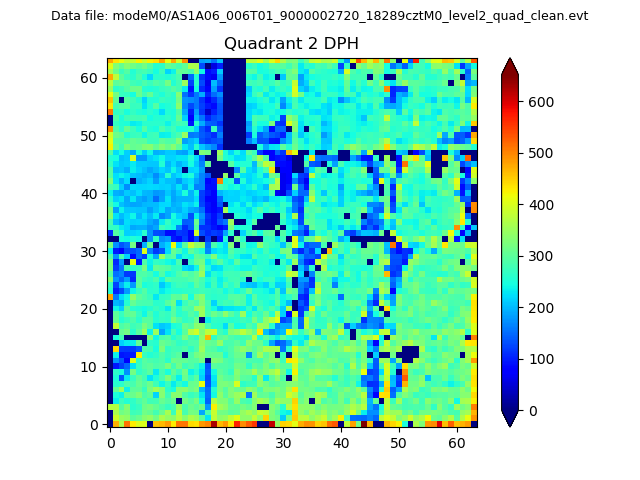
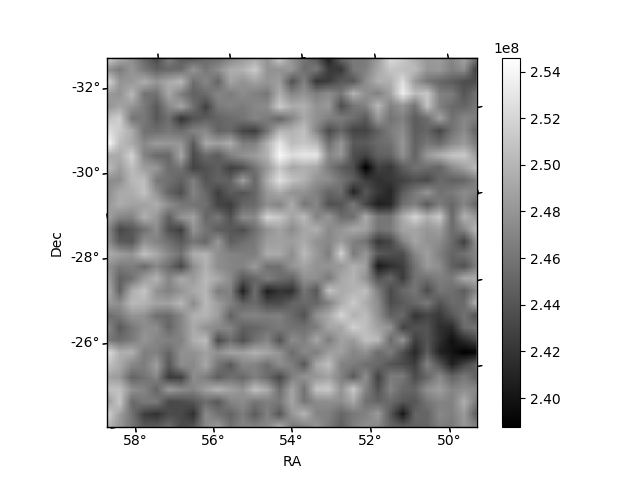
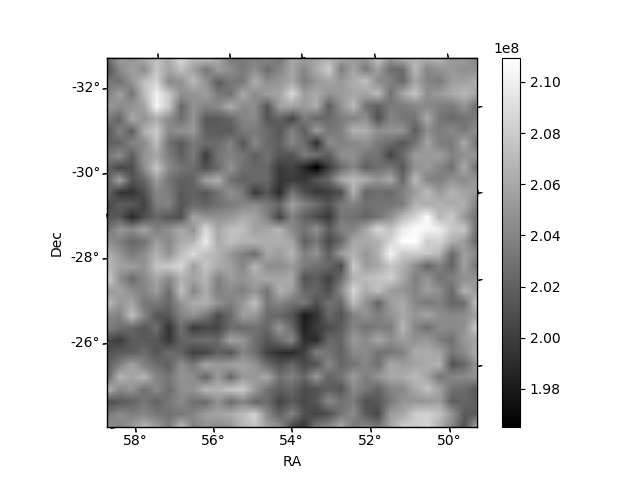
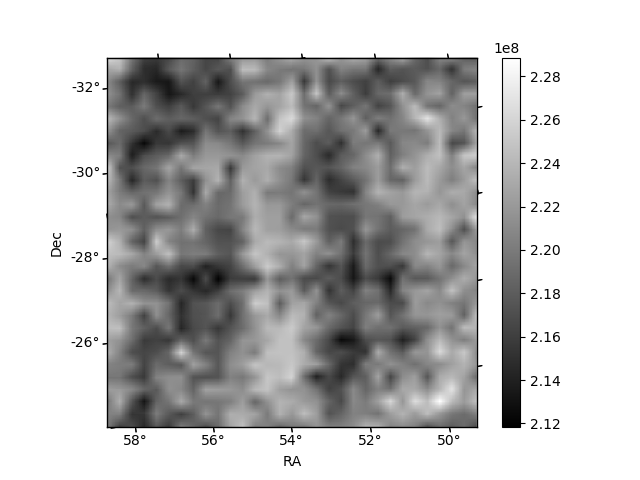
Histogram calculated using DETX and DETY for each event in the final _common_clean file
| Quadrant A |  |
 |
Quadrant B |
|---|---|---|---|
| Quadrant D |  |
 |
Quadrant C |
| Plot type | Count rate plots | Images |
|---|---|---|
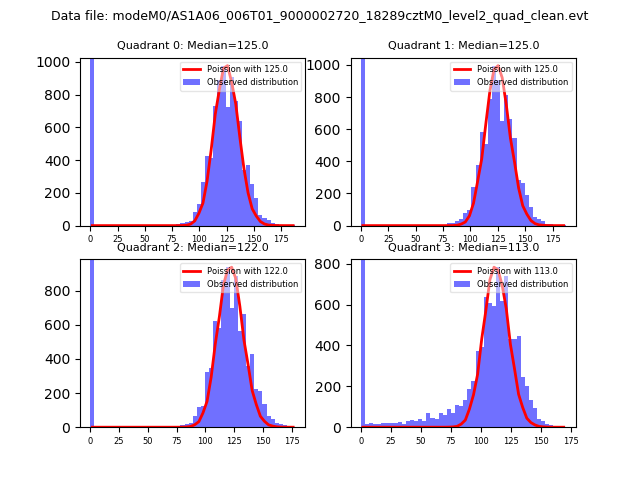
| Comparison with Poisson distribution Blue bars denote a histogram of data divided into 1 sec bins. Red curve is a Poisson curve with rate = median count rate of data. |
 |
 |
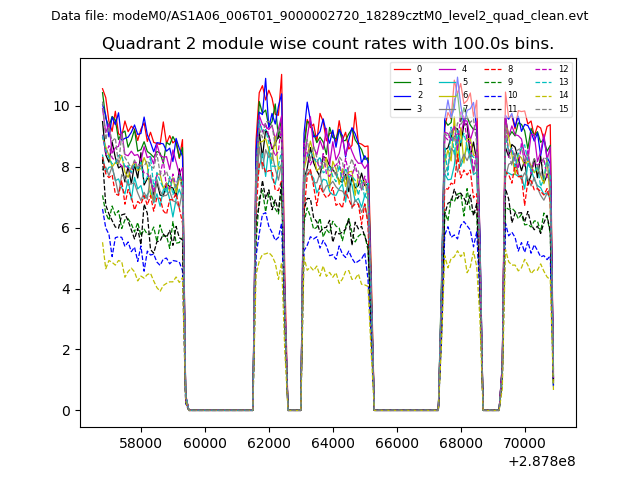
| Quadrant-wise count rates Data is divided into 100 sec bins |
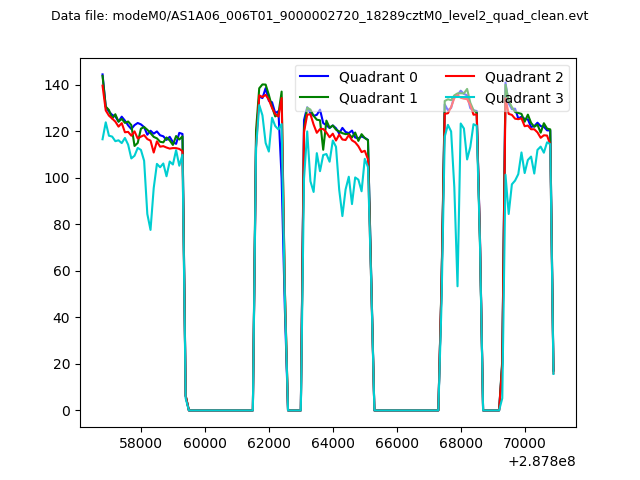 |
|
| Module-wise count rates for Quadrant A Data is divided into 100 sec bins |
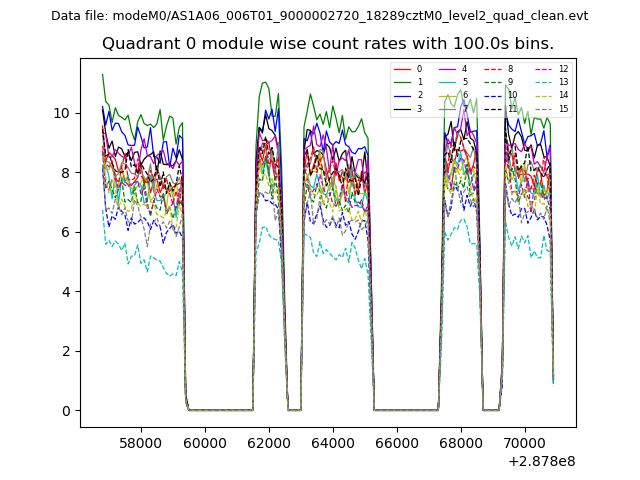 |
 |
| Module-wise count rates for Quadrant B Data is divided into 100 sec bins |
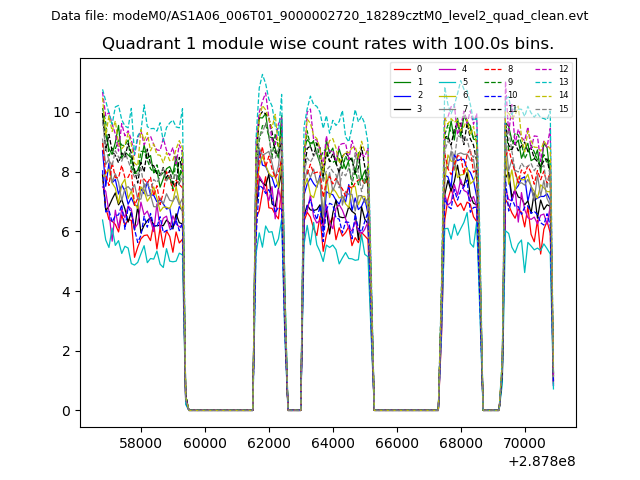 |
 |
| Module-wise count rates for Quadrant C Data is divided into 100 sec bins |
 |
 |
| Module-wise count rates for Quadrant D Data is divided into 100 sec bins |
 |
 |
| Parameter | Plot |
|---|---|
| CZT HV Monitor | 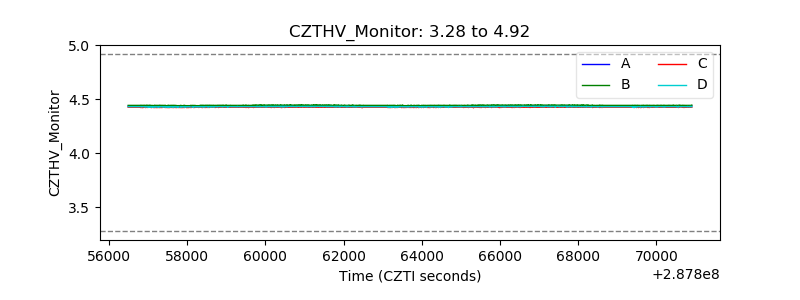 |
| D_VDD | 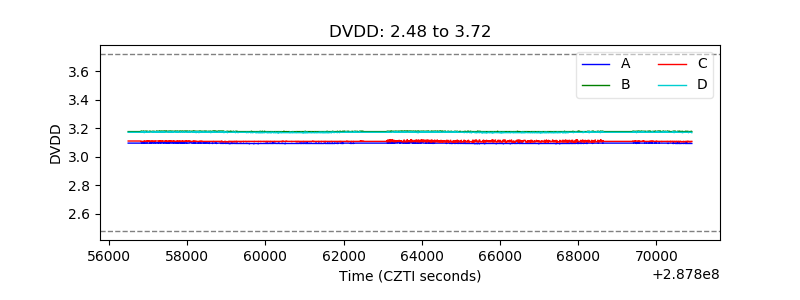 |
| Temperature 1 | 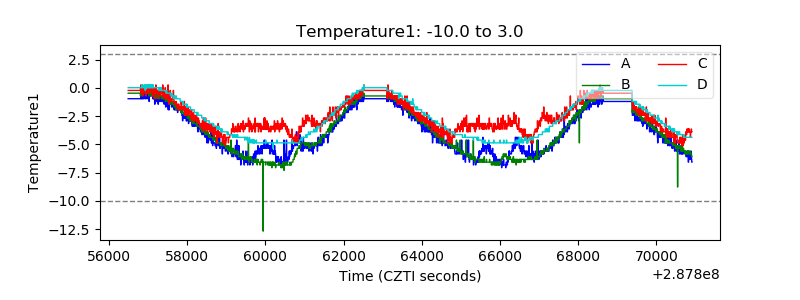 |
| Veto HV Monitor | 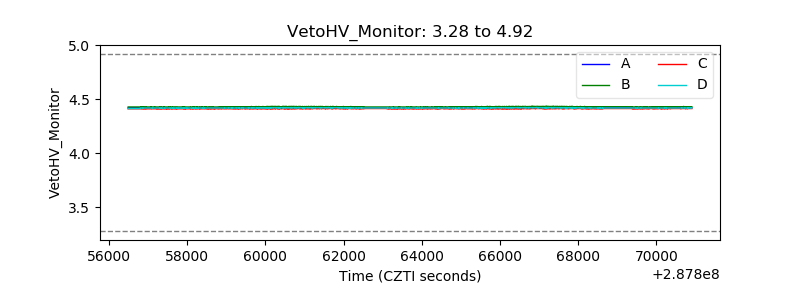 |
| Veto LLD | 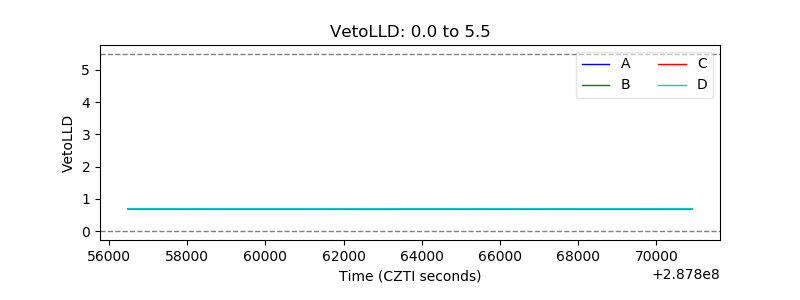 |
| Alpha Counter | 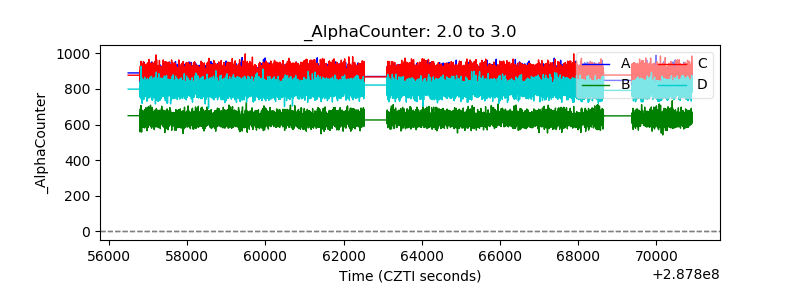 |
| _CPM_Rate | 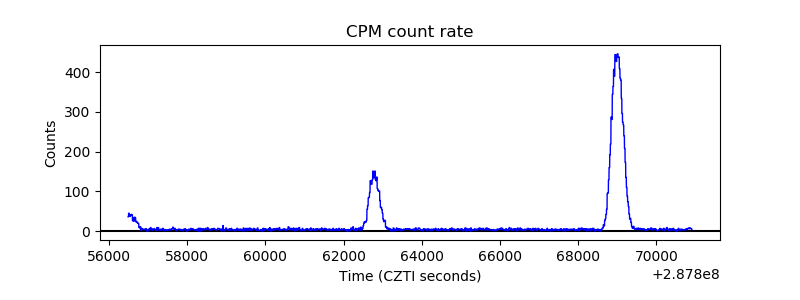 |
| CZT Counter | 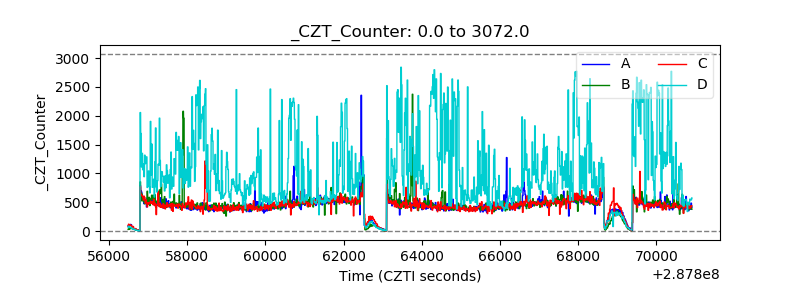 |
| +2.5 Volts monitor |  |
| +5 Volts monitor | 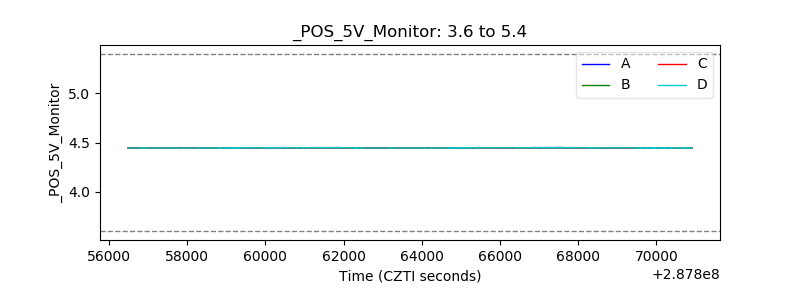 |
| _ROLL_ROT |  |
| _Roll_DEC | 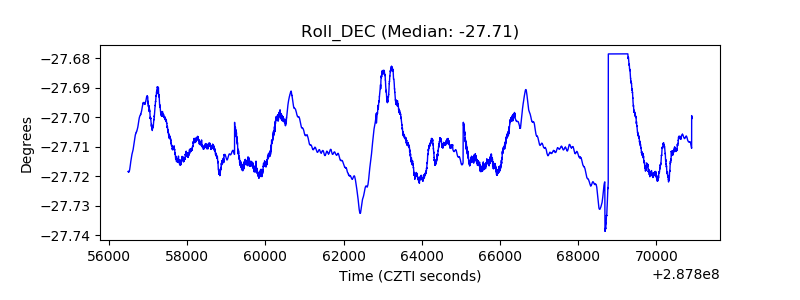 |
| _Roll_RA | 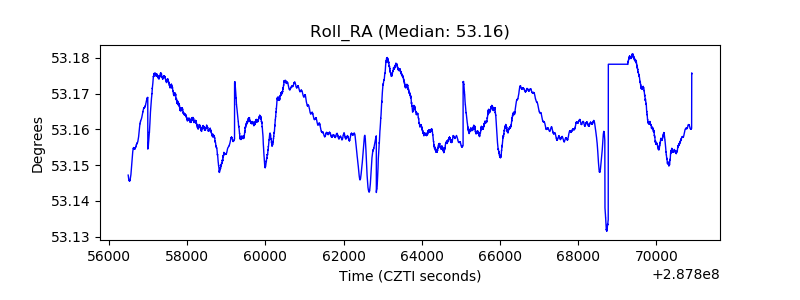 |
| Veto Counter | 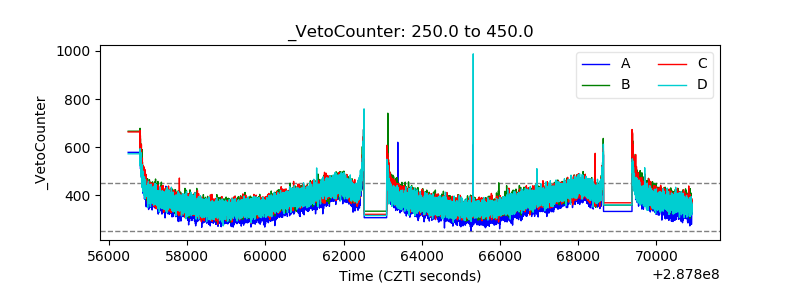 |