| Param | Original file | Final file |
|---|---|---|
| Filename | modeM0/AS1A06_006T01_9000002720_18290cztM0_level2.evt | modeM0/AS1A06_006T01_9000002720_18290cztM0_level2_quad_clean.evt |
| Size (bytes) | 559,998,720 | 89,974,080 |
| Size | 534.1 MB | 85.8 MB |
| Events in quadrant A | 3,371,305 | 577,722 |
| Events in quadrant B | 3,392,733 | 585,834 |
| Events in quadrant C | 3,190,856 | 567,787 |
| Events in quadrant D | 6,542,942 | 518,554 |
| Mode SS | |||
|---|---|---|---|
| Quadrant | BADHDUFLAG | Total packets | Discarded packets |
| A | 0 | 140 | 0 |
| B | 0 | 140 | 0 |
| C | 0 | 140 | 0 |
| D | 0 | 140 | 0 |
| Mode M9 | |||
|---|---|---|---|
| Quadrant | BADHDUFLAG | Total packets | Discarded packets |
| A | 0 | 16 | 0 |
| B | 0 | 16 | 0 |
| C | 0 | 16 | 0 |
| D | 0 | 16 | 0 |
| Mode M0 | |||
|---|---|---|---|
| Quadrant | BADHDUFLAG | Total packets | Discarded packets |
| A | 0 | 14572 | 2 |
| B | 0 | 14443 | 2 |
| C | 0 | 13893 | 2 |
| D | 0 | 24051 | 2 |
| Quadrant | Total seconds | Saturated seconds | Saturation percentage |
|---|---|---|---|
| A | 6810 | 96 | 1.409692% |
| B | 6811 | 58 | 0.851564% |
| C | 6811 | 47 | 0.690060% |
| D | 6811 | 741 | 10.879460% |
Noise dominated data is calculated using 1-second bins in cleaned event files. If a bin has >2000 counts, and if more than 50% of those come from <1% of pixels, then it is considered to be noise-dominated and hence unusable.
| Quadrant | # 1 sec bins | Bins with >0 counts | Bins with >2000 counts | High rate bins dominated by noise | Noise dominated (total time) | Noise dominated (detector-on time) | Marked lightcurve |
|---|---|---|---|---|---|---|---|
| A | 8435 | 6812 | 36 | 36 | 0.43% | 0.53% | 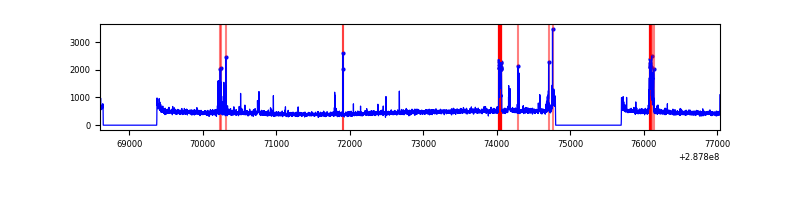 |
| B | 8436 | 6813 | 4 | 4 | 0.05% | 0.06% | 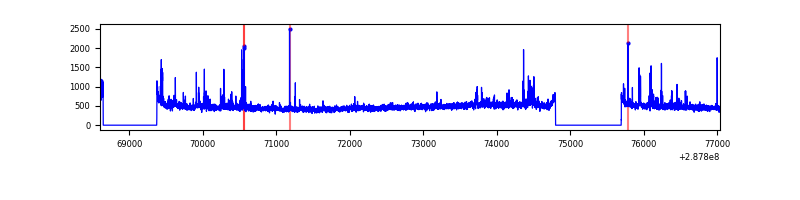 |
| C | 8436 | 6813 | 0 | 0 | 0.00% | 0.00% | 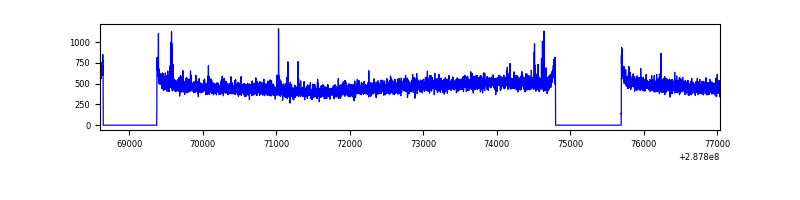 |
| D | 8436 | 6813 | 637 | 637 | 7.55% | 9.35% | 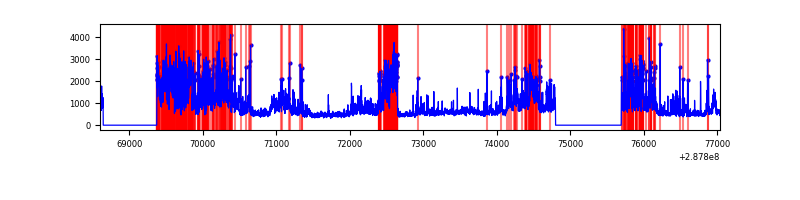 |
Top three noisy pixels from each quadrant. If the there are fewer than three noisy pixels in the level2.evt file, extra rows are filled as -1
| Pixel properties | Quadrant properties | ||||||
|---|---|---|---|---|---|---|---|
| Quadrant | DetID | PixID | Counts | Sigma | Mean | Median | Sigma |
| A | 15 | 174 | 185723 | 1116.64 | 808 | 789 | 165.6 |
| A | 9 | 143 | 78303 | 468.03 | 808 | 789 | 165.6 |
| A | 0 | 226 | 7029 | 37.68 | 808 | 789 | 165.6 |
| B | 7 | 220 | 68074 | 426.72 | 815 | 794 | 157.7 |
| B | 0 | 197 | 44055 | 274.38 | 815 | 794 | 157.7 |
| B | 0 | 244 | 24827 | 152.43 | 815 | 794 | 157.7 |
| C | 14 | 238 | 121974 | 659.02 | 779 | 782 | 183.9 |
| C | 3 | 233 | 16847 | 87.36 | 779 | 782 | 183.9 |
| C | 0 | 207 | 15435 | 79.68 | 779 | 782 | 183.9 |
| D | 7 | 238 | 2305855 | 12372.49 | 756 | 734 | 186.3 |
| D | 1 | 52 | 472698 | 2533.22 | 756 | 734 | 186.3 |
| D | 12 | 110 | 407754 | 2184.64 | 756 | 734 | 186.3 |
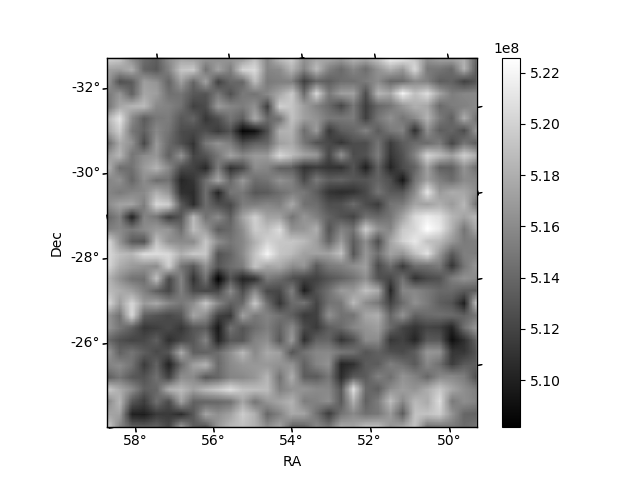
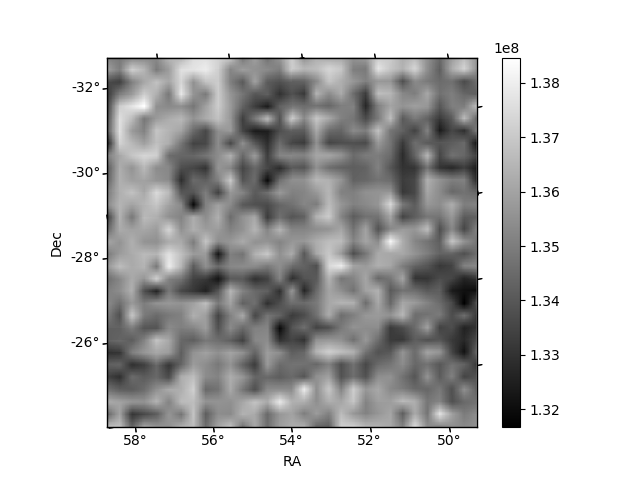
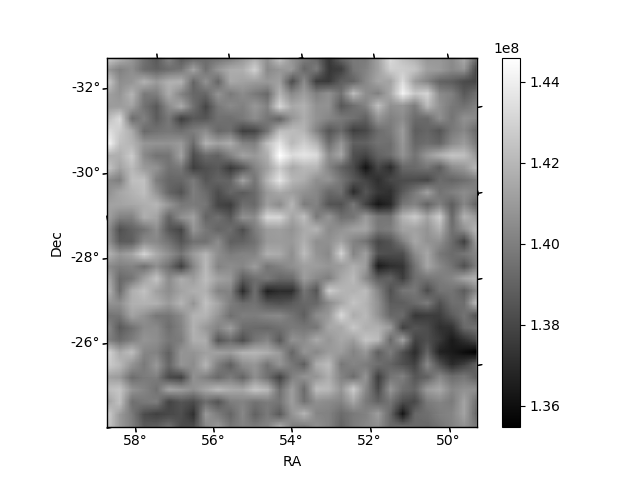
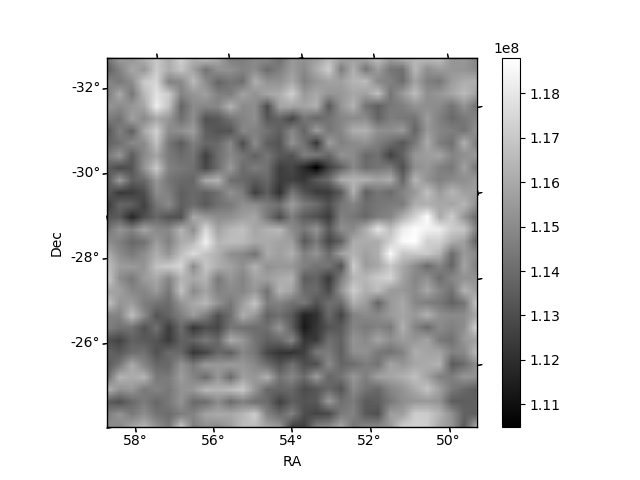
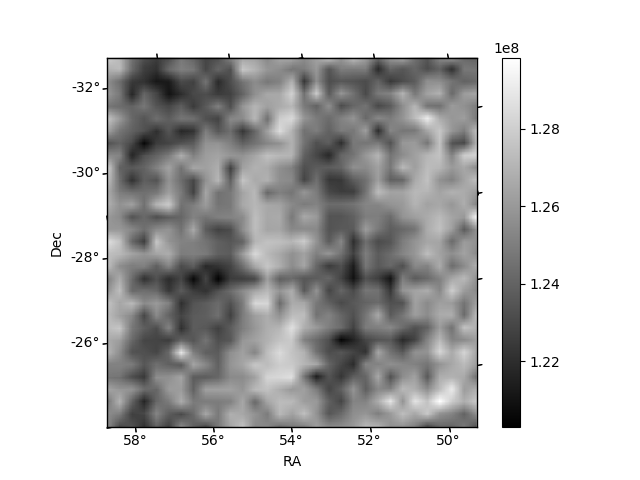
Histogram calculated using DETX and DETY for each event in the final _common_clean file
| Quadrant A | 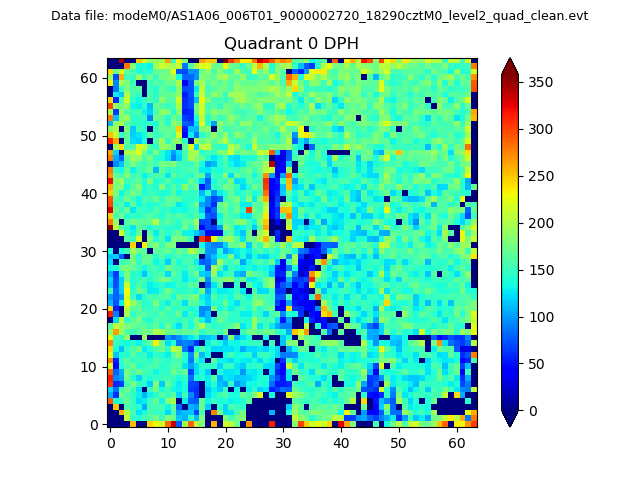 |
 |
Quadrant B |
|---|---|---|---|
| Quadrant D | 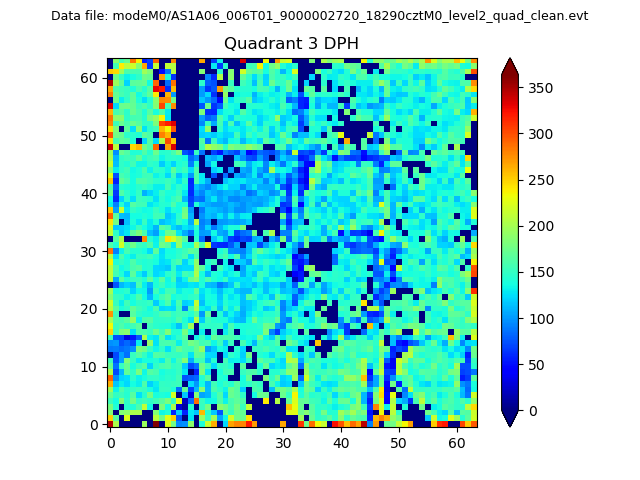 |
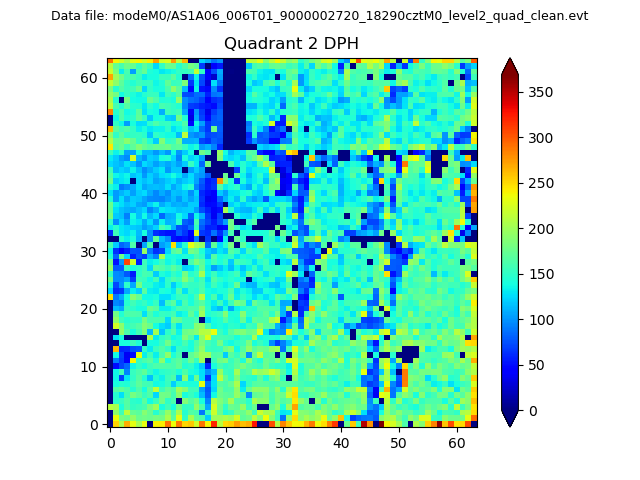 |
Quadrant C |
| Plot type | Count rate plots | Images |
|---|---|---|
| Comparison with Poisson distribution Blue bars denote a histogram of data divided into 1 sec bins. Red curve is a Poisson curve with rate = median count rate of data. |
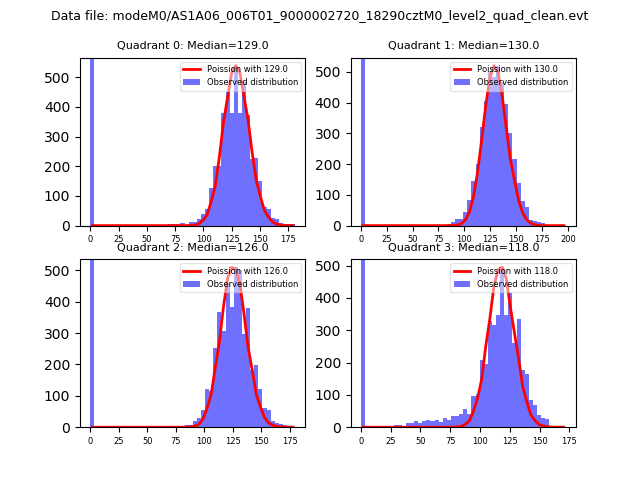 |
 |
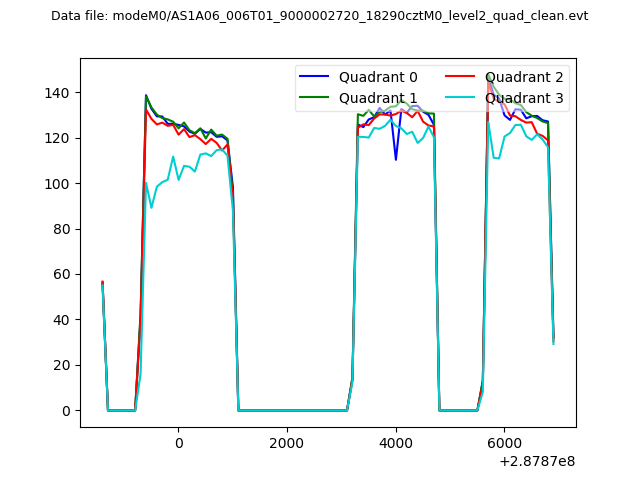
| Quadrant-wise count rates Data is divided into 100 sec bins |
 |
|
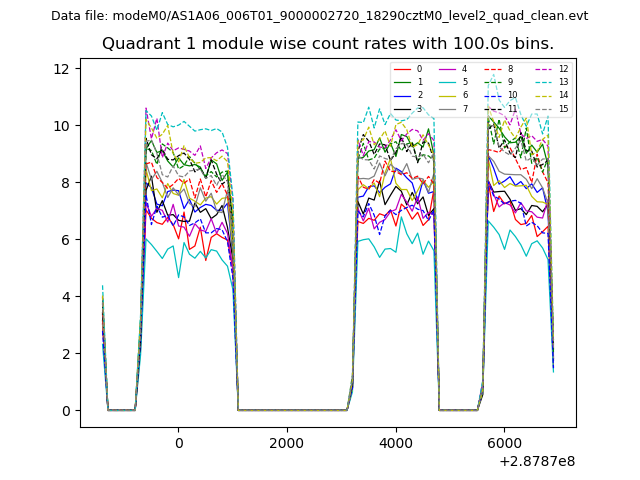
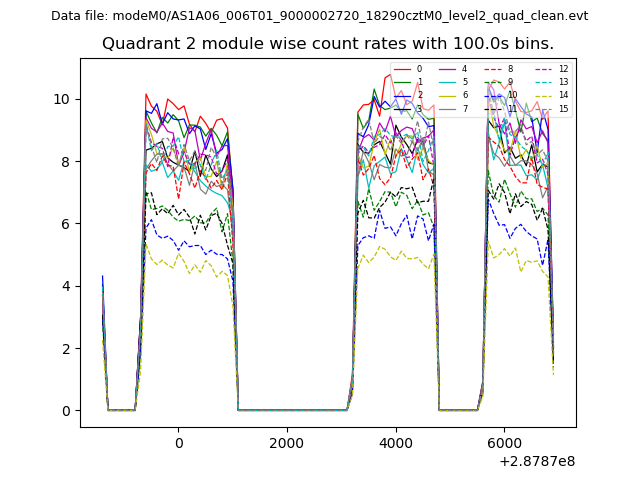
| Module-wise count rates for Quadrant A Data is divided into 100 sec bins |
 |
 |
| Module-wise count rates for Quadrant B Data is divided into 100 sec bins |
 |
 |
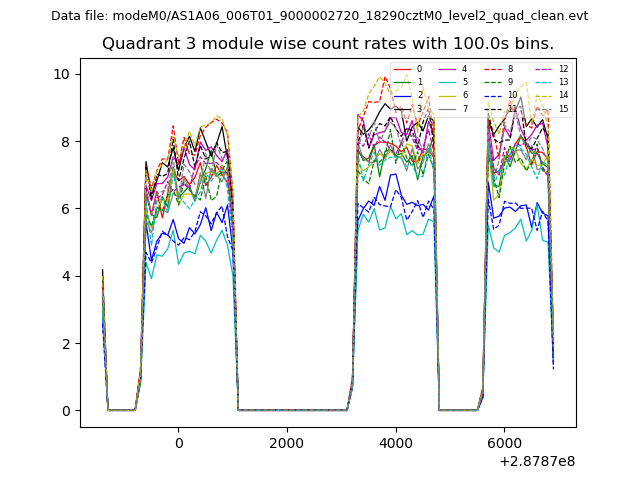
| Module-wise count rates for Quadrant C Data is divided into 100 sec bins |
 |
 |
| Module-wise count rates for Quadrant D Data is divided into 100 sec bins |
 |
 |
| Parameter | Plot |
|---|---|
| CZT HV Monitor |  |
| D_VDD | 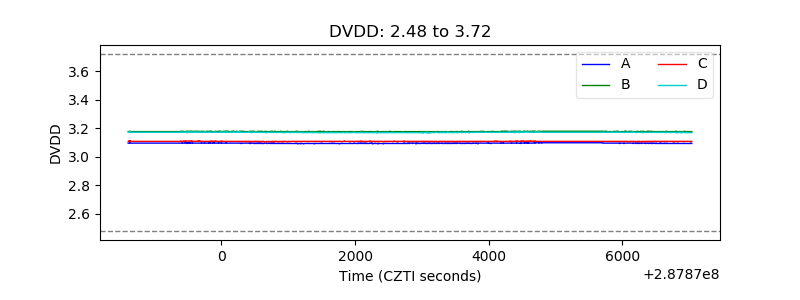 |
| Temperature 1 | 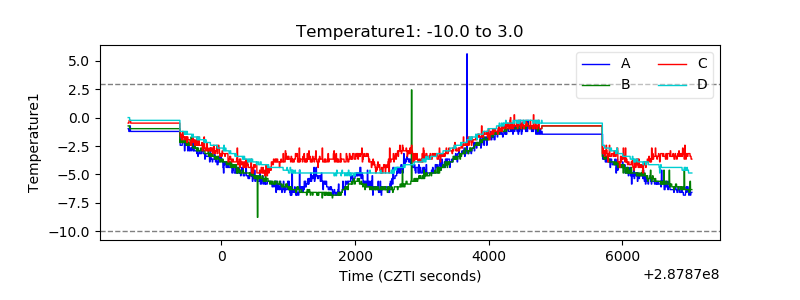 |
| Veto HV Monitor | 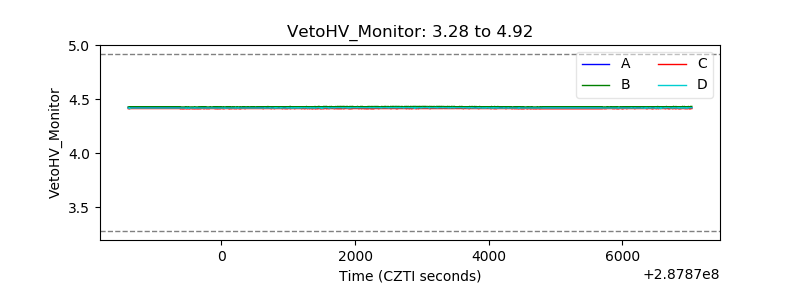 |
| Veto LLD | 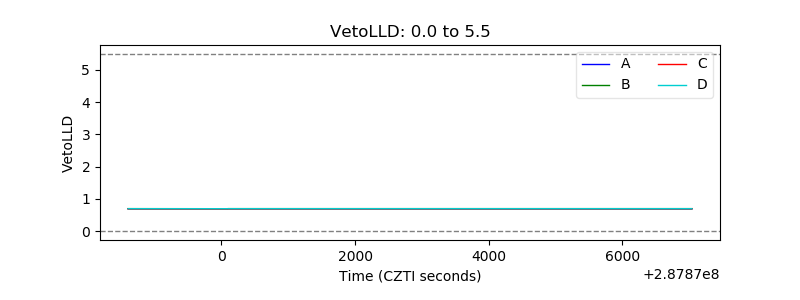 |
| Alpha Counter | 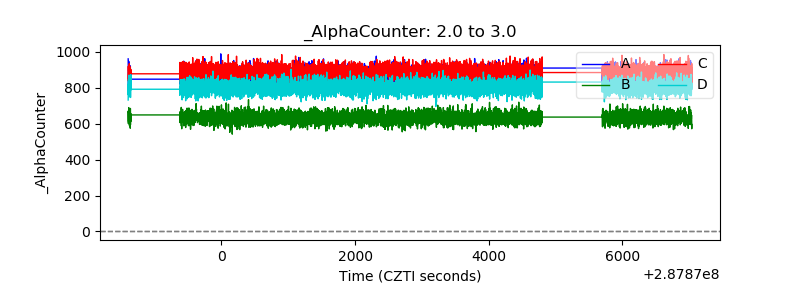 |
| _CPM_Rate | 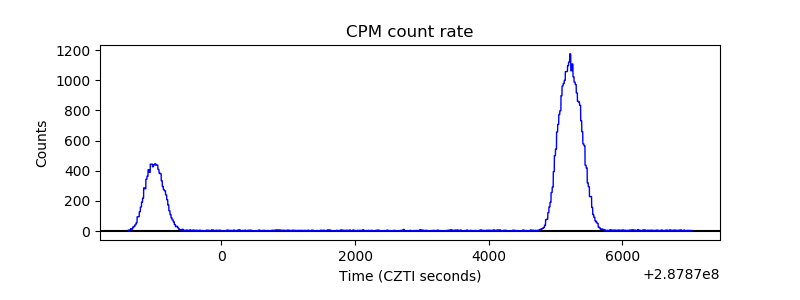 |
| CZT Counter | 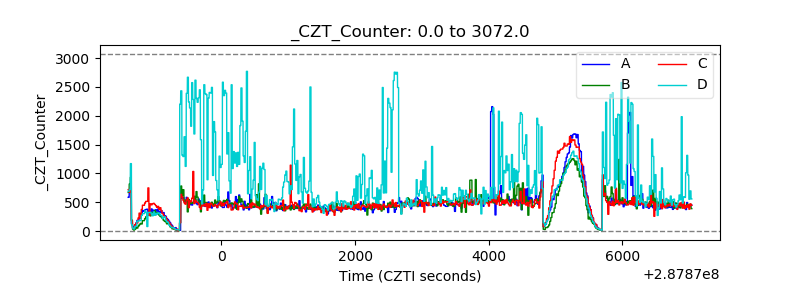 |
| +2.5 Volts monitor |  |
| +5 Volts monitor |  |
| _ROLL_ROT | 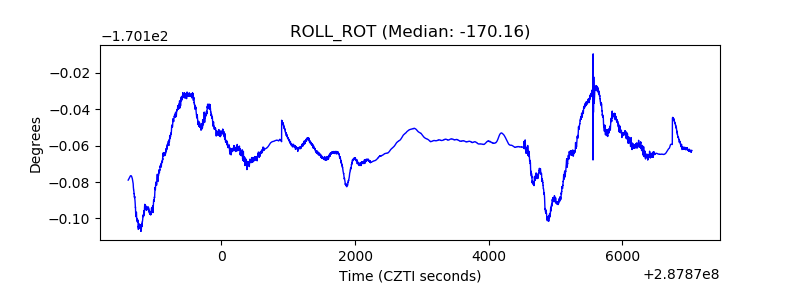 |
| _Roll_DEC | 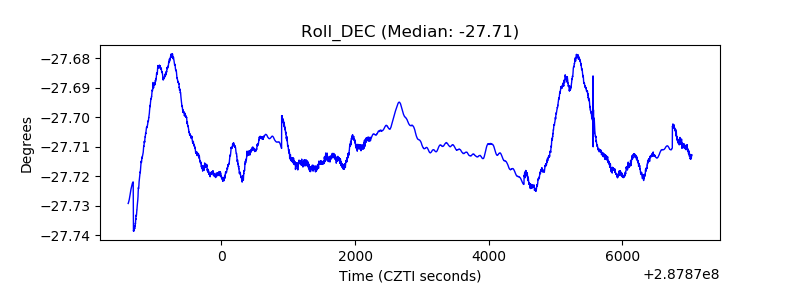 |
| _Roll_RA | 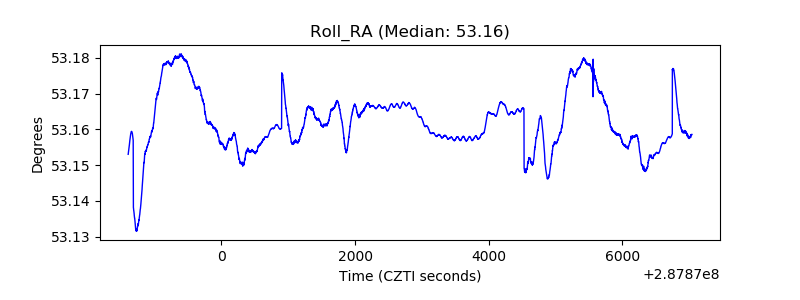 |
| Veto Counter | 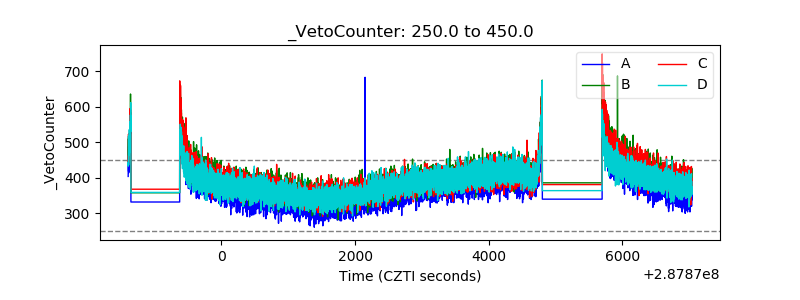 |