| Param | Original file | Final file |
|---|---|---|
| Filename | modeM0/AS1A06_006T01_9000002720_18291cztM0_level2.evt | modeM0/AS1A06_006T01_9000002720_18291cztM0_level2_quad_clean.evt |
| Size (bytes) | 550,497,600 | 81,720,000 |
| Size | 525.0 MB | 77.9 MB |
| Events in quadrant A | 3,911,341 | 511,506 |
| Events in quadrant B | 3,336,192 | 519,352 |
| Events in quadrant C | 3,164,366 | 502,358 |
| Events in quadrant D | 5,805,672 | 473,743 |
| Mode SS | |||
|---|---|---|---|
| Quadrant | BADHDUFLAG | Total packets | Discarded packets |
| A | 0 | 134 | 0 |
| B | 0 | 134 | 0 |
| C | 0 | 134 | 0 |
| D | 0 | 134 | 0 |
| Mode M9 | |||
|---|---|---|---|
| Quadrant | BADHDUFLAG | Total packets | Discarded packets |
| A | 0 | 13 | 0 |
| B | 0 | 14 | 0 |
| C | 0 | 14 | 0 |
| D | 0 | 14 | 0 |
| Mode M0 | |||
|---|---|---|---|
| Quadrant | BADHDUFLAG | Total packets | Discarded packets |
| A | 0 | 15941 | 2 |
| B | 0 | 14135 | 2 |
| C | 0 | 13633 | 2 |
| D | 0 | 21810 | 2 |
| Quadrant | Total seconds | Saturated seconds | Saturation percentage |
|---|---|---|---|
| A | 6713 | 87 | 1.295993% |
| B | 6713 | 29 | 0.431998% |
| C | 6713 | 34 | 0.506480% |
| D | 6713 | 274 | 4.081633% |
Noise dominated data is calculated using 1-second bins in cleaned event files. If a bin has >2000 counts, and if more than 50% of those come from <1% of pixels, then it is considered to be noise-dominated and hence unusable.
| Quadrant | # 1 sec bins | Bins with >0 counts | Bins with >2000 counts | High rate bins dominated by noise | Noise dominated (total time) | Noise dominated (detector-on time) | Marked lightcurve |
|---|---|---|---|---|---|---|---|
| A | 7783 | 6714 | 61 | 61 | 0.78% | 0.91% | 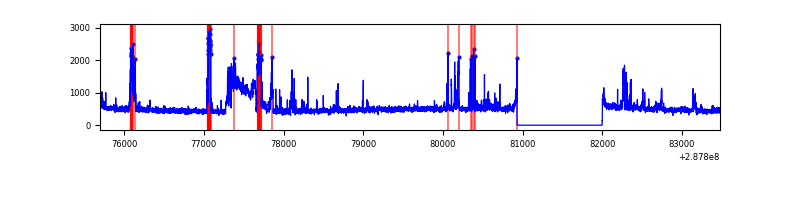 |
| B | 7783 | 6714 | 3 | 3 | 0.04% | 0.04% | 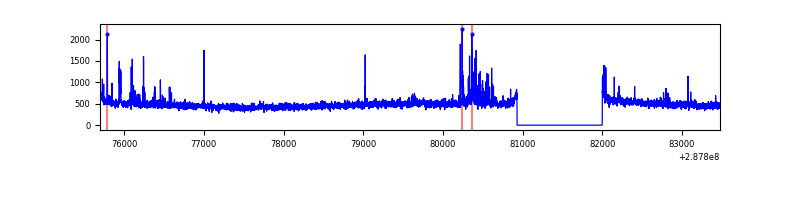 |
| C | 7783 | 6714 | 0 | 0 | 0.00% | 0.00% | 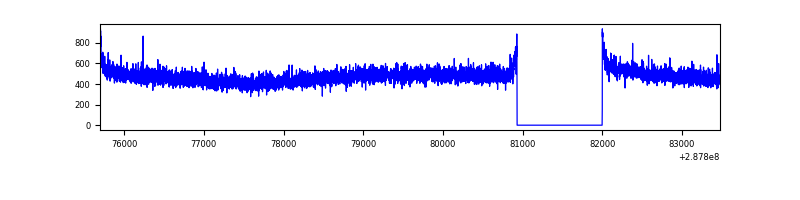 |
| D | 7783 | 6714 | 232 | 232 | 2.98% | 3.46% | 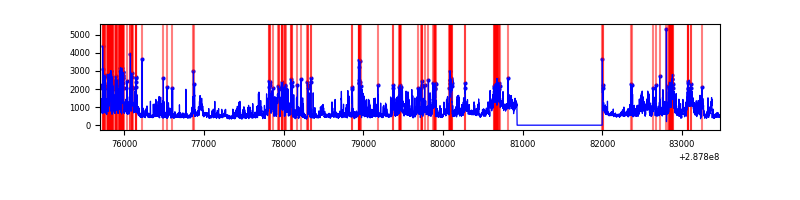 |
Top three noisy pixels from each quadrant. If the there are fewer than three noisy pixels in the level2.evt file, extra rows are filled as -1
| Pixel properties | Quadrant properties | ||||||
|---|---|---|---|---|---|---|---|
| Quadrant | DetID | PixID | Counts | Sigma | Mean | Median | Sigma |
| A | 15 | 174 | 699036 | 4276.81 | 806 | 791 | 163.3 |
| A | 9 | 143 | 111059 | 675.4 | 806 | 791 | 163.3 |
| A | 0 | 226 | 7063 | 38.42 | 806 | 791 | 163.3 |
| B | 7 | 220 | 85139 | 538.09 | 813 | 792 | 156.8 |
| B | 0 | 197 | 25953 | 160.51 | 813 | 792 | 156.8 |
| B | 12 | 111 | 17979 | 109.64 | 813 | 792 | 156.8 |
| C | 14 | 238 | 119961 | 650.78 | 779 | 787 | 183.1 |
| C | 13 | 61 | 5539 | 25.95 | 779 | 787 | 183.1 |
| C | 3 | 233 | 4896 | 22.44 | 779 | 787 | 183.1 |
| D | 7 | 238 | 1920660 | 10066.21 | 775 | 752 | 190.7 |
| D | 1 | 52 | 365617 | 1913.01 | 775 | 752 | 190.7 |
| D | 13 | 168 | 248023 | 1296.46 | 775 | 752 | 190.7 |
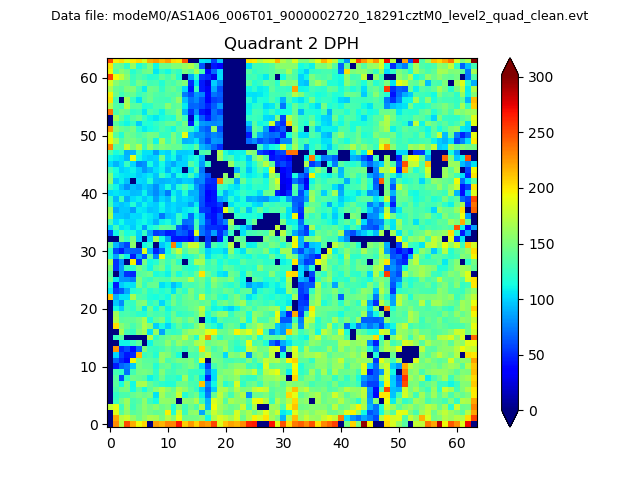
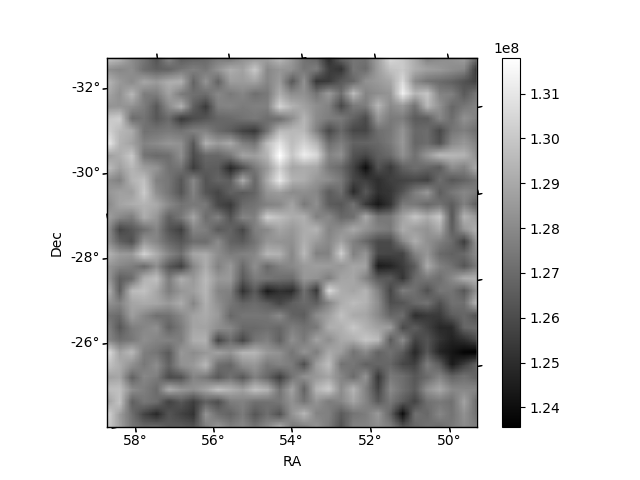
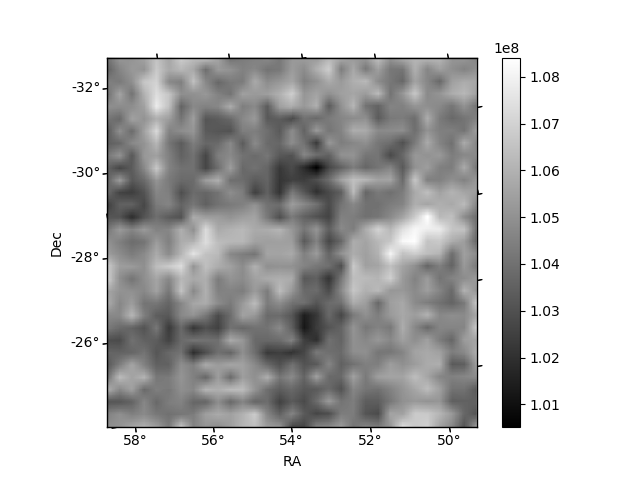
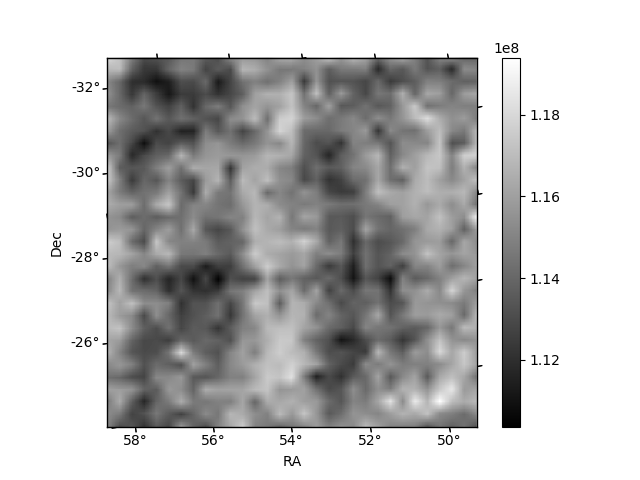
Histogram calculated using DETX and DETY for each event in the final _common_clean file
| Quadrant A | 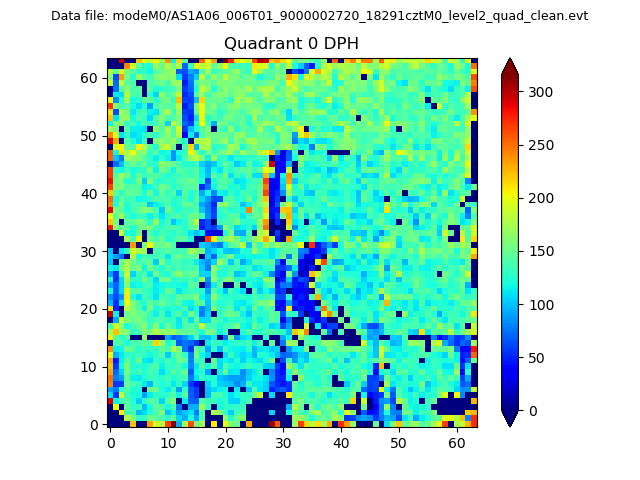 |
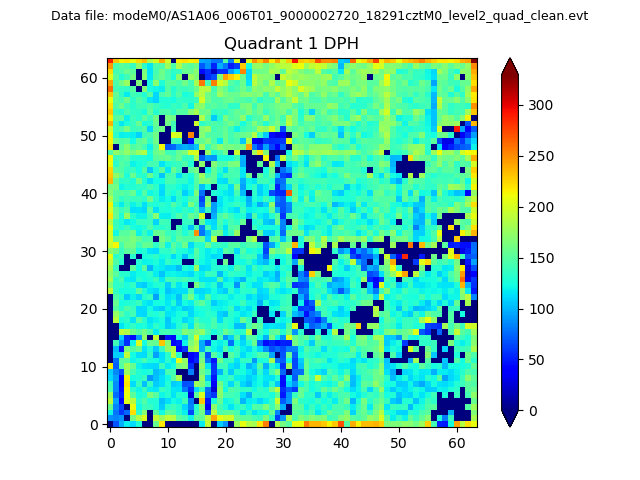 |
Quadrant B |
|---|---|---|---|
| Quadrant D | 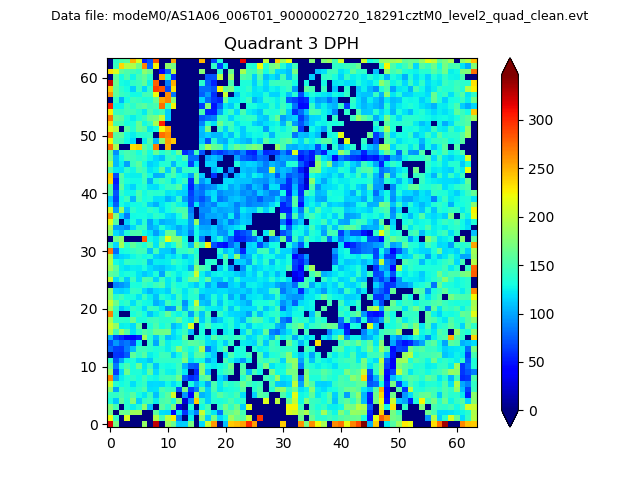 |
 |
Quadrant C |
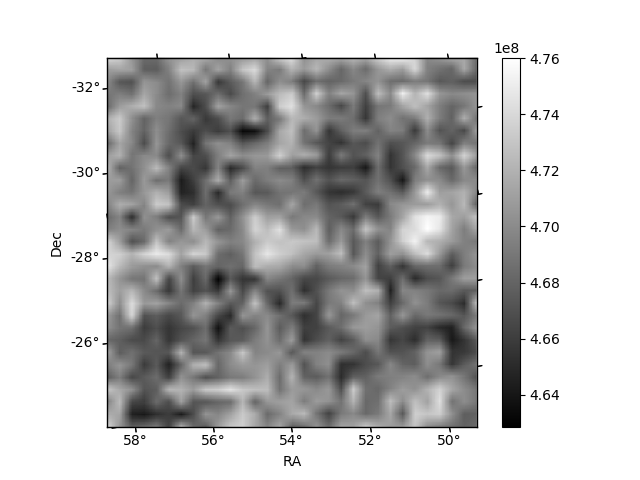
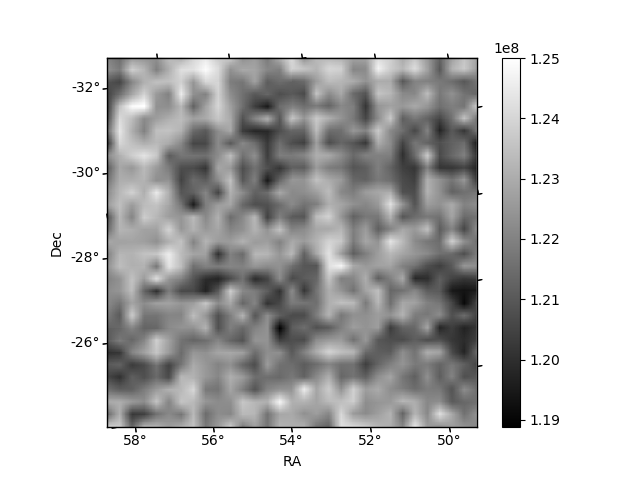
| Plot type | Count rate plots | Images |
|---|---|---|
| Comparison with Poisson distribution Blue bars denote a histogram of data divided into 1 sec bins. Red curve is a Poisson curve with rate = median count rate of data. |
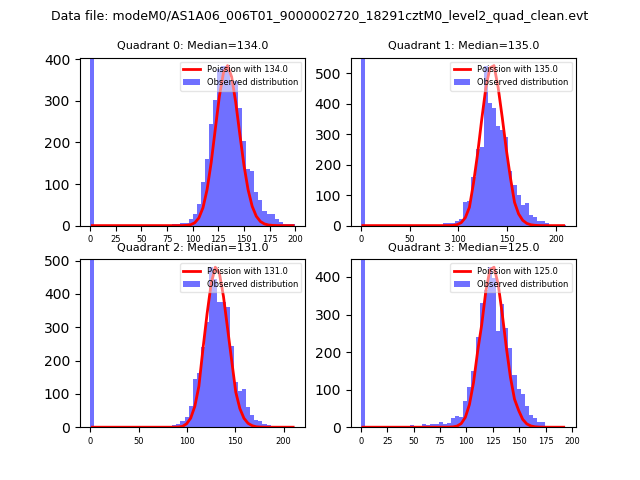 |
 |
| Quadrant-wise count rates Data is divided into 100 sec bins |
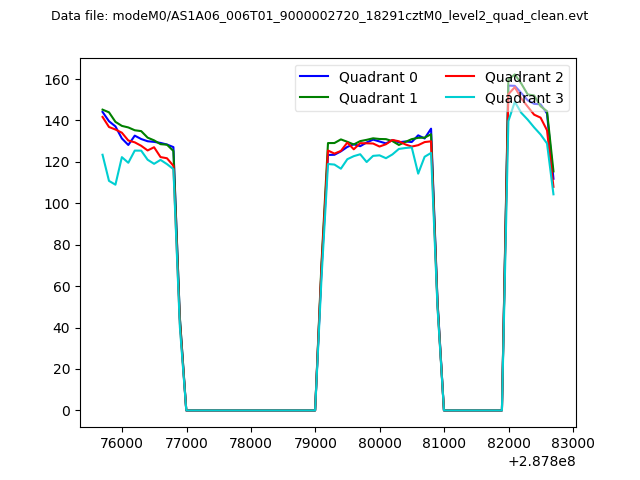 |
|
| Module-wise count rates for Quadrant A Data is divided into 100 sec bins |
 |
 |
| Module-wise count rates for Quadrant B Data is divided into 100 sec bins |
 |
 |
| Module-wise count rates for Quadrant C Data is divided into 100 sec bins |
 |
 |
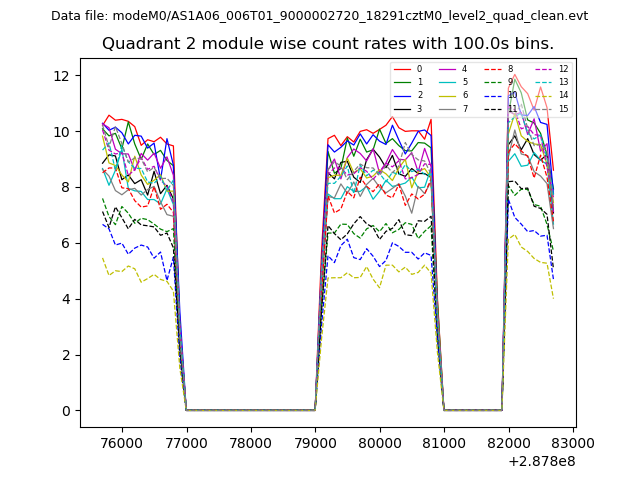
| Module-wise count rates for Quadrant D Data is divided into 100 sec bins |
 |
 |
| Parameter | Plot |
|---|---|
| CZT HV Monitor |  |
| D_VDD | 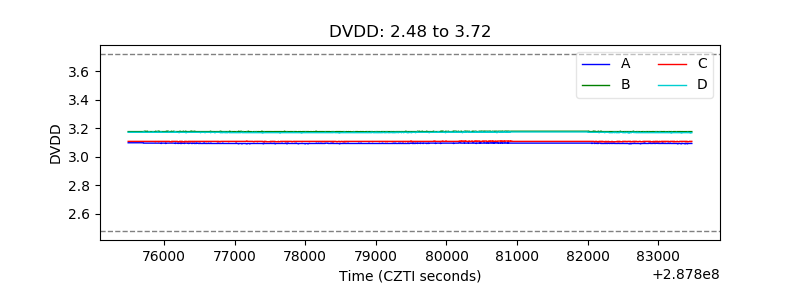 |
| Temperature 1 |  |
| Veto HV Monitor | 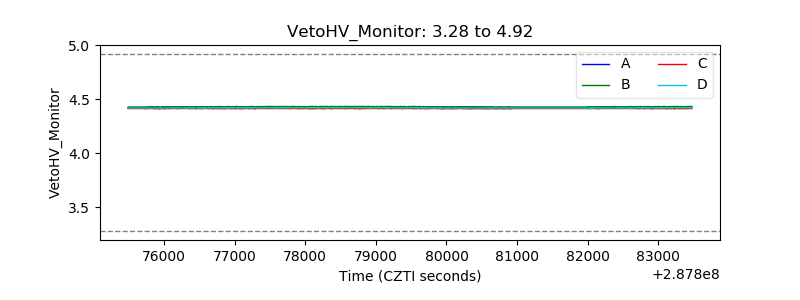 |
| Veto LLD | 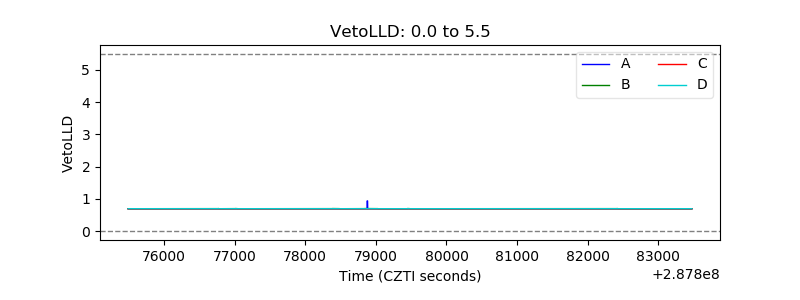 |
| Alpha Counter |  |
| _CPM_Rate | 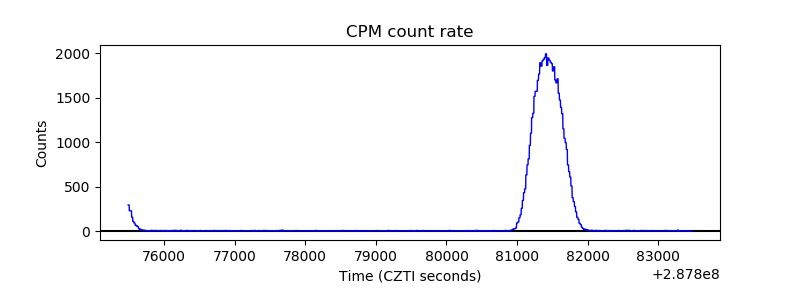 |
| CZT Counter |  |
| +2.5 Volts monitor |  |
| +5 Volts monitor |  |
| _ROLL_ROT |  |
| _Roll_DEC | 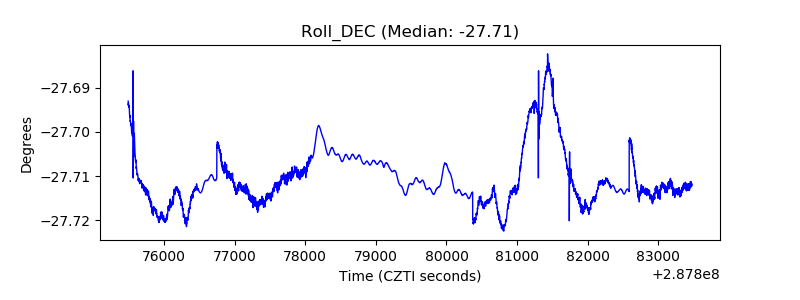 |
| _Roll_RA | 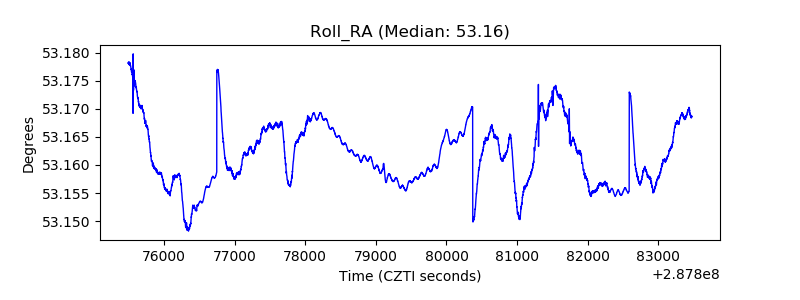 |
| Veto Counter | 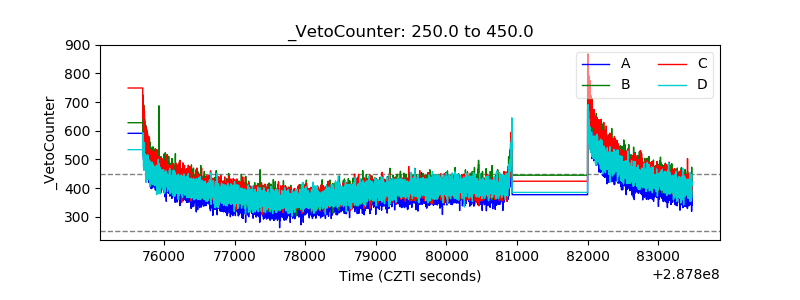 |