| Param | Original file | Final file |
|---|---|---|
| Filename | modeM0/AS1A06_006T01_9000002720_18294cztM0_level2.evt | modeM0/AS1A06_006T01_9000002720_18294cztM0_level2_quad_clean.evt |
| Size (bytes) | 617,569,920 | 63,308,160 |
| Size | 589.0 MB | 60.4 MB |
| Events in quadrant A | 3,359,134 | 387,962 |
| Events in quadrant B | 3,403,081 | 394,492 |
| Events in quadrant C | 3,317,862 | 382,641 |
| Events in quadrant D | 8,196,060 | 310,739 |
| Mode SS | |||
|---|---|---|---|
| Quadrant | BADHDUFLAG | Total packets | Discarded packets |
| A | 0 | 128 | 0 |
| B | 0 | 128 | 0 |
| C | 0 | 128 | 0 |
| D | 0 | 128 | 0 |
| Mode M9 | |||
|---|---|---|---|
| Quadrant | BADHDUFLAG | Total packets | Discarded packets |
| A | 0 | 16 | 0 |
| B | 0 | 17 | 0 |
| C | 0 | 17 | 0 |
| D | 0 | 17 | 0 |
| Mode M0 | |||
|---|---|---|---|
| Quadrant | BADHDUFLAG | Total packets | Discarded packets |
| A | 0 | 13736 | 2 |
| B | 0 | 13882 | 2 |
| C | 0 | 13629 | 2 |
| D | 0 | 28765 | 2 |
| Quadrant | Total seconds | Saturated seconds | Saturation percentage |
|---|---|---|---|
| A | 6310 | 39 | 0.618067% |
| B | 6310 | 56 | 0.887480% |
| C | 6310 | 82 | 1.299525% |
| D | 6310 | 1347 | 21.347068% |
Noise dominated data is calculated using 1-second bins in cleaned event files. If a bin has >2000 counts, and if more than 50% of those come from <1% of pixels, then it is considered to be noise-dominated and hence unusable.
| Quadrant | # 1 sec bins | Bins with >0 counts | Bins with >2000 counts | High rate bins dominated by noise | Noise dominated (total time) | Noise dominated (detector-on time) | Marked lightcurve |
|---|---|---|---|---|---|---|---|
| A | 7575 | 6311 | 3 | 3 | 0.04% | 0.05% | 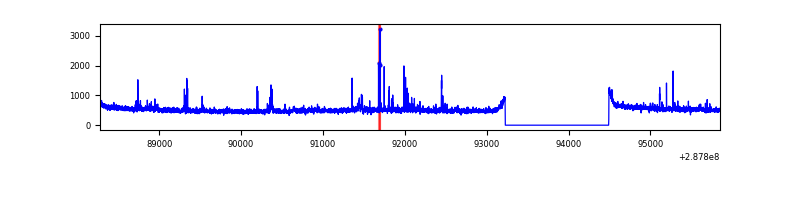 |
| B | 7575 | 6311 | 3 | 3 | 0.04% | 0.05% | 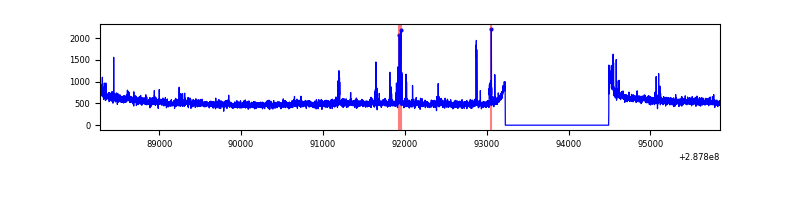 |
| C | 7575 | 6311 | 3 | 3 | 0.04% | 0.05% | 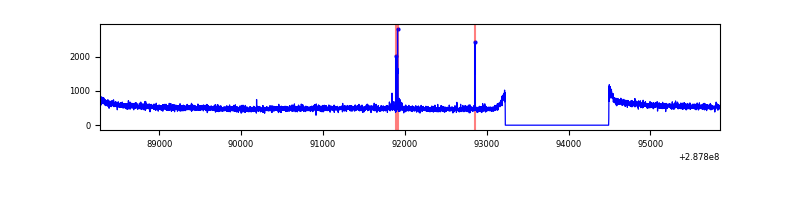 |
| D | 7575 | 6311 | 1306 | 1306 | 17.24% | 20.69% | 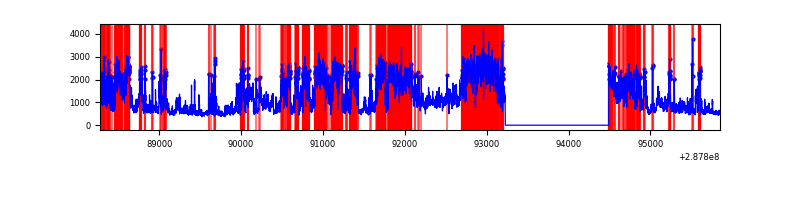 |
Top three noisy pixels from each quadrant. If the there are fewer than three noisy pixels in the level2.evt file, extra rows are filled as -1
| Pixel properties | Quadrant properties | ||||||
|---|---|---|---|---|---|---|---|
| Quadrant | DetID | PixID | Counts | Sigma | Mean | Median | Sigma |
| A | 9 | 143 | 85920 | 511.14 | 838 | 823 | 166.5 |
| A | 15 | 174 | 54835 | 324.43 | 838 | 823 | 166.5 |
| A | 0 | 226 | 7185 | 38.21 | 838 | 823 | 166.5 |
| B | 0 | 244 | 26685 | 164.92 | 843 | 828 | 156.8 |
| B | 7 | 220 | 22092 | 135.63 | 843 | 828 | 156.8 |
| B | 0 | 189 | 19939 | 121.89 | 843 | 828 | 156.8 |
| C | 14 | 238 | 127859 | 679.86 | 811 | 818 | 186.9 |
| C | 0 | 207 | 29007 | 150.85 | 811 | 818 | 186.9 |
| C | 13 | 61 | 5698 | 26.12 | 811 | 818 | 186.9 |
| D | 7 | 238 | 4806624 | 25969.81 | 761 | 740 | 185.1 |
| D | 1 | 52 | 293886 | 1584.09 | 761 | 740 | 185.1 |
| D | 13 | 168 | 89001 | 476.94 | 761 | 740 | 185.1 |
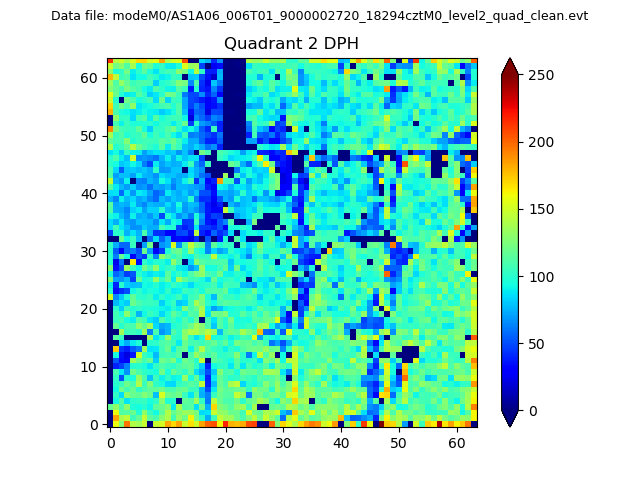
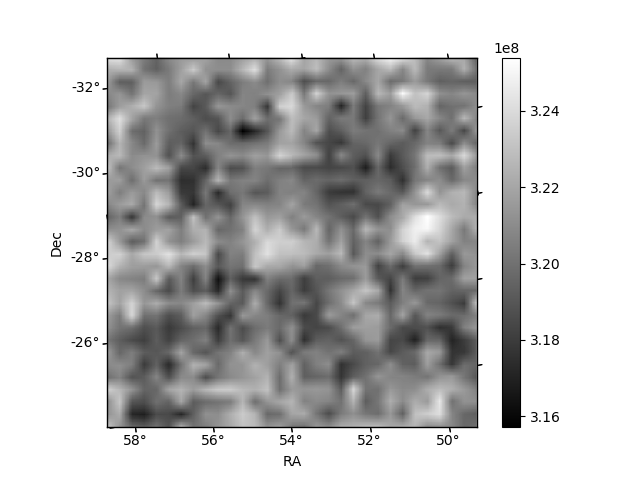
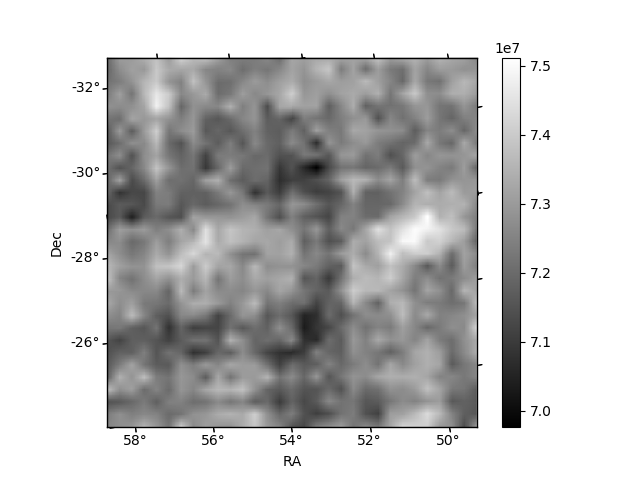
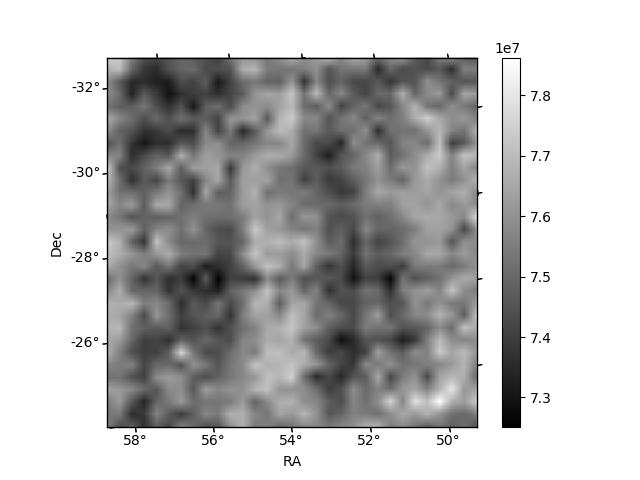
Histogram calculated using DETX and DETY for each event in the final _common_clean file
| Quadrant A | 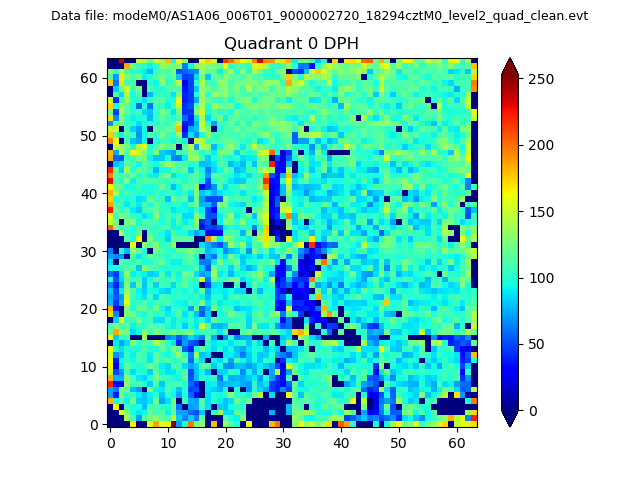 |
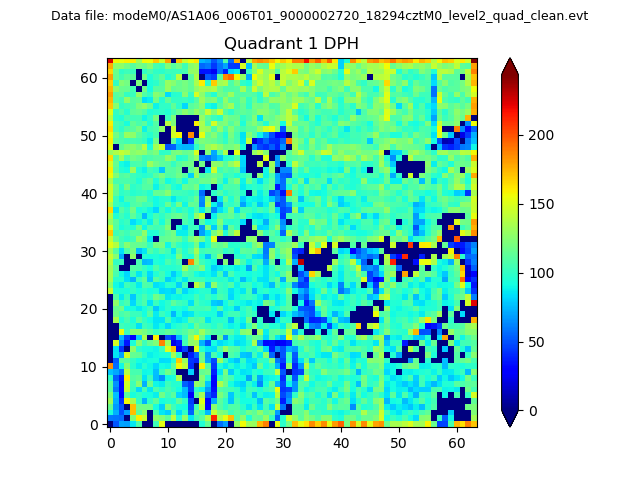 |
Quadrant B |
|---|---|---|---|
| Quadrant D | 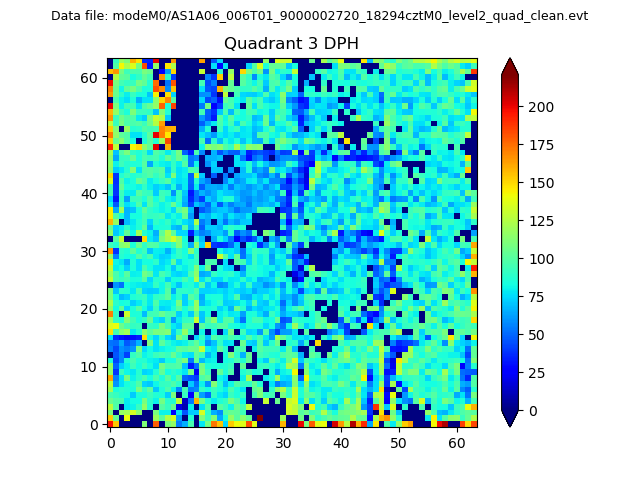 |
 |
Quadrant C |
| Plot type | Count rate plots | Images |
|---|---|---|
| Comparison with Poisson distribution Blue bars denote a histogram of data divided into 1 sec bins. Red curve is a Poisson curve with rate = median count rate of data. |
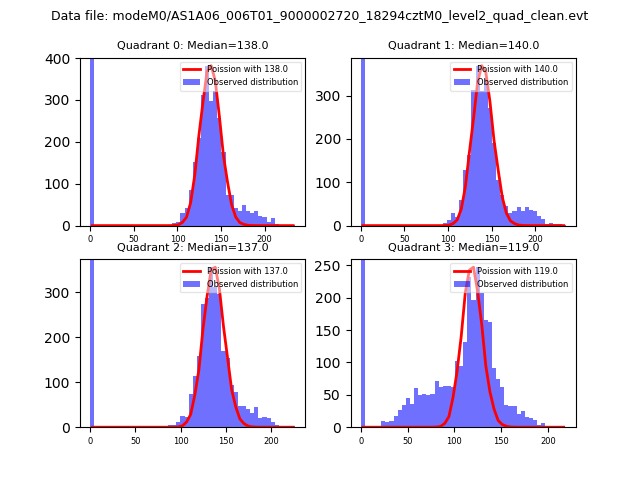 |
 |
| Quadrant-wise count rates Data is divided into 100 sec bins |
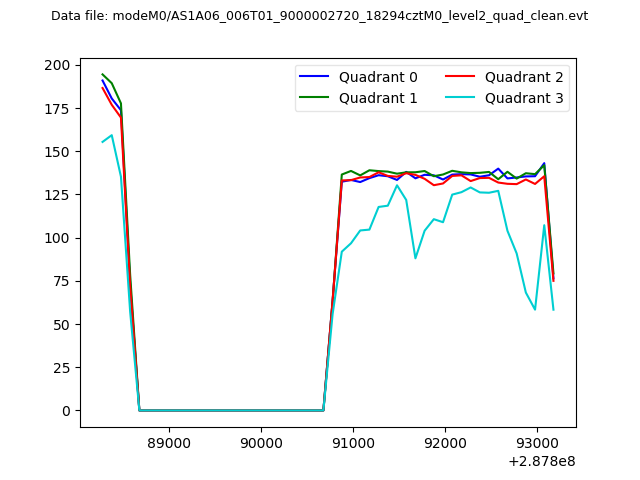 |
|
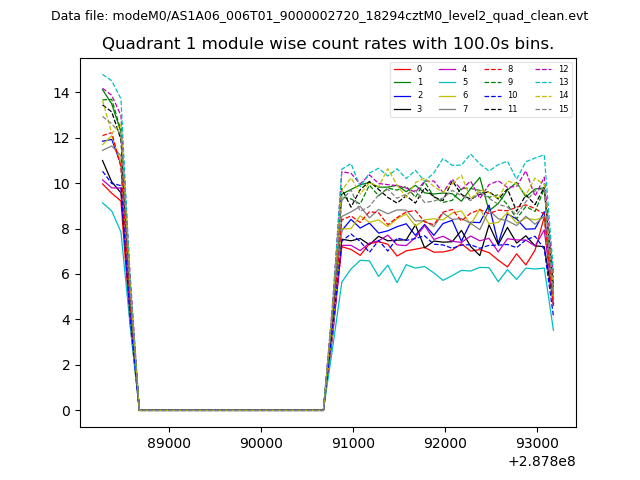
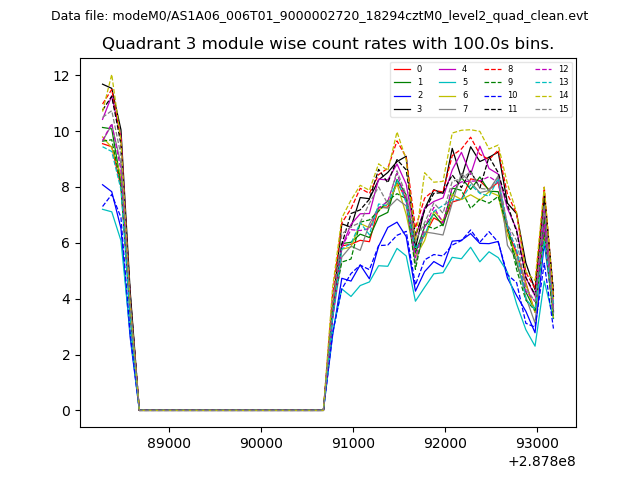
| Module-wise count rates for Quadrant A Data is divided into 100 sec bins |
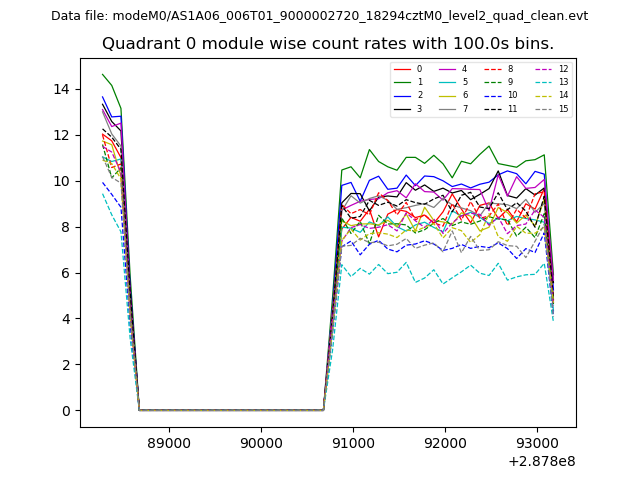 |
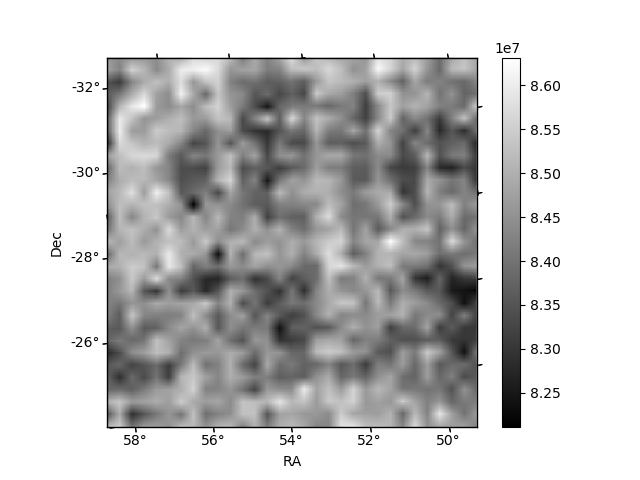 |
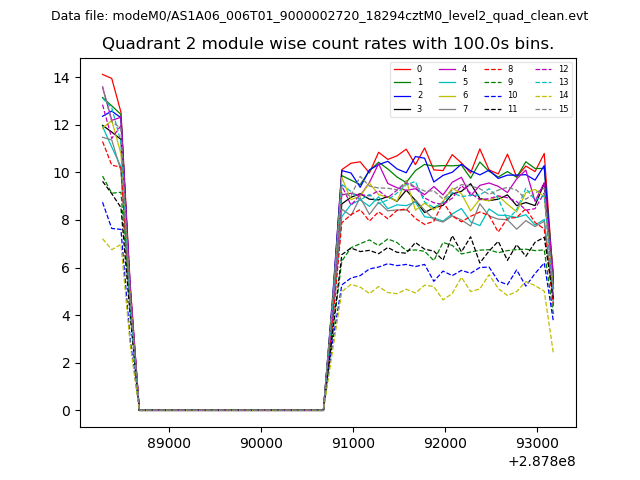
| Module-wise count rates for Quadrant B Data is divided into 100 sec bins |
 |
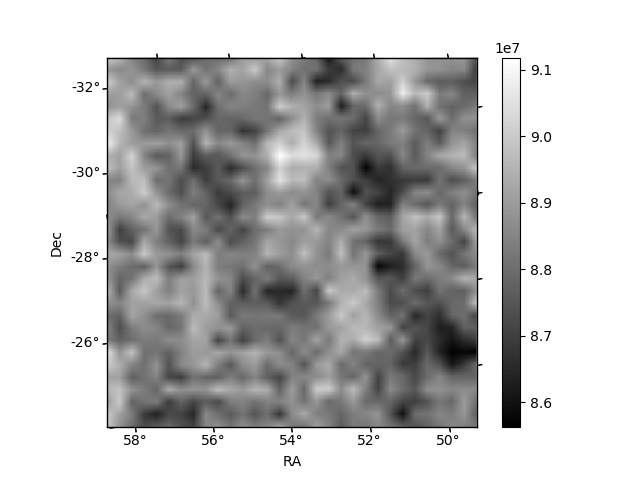 |
| Module-wise count rates for Quadrant C Data is divided into 100 sec bins |
 |
 |
| Module-wise count rates for Quadrant D Data is divided into 100 sec bins |
 |
 |
| Parameter | Plot |
|---|---|
| CZT HV Monitor | 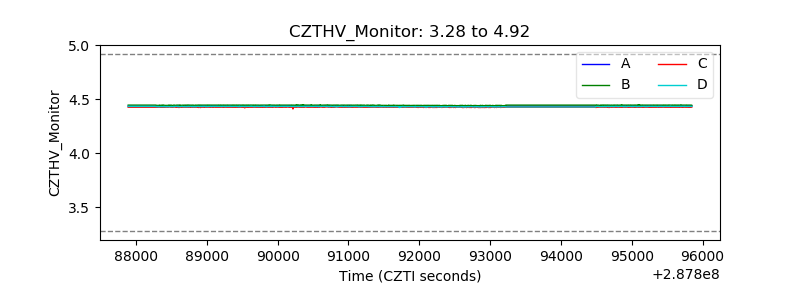 |
| D_VDD | 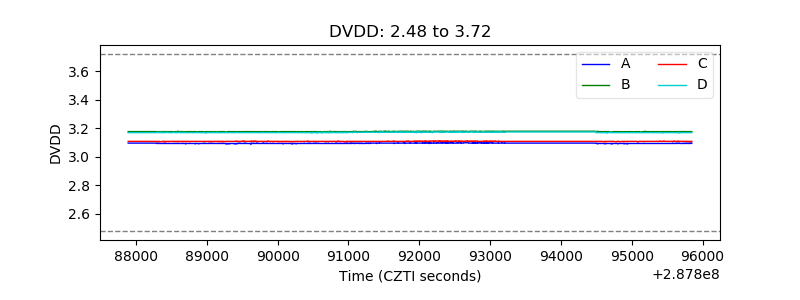 |
| Temperature 1 | 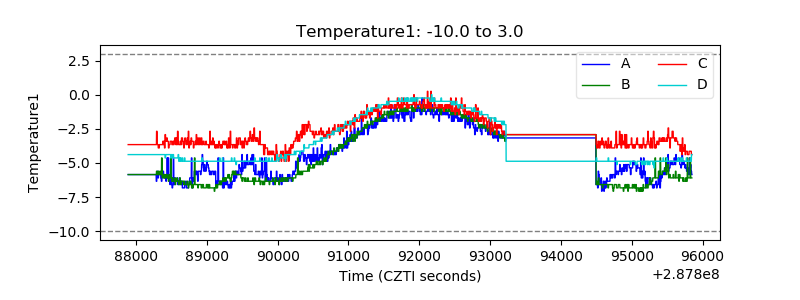 |
| Veto HV Monitor | 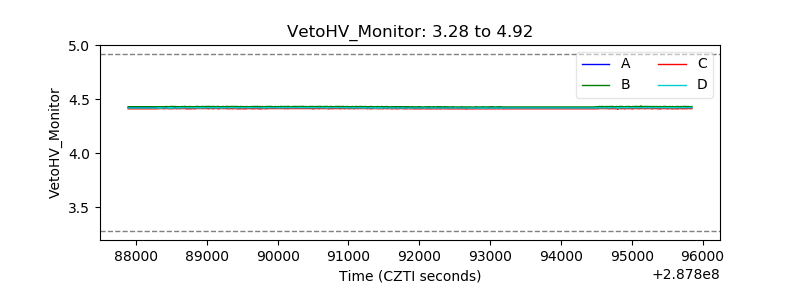 |
| Veto LLD | 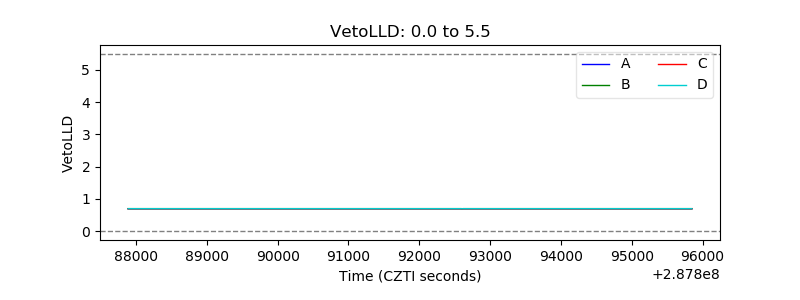 |
| Alpha Counter | 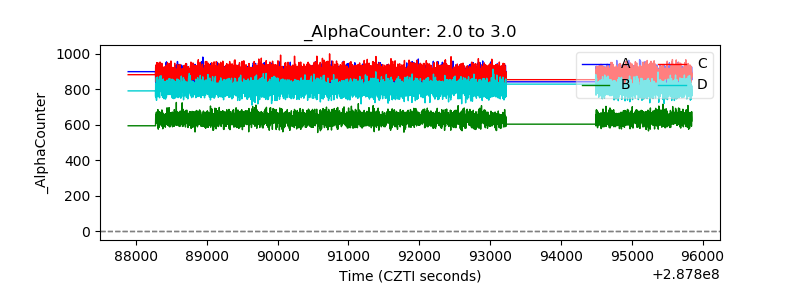 |
| _CPM_Rate | 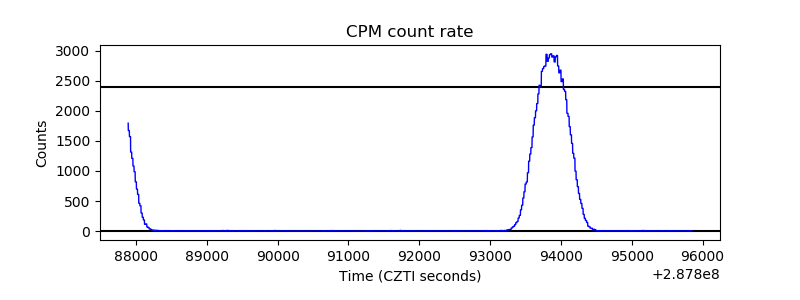 |
| CZT Counter | 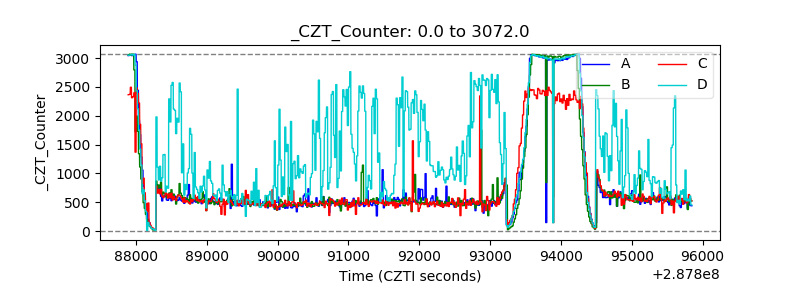 |
| +2.5 Volts monitor |  |
| +5 Volts monitor | 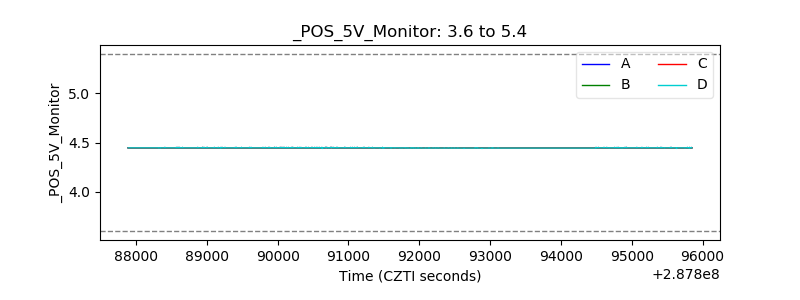 |
| _ROLL_ROT | 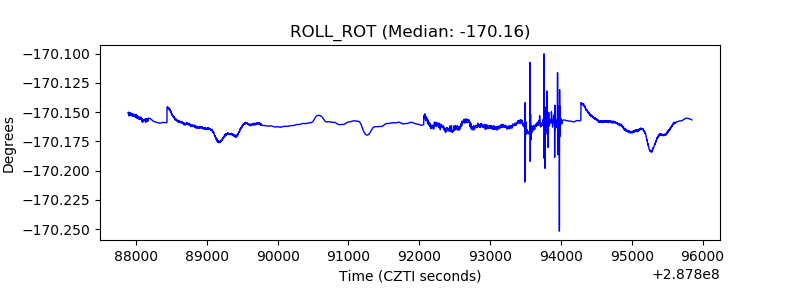 |
| _Roll_DEC | 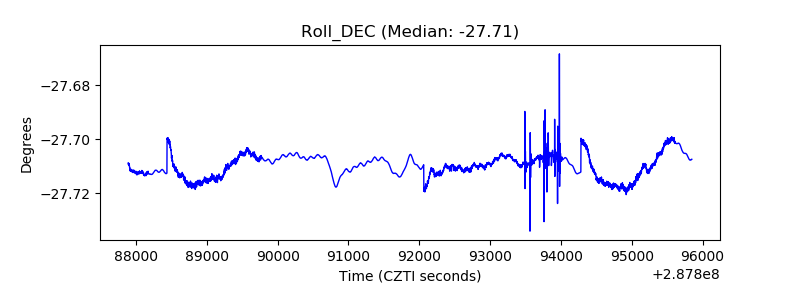 |
| _Roll_RA | 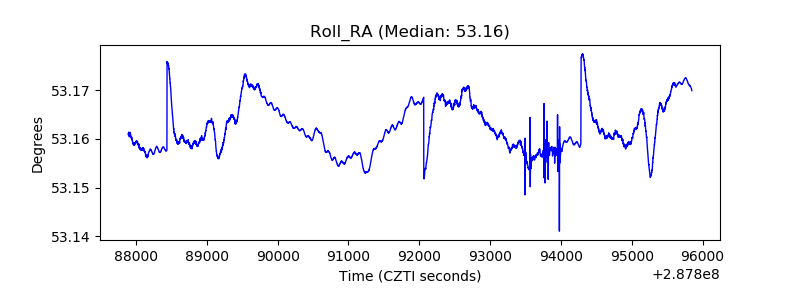 |
| Veto Counter | 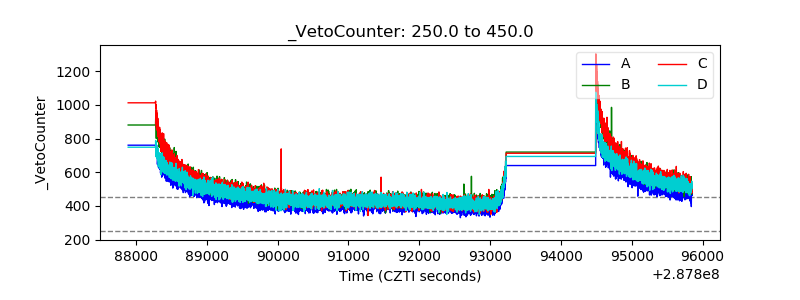 |