| Param | Original file | Final file |
|---|---|---|
| Filename | modeM0/AS1A06_006T01_9000002720_18295cztM0_level2.evt | modeM0/AS1A06_006T01_9000002720_18295cztM0_level2_quad_clean.evt |
| Size (bytes) | 565,012,800 | 63,509,760 |
| Size | 538.8 MB | 60.6 MB |
| Events in quadrant A | 3,376,815 | 385,166 |
| Events in quadrant B | 3,352,470 | 391,261 |
| Events in quadrant C | 3,392,616 | 379,900 |
| Events in quadrant D | 6,573,805 | 337,185 |
| Mode SS | |||
|---|---|---|---|
| Quadrant | BADHDUFLAG | Total packets | Discarded packets |
| A | 0 | 126 | 0 |
| B | 0 | 126 | 0 |
| C | 0 | 126 | 0 |
| D | 0 | 126 | 0 |
| Mode M9 | |||
|---|---|---|---|
| Quadrant | BADHDUFLAG | Total packets | Discarded packets |
| A | 0 | 15 | 0 |
| B | 0 | 16 | 0 |
| C | 0 | 16 | 0 |
| D | 0 | 16 | 0 |
| Mode M0 | |||
|---|---|---|---|
| Quadrant | BADHDUFLAG | Total packets | Discarded packets |
| A | 0 | 13629 | 2 |
| B | 0 | 13589 | 2 |
| C | 0 | 13765 | 2 |
| D | 0 | 23666 | 2 |
| Quadrant | Total seconds | Saturated seconds | Saturation percentage |
|---|---|---|---|
| A | 6141 | 69 | 1.123596% |
| B | 6141 | 56 | 0.911904% |
| C | 6141 | 110 | 1.791239% |
| D | 6140 | 695 | 11.319218% |
Noise dominated data is calculated using 1-second bins in cleaned event files. If a bin has >2000 counts, and if more than 50% of those come from <1% of pixels, then it is considered to be noise-dominated and hence unusable.
| Quadrant | # 1 sec bins | Bins with >0 counts | Bins with >2000 counts | High rate bins dominated by noise | Noise dominated (total time) | Noise dominated (detector-on time) | Marked lightcurve |
|---|---|---|---|---|---|---|---|
| A | 7506 | 6142 | 9 | 9 | 0.12% | 0.15% | 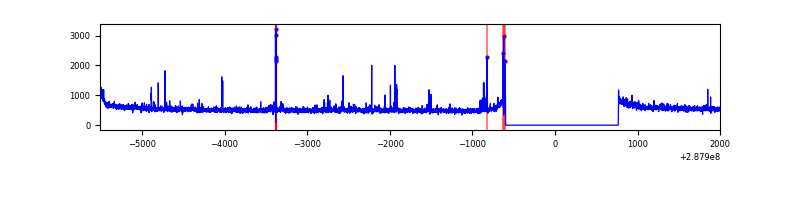 |
| B | 7506 | 6142 | 0 | 0 | 0.00% | 0.00% | 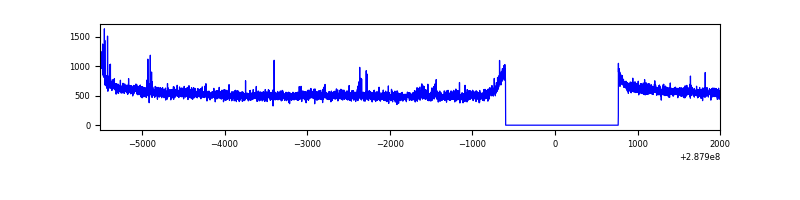 |
| C | 7506 | 6142 | 16 | 16 | 0.21% | 0.26% | 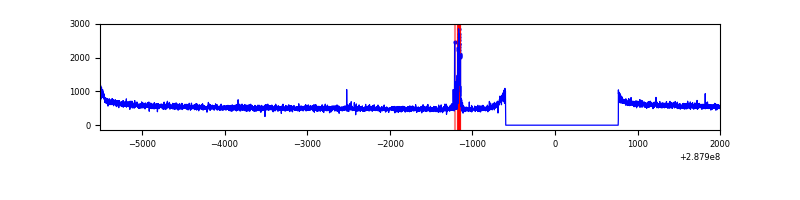 |
| D | 7505 | 6141 | 665 | 665 | 8.86% | 10.83% | 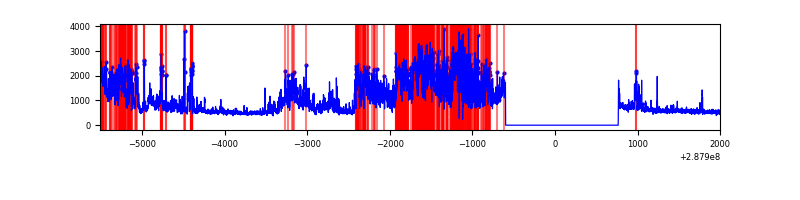 |
Top three noisy pixels from each quadrant. If the there are fewer than three noisy pixels in the level2.evt file, extra rows are filled as -1
| Pixel properties | Quadrant properties | ||||||
|---|---|---|---|---|---|---|---|
| Quadrant | DetID | PixID | Counts | Sigma | Mean | Median | Sigma |
| A | 9 | 143 | 76528 | 448.36 | 846 | 832 | 168.8 |
| A | 15 | 174 | 46021 | 267.66 | 846 | 832 | 168.8 |
| A | 0 | 226 | 7449 | 39.19 | 846 | 832 | 168.8 |
| B | 12 | 111 | 17541 | 105.09 | 850 | 832 | 159.0 |
| B | 11 | 111 | 14755 | 87.57 | 850 | 832 | 159.0 |
| B | 0 | 189 | 12990 | 76.47 | 850 | 832 | 159.0 |
| C | 14 | 238 | 129569 | 687.4 | 818 | 826 | 187.3 |
| C | 0 | 207 | 72640 | 383.43 | 818 | 826 | 187.3 |
| C | 13 | 61 | 5759 | 26.34 | 818 | 826 | 187.3 |
| D | 7 | 238 | 2843797 | 14840.25 | 799 | 780 | 191.6 |
| D | 10 | 199 | 377297 | 1965.38 | 799 | 780 | 191.6 |
| D | 1 | 52 | 160200 | 832.16 | 799 | 780 | 191.6 |
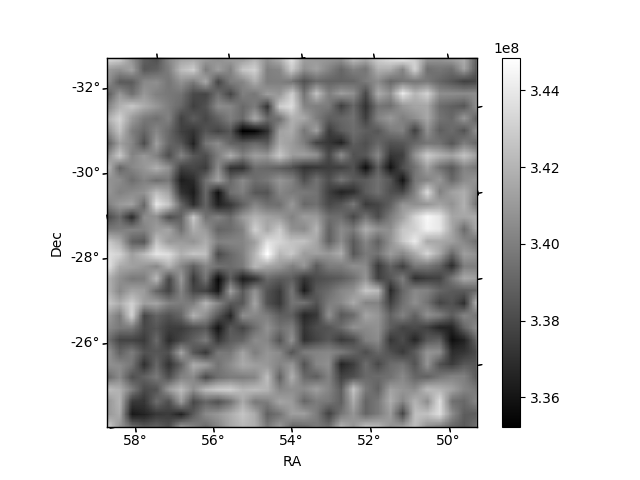
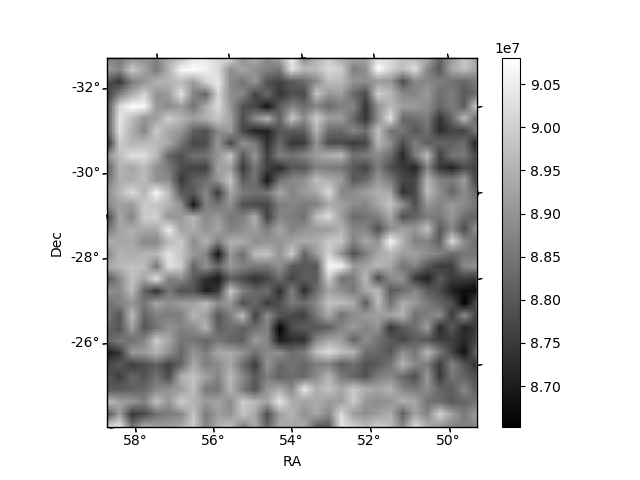
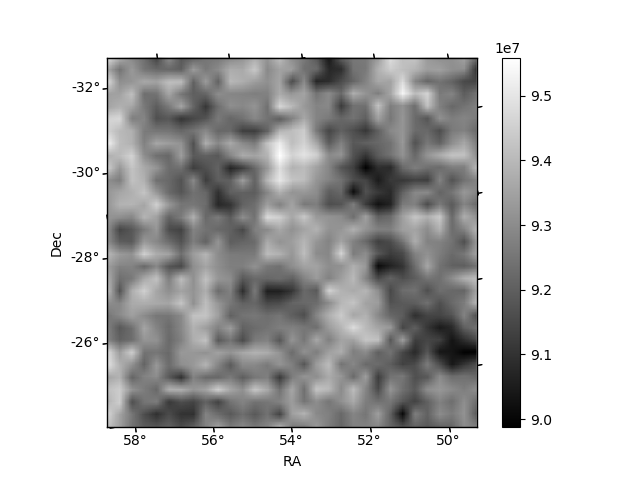
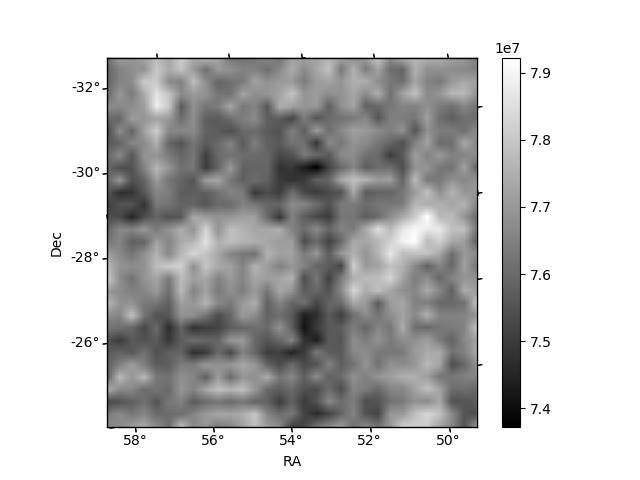
Histogram calculated using DETX and DETY for each event in the final _common_clean file
| Quadrant A | 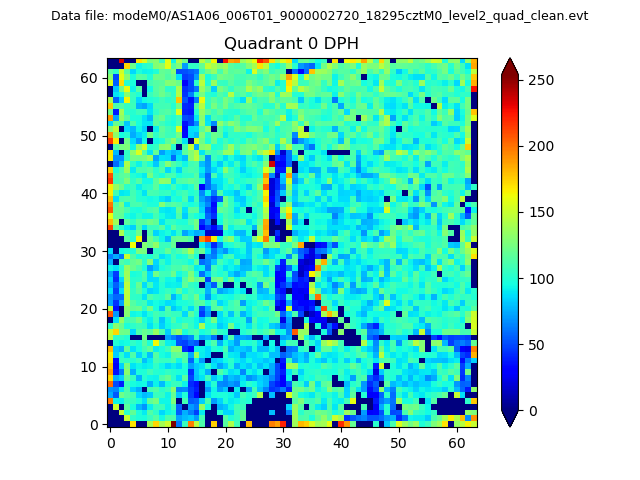 |
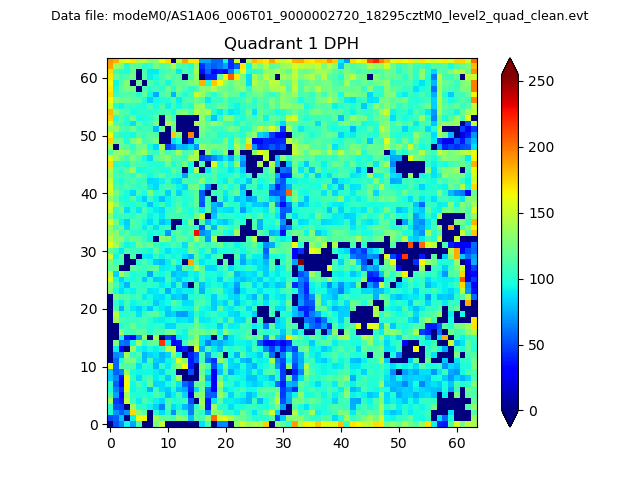 |
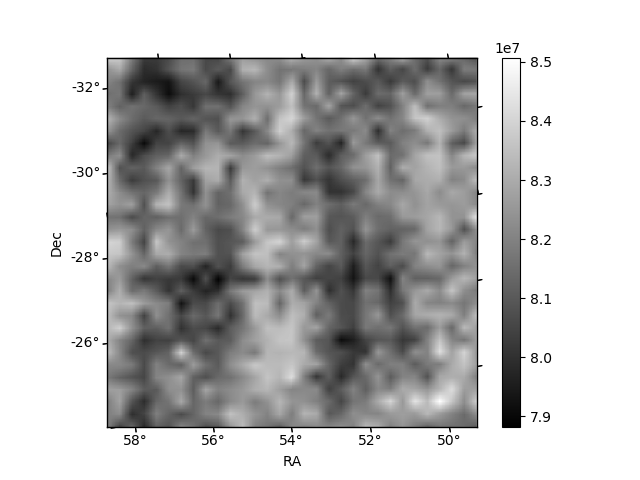
Quadrant B |
|---|---|---|---|
| Quadrant D | 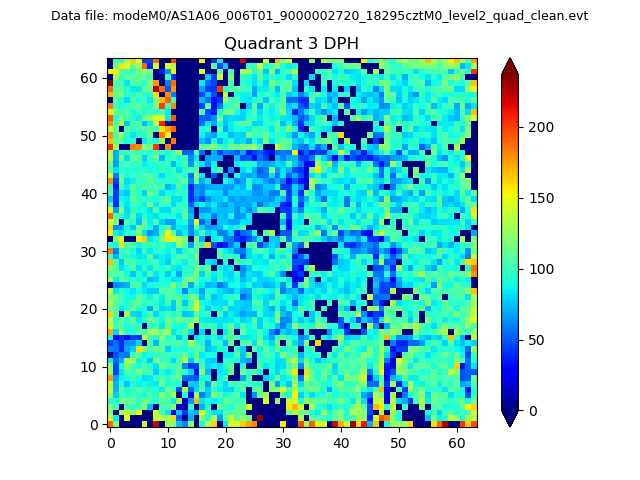 |
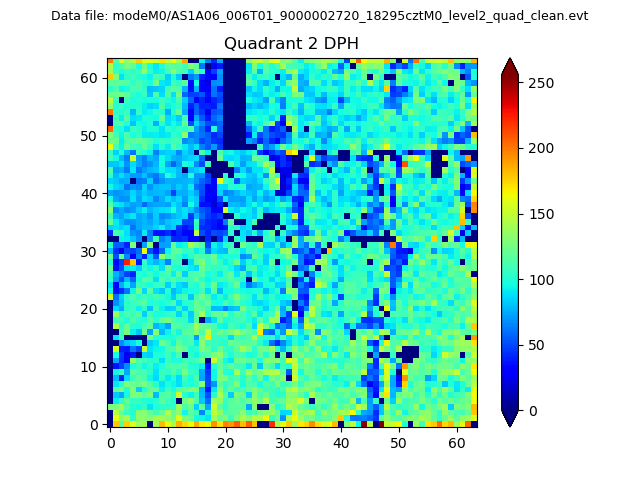 |
Quadrant C |
| Plot type | Count rate plots | Images |
|---|---|---|
| Comparison with Poisson distribution Blue bars denote a histogram of data divided into 1 sec bins. Red curve is a Poisson curve with rate = median count rate of data. |
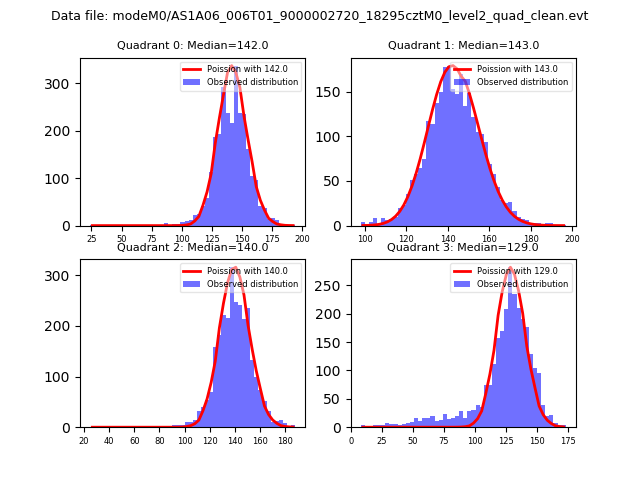 |
 |
| Quadrant-wise count rates Data is divided into 100 sec bins |
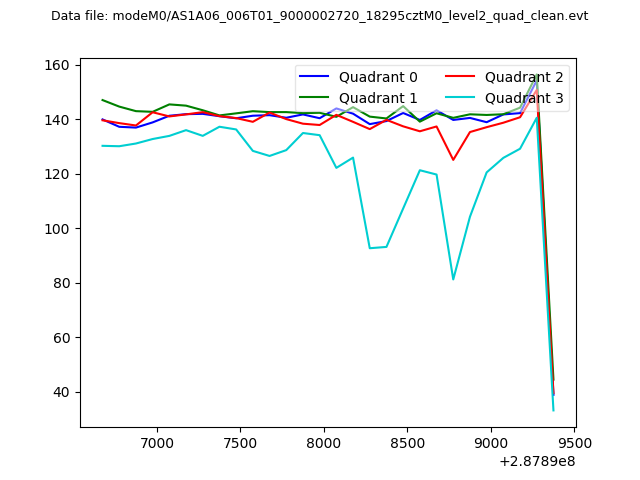 |
|
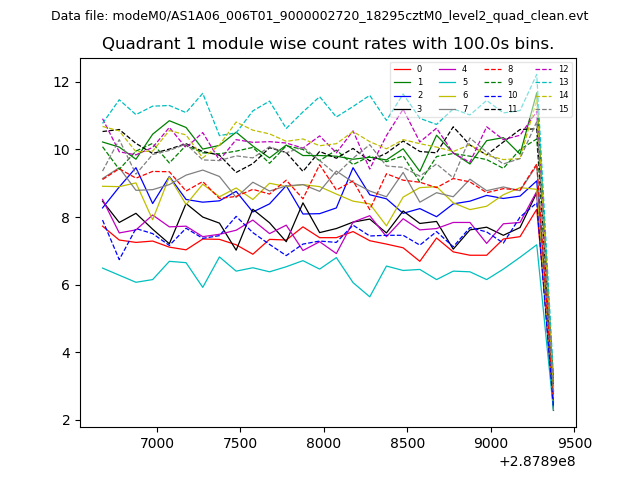
| Module-wise count rates for Quadrant A Data is divided into 100 sec bins |
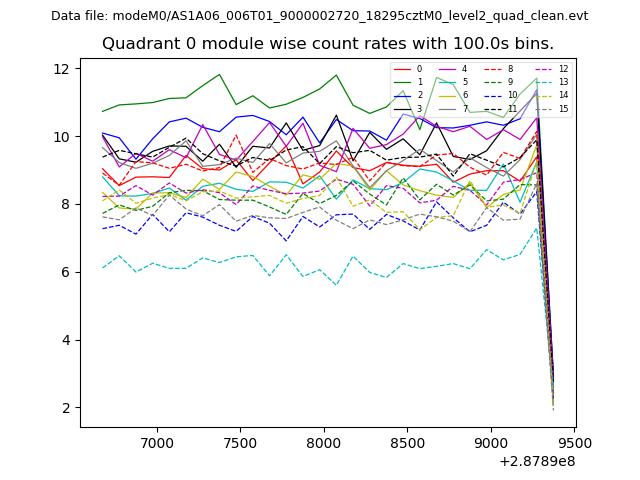 |
 |
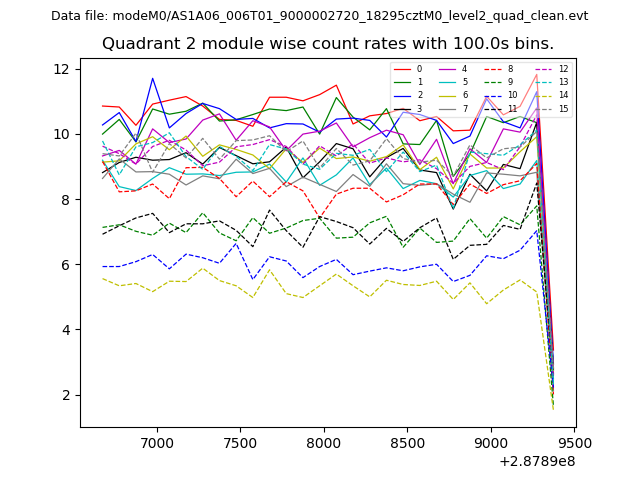
| Module-wise count rates for Quadrant B Data is divided into 100 sec bins |
 |
 |
| Module-wise count rates for Quadrant C Data is divided into 100 sec bins |
 |
 |
| Module-wise count rates for Quadrant D Data is divided into 100 sec bins |
 |
 |
| Parameter | Plot |
|---|---|
| CZT HV Monitor | 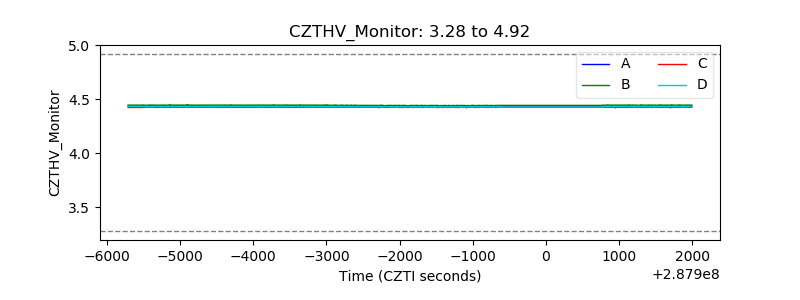 |
| D_VDD | 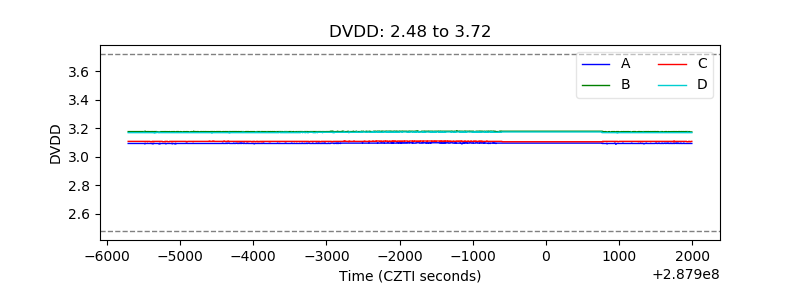 |
| Temperature 1 | 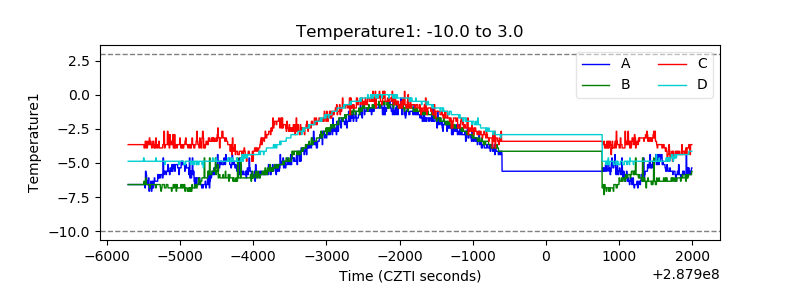 |
| Veto HV Monitor | 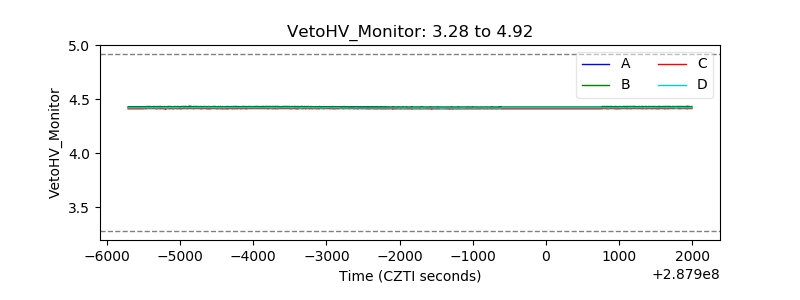 |
| Veto LLD | 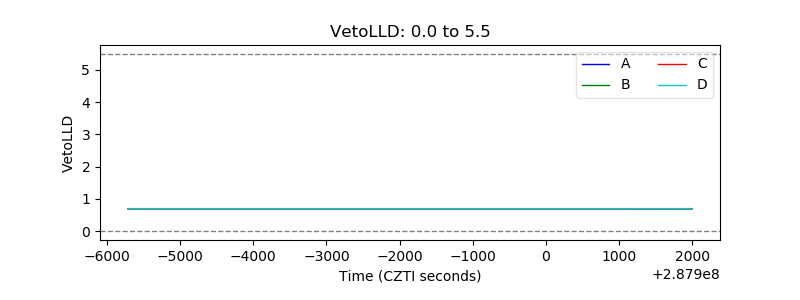 |
| Alpha Counter | 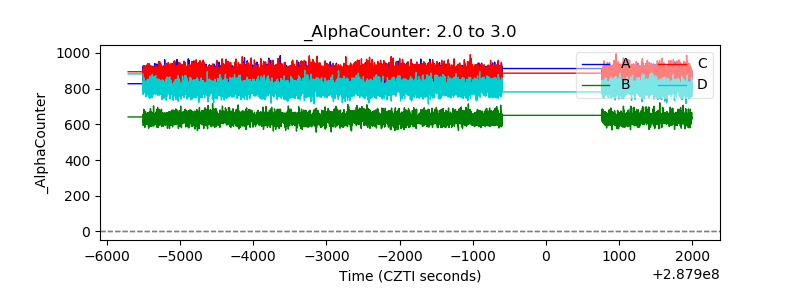 |
| _CPM_Rate | 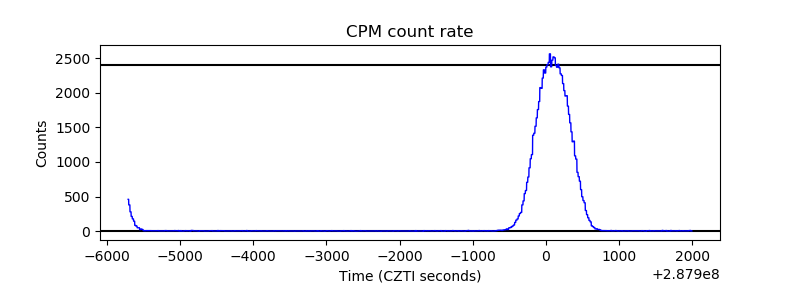 |
| CZT Counter | 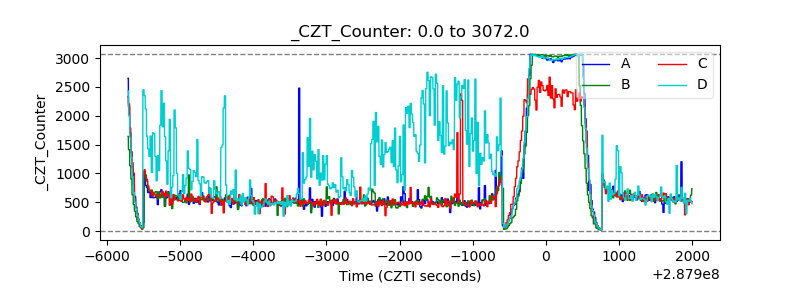 |
| +2.5 Volts monitor |  |
| +5 Volts monitor |  |
| _ROLL_ROT | 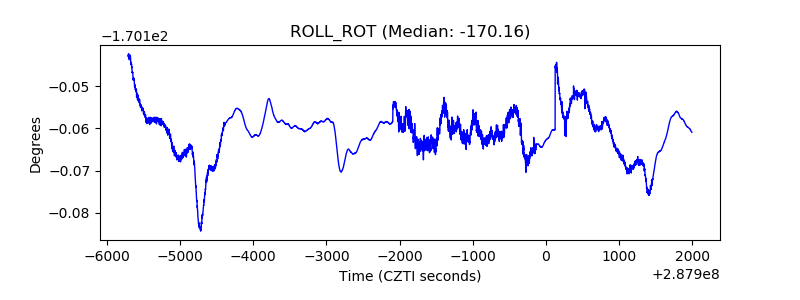 |
| _Roll_DEC | 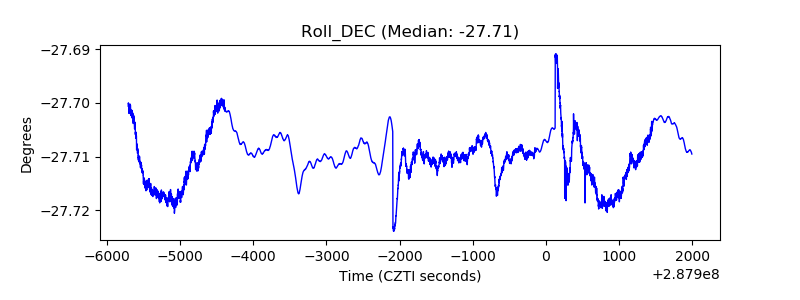 |
| _Roll_RA | 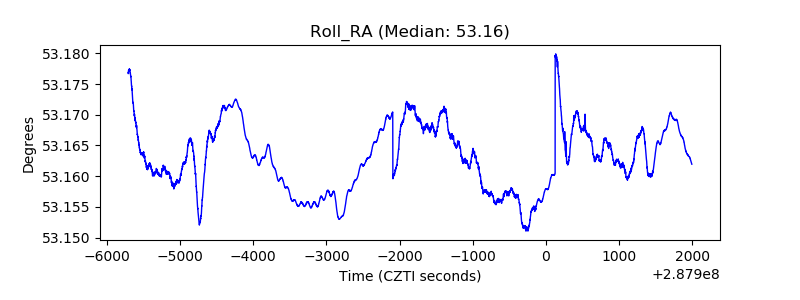 |
| Veto Counter |  |