| Param | Original file | Final file |
|---|---|---|
| Filename | modeM0/AS1A06_006T01_9000002720_18296cztM0_level2.evt | modeM0/AS1A06_006T01_9000002720_18296cztM0_level2_quad_clean.evt |
| Size (bytes) | 516,792,960 | 73,272,960 |
| Size | 492.9 MB | 69.9 MB |
| Events in quadrant A | 3,349,640 | 454,828 |
| Events in quadrant B | 3,392,709 | 459,782 |
| Events in quadrant C | 3,381,288 | 448,882 |
| Events in quadrant D | 5,107,509 | 422,698 |
| Mode SS | |||
|---|---|---|---|
| Quadrant | BADHDUFLAG | Total packets | Discarded packets |
| A | 0 | 124 | 0 |
| B | 0 | 124 | 0 |
| C | 0 | 124 | 0 |
| D | 0 | 124 | 0 |
| Mode M9 | |||
|---|---|---|---|
| Quadrant | BADHDUFLAG | Total packets | Discarded packets |
| A | 0 | 14 | 0 |
| B | 0 | 14 | 0 |
| C | 0 | 14 | 0 |
| D | 0 | 14 | 0 |
| Mode M0 | |||
|---|---|---|---|
| Quadrant | BADHDUFLAG | Total packets | Discarded packets |
| A | 0 | 13534 | 1 |
| B | 0 | 13688 | 1 |
| C | 0 | 13754 | 1 |
| D | 0 | 19173 | 1 |
| Quadrant | Total seconds | Saturated seconds | Saturation percentage |
|---|---|---|---|
| A | 6199 | 82 | 1.322794% |
| B | 6200 | 83 | 1.338710% |
| C | 6200 | 142 | 2.290323% |
| D | 6200 | 568 | 9.161290% |
Noise dominated data is calculated using 1-second bins in cleaned event files. If a bin has >2000 counts, and if more than 50% of those come from <1% of pixels, then it is considered to be noise-dominated and hence unusable.
| Quadrant | # 1 sec bins | Bins with >0 counts | Bins with >2000 counts | High rate bins dominated by noise | Noise dominated (total time) | Noise dominated (detector-on time) | Marked lightcurve |
|---|---|---|---|---|---|---|---|
| A | 7549 | 6200 | 6 | 6 | 0.08% | 0.10% | 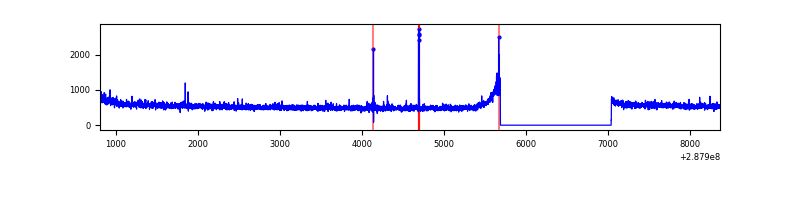 |
| B | 7550 | 6201 | 0 | 0 | 0.00% | 0.00% | 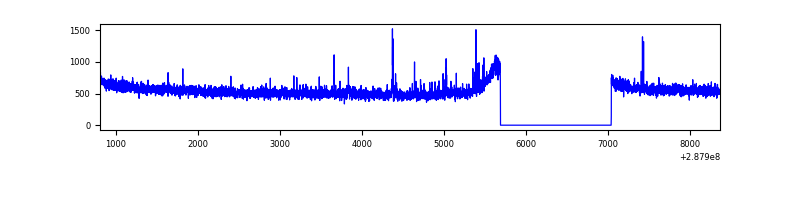 |
| C | 7550 | 6201 | 3 | 3 | 0.04% | 0.05% | 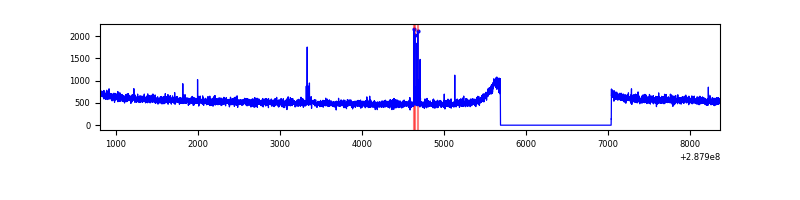 |
| D | 7550 | 6201 | 429 | 429 | 5.68% | 6.92% | 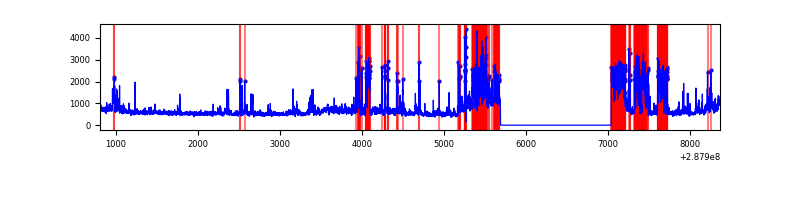 |
Top three noisy pixels from each quadrant. If the there are fewer than three noisy pixels in the level2.evt file, extra rows are filled as -1
| Pixel properties | Quadrant properties | ||||||
|---|---|---|---|---|---|---|---|
| Quadrant | DetID | PixID | Counts | Sigma | Mean | Median | Sigma |
| A | 15 | 174 | 34687 | 198.71 | 856 | 841 | 170.3 |
| A | 9 | 143 | 25242 | 143.26 | 856 | 841 | 170.3 |
| A | 0 | 226 | 7622 | 39.81 | 856 | 841 | 170.3 |
| B | 0 | 244 | 21716 | 129.98 | 857 | 837 | 160.6 |
| B | 12 | 111 | 17432 | 103.31 | 857 | 837 | 160.6 |
| B | 11 | 111 | 14949 | 87.85 | 857 | 837 | 160.6 |
| C | 14 | 238 | 129325 | 677.39 | 826 | 834 | 189.7 |
| C | 0 | 207 | 29413 | 150.67 | 826 | 834 | 189.7 |
| C | 13 | 61 | 5930 | 26.87 | 826 | 834 | 189.7 |
| D | 7 | 238 | 870496 | 4447.01 | 811 | 789 | 195.6 |
| D | 1 | 52 | 824597 | 4212.32 | 811 | 789 | 195.6 |
| D | 13 | 168 | 203550 | 1036.76 | 811 | 789 | 195.6 |
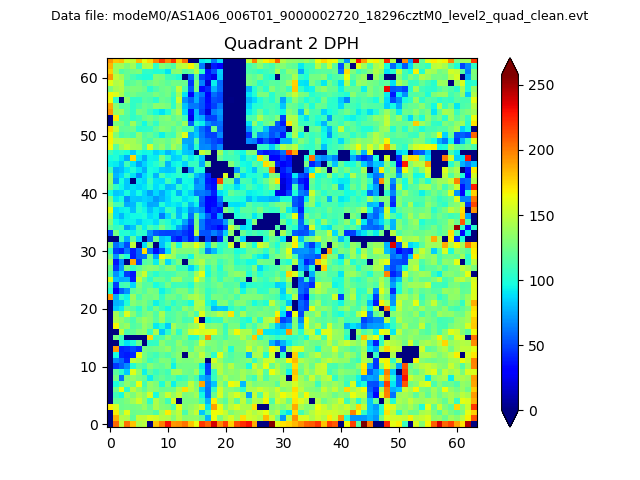
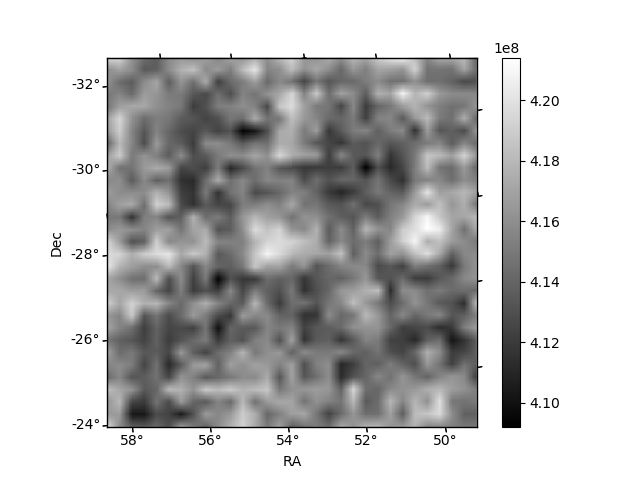
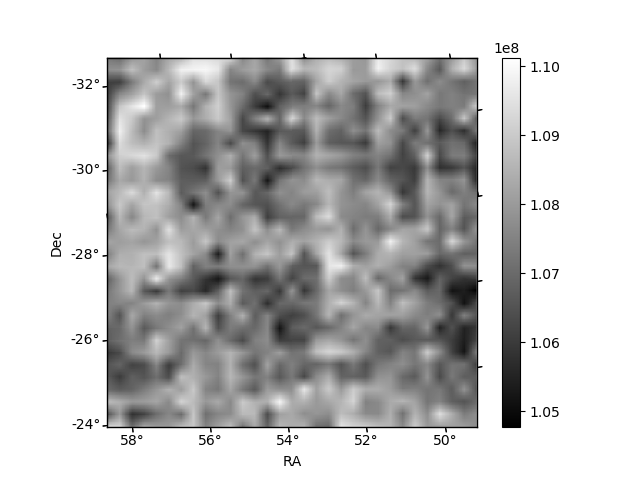
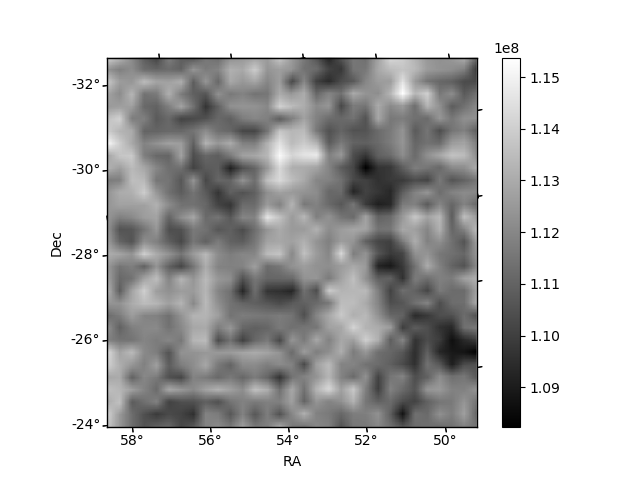
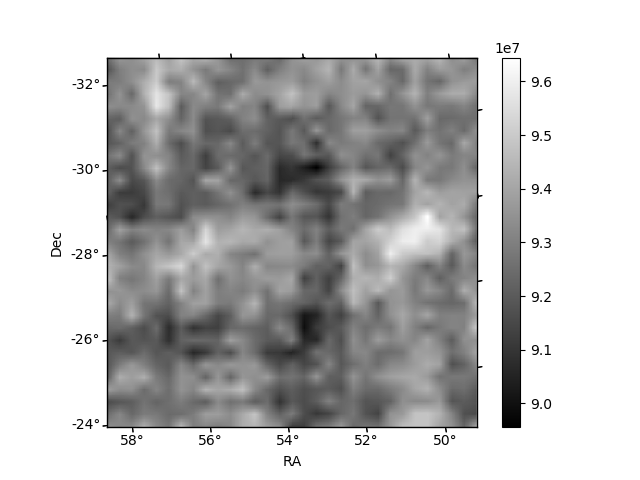
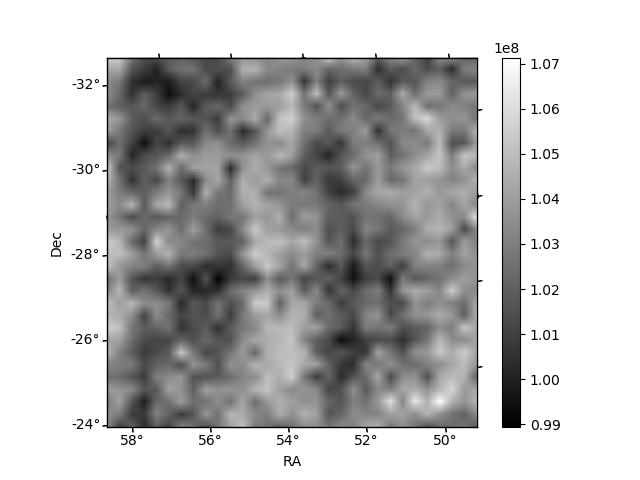
Histogram calculated using DETX and DETY for each event in the final _common_clean file
| Quadrant A | 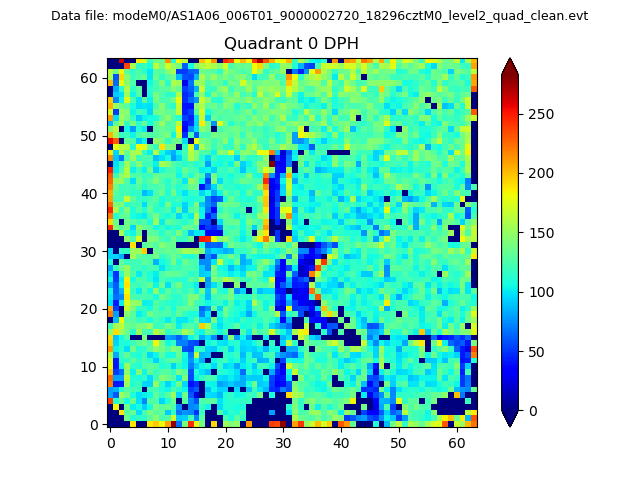 |
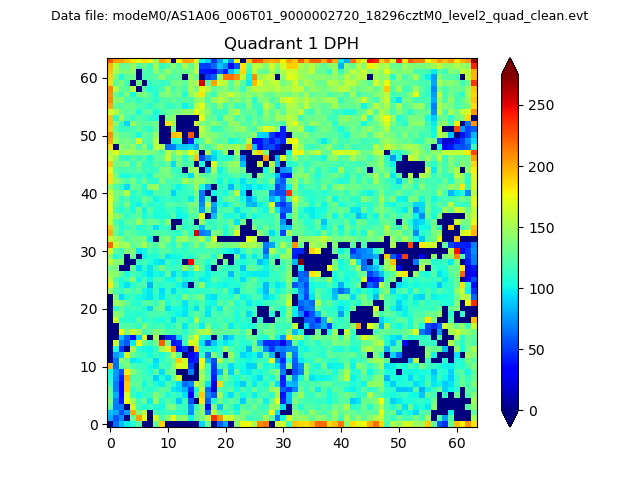 |
Quadrant B |
|---|---|---|---|
| Quadrant D | 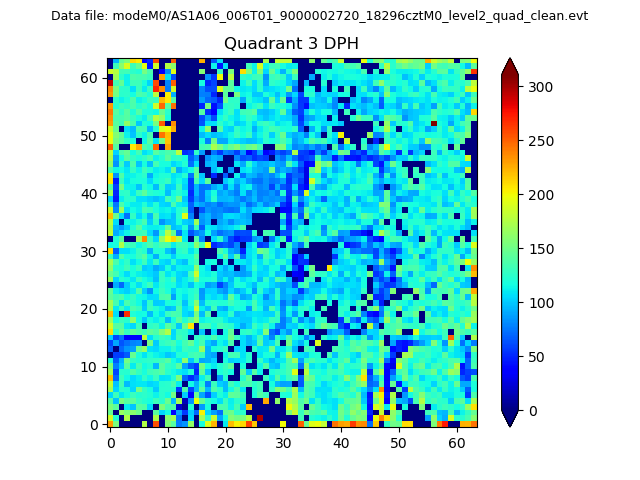 |
 |
Quadrant C |
| Plot type | Count rate plots | Images |
|---|---|---|
| Comparison with Poisson distribution Blue bars denote a histogram of data divided into 1 sec bins. Red curve is a Poisson curve with rate = median count rate of data. |
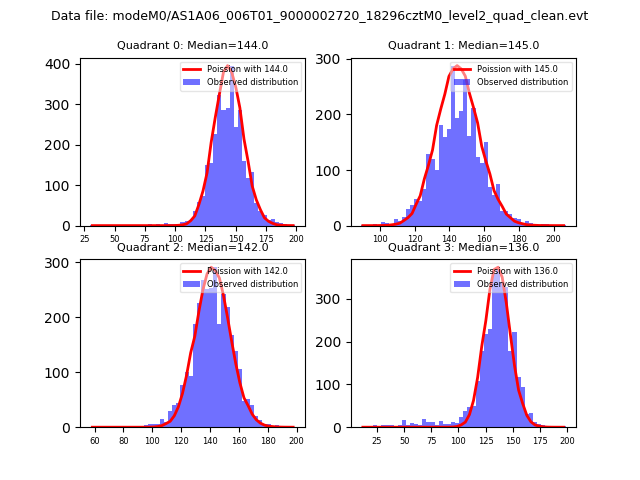 |
 |
| Quadrant-wise count rates Data is divided into 100 sec bins |
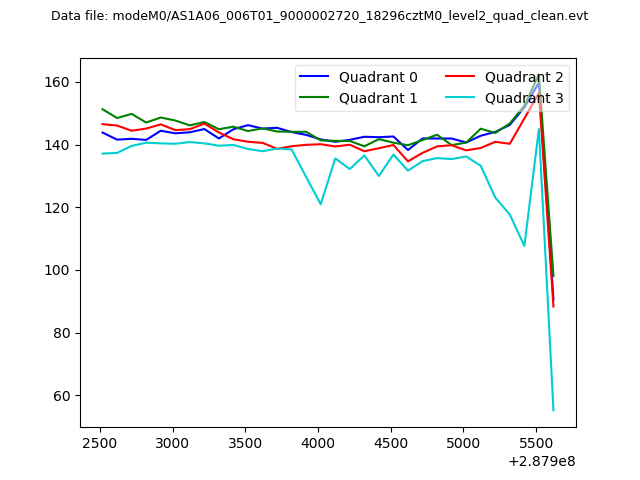 |
|
| Module-wise count rates for Quadrant A Data is divided into 100 sec bins |
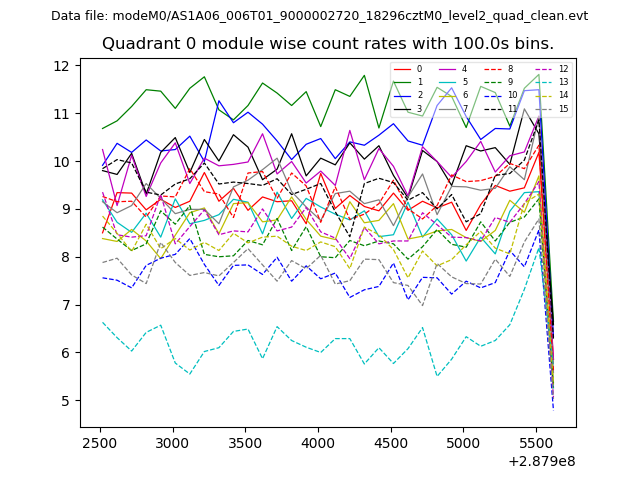 |
 |
| Module-wise count rates for Quadrant B Data is divided into 100 sec bins |
 |
 |
| Module-wise count rates for Quadrant C Data is divided into 100 sec bins |
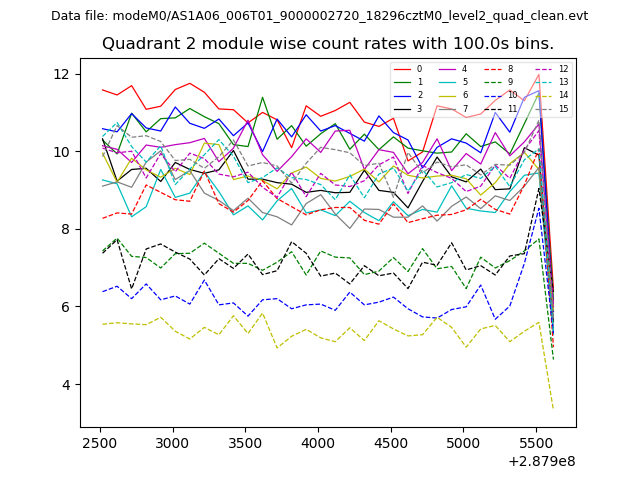 |
 |
| Module-wise count rates for Quadrant D Data is divided into 100 sec bins |
 |
 |
| Parameter | Plot |
|---|---|
| CZT HV Monitor |  |
| D_VDD | 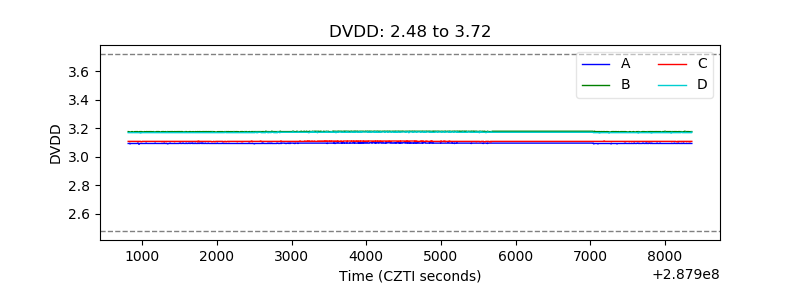 |
| Temperature 1 | 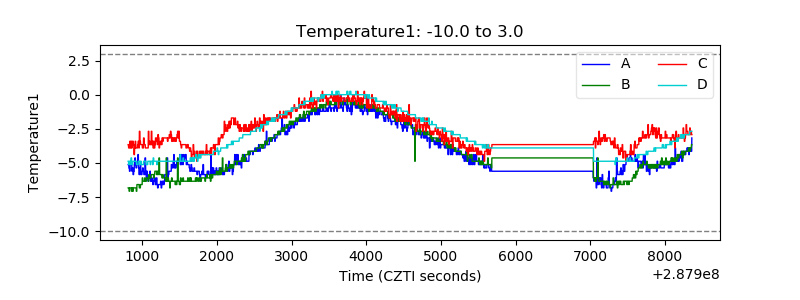 |
| Veto HV Monitor | 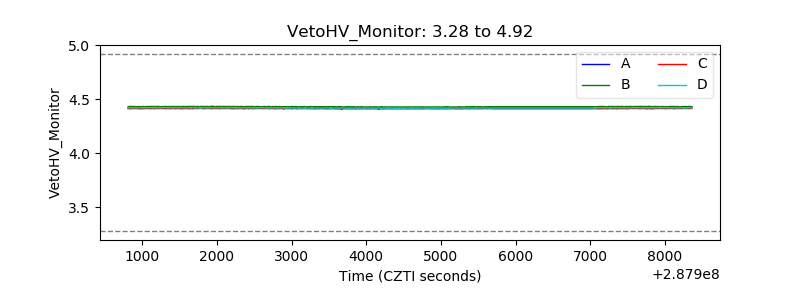 |
| Veto LLD | 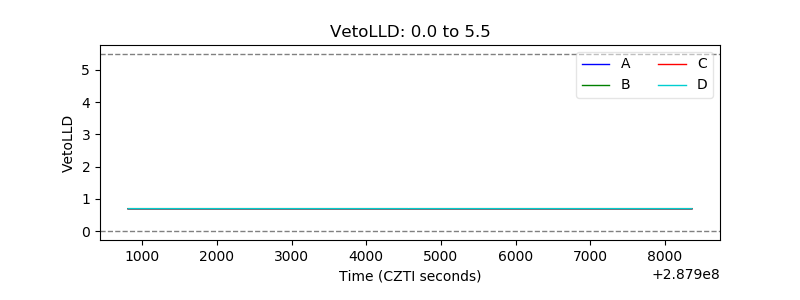 |
| Alpha Counter | 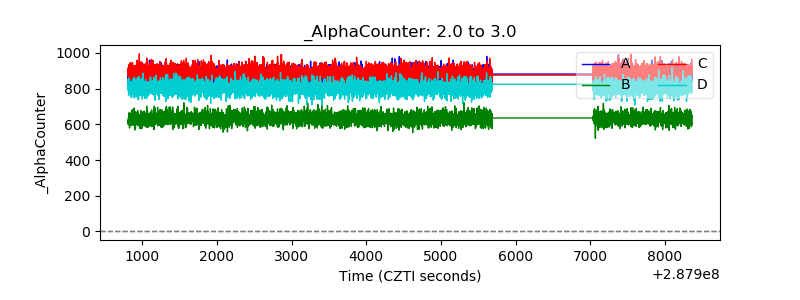 |
| _CPM_Rate | 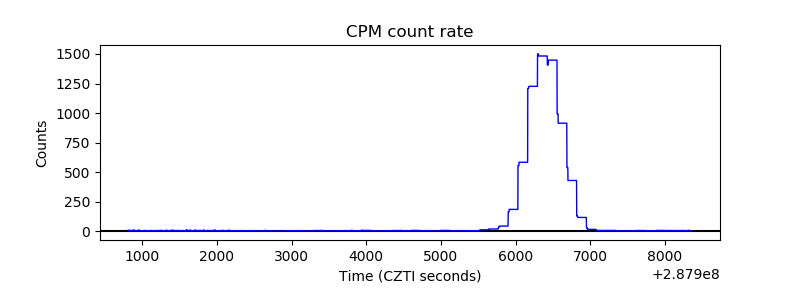 |
| CZT Counter |  |
| +2.5 Volts monitor |  |
| +5 Volts monitor |  |
| _ROLL_ROT |  |
| _Roll_DEC | 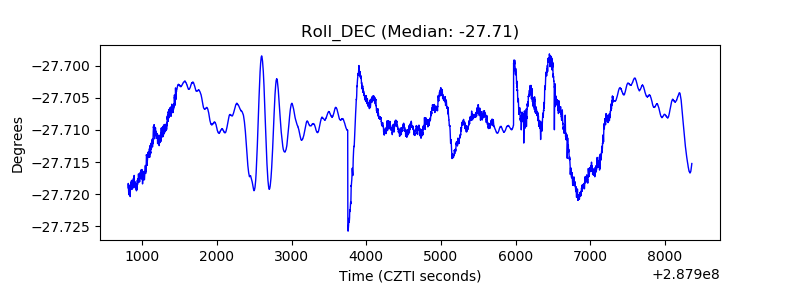 |
| _Roll_RA | 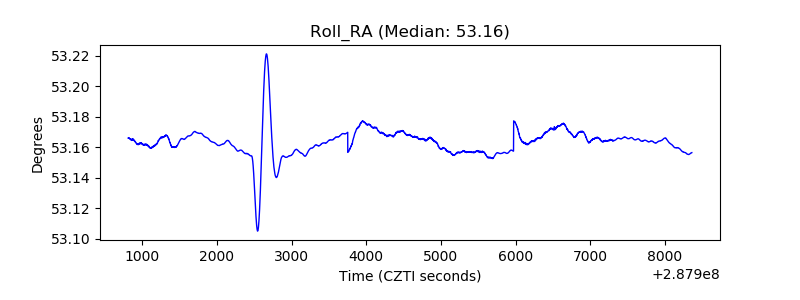 |
| Veto Counter | 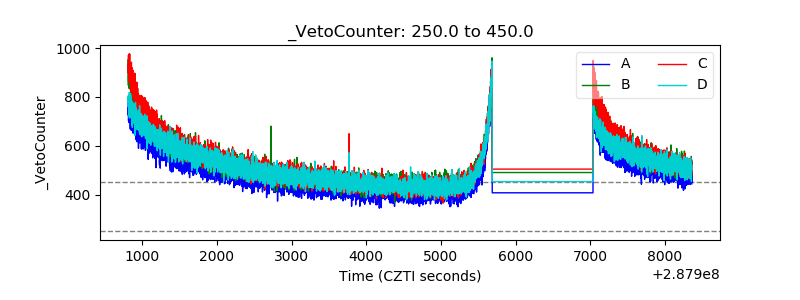 |