| Param | Original file | Final file |
|---|---|---|
| Filename | modeM0/AS1A06_006T01_9000002720_18299cztM0_level2.evt | modeM0/AS1A06_006T01_9000002720_18299cztM0_level2_quad_clean.evt |
| Size (bytes) | 571,106,880 | 96,203,520 |
| Size | 544.6 MB | 91.7 MB |
| Events in quadrant A | 3,685,672 | 627,740 |
| Events in quadrant B | 3,276,234 | 632,439 |
| Events in quadrant C | 3,215,417 | 617,425 |
| Events in quadrant D | 6,667,266 | 571,460 |
| Mode SS | |||
|---|---|---|---|
| Quadrant | BADHDUFLAG | Total packets | Discarded packets |
| A | 0 | 136 | 0 |
| B | 0 | 136 | 0 |
| C | 0 | 136 | 0 |
| D | 0 | 136 | 0 |
| Mode M9 | |||
|---|---|---|---|
| Quadrant | BADHDUFLAG | Total packets | Discarded packets |
| A | 0 | 6 | 0 |
| B | 0 | 6 | 0 |
| C | 0 | 6 | 0 |
| D | 0 | 6 | 0 |
| Mode M0 | |||
|---|---|---|---|
| Quadrant | BADHDUFLAG | Total packets | Discarded packets |
| A | 0 | 15145 | 1 |
| B | 0 | 13874 | 1 |
| C | 0 | 13801 | 1 |
| D | 0 | 24408 | 2 |
| Quadrant | Total seconds | Saturated seconds | Saturation percentage |
|---|---|---|---|
| A | 6663 | 182 | 2.731502% |
| B | 6664 | 139 | 2.085834% |
| C | 6664 | 152 | 2.280912% |
| D | 6663 | 754 | 11.316224% |
Noise dominated data is calculated using 1-second bins in cleaned event files. If a bin has >2000 counts, and if more than 50% of those come from <1% of pixels, then it is considered to be noise-dominated and hence unusable.
| Quadrant | # 1 sec bins | Bins with >0 counts | Bins with >2000 counts | High rate bins dominated by noise | Noise dominated (total time) | Noise dominated (detector-on time) | Marked lightcurve |
|---|---|---|---|---|---|---|---|
| A | 7148 | 6665 | 41 | 41 | 0.57% | 0.62% | 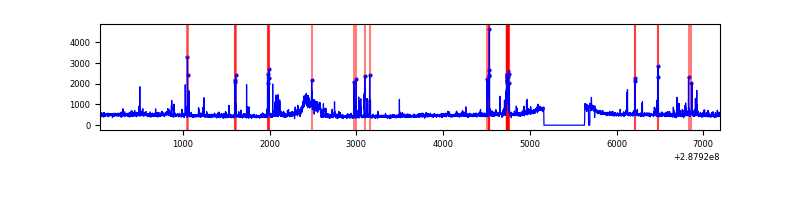 |
| B | 7149 | 6666 | 1 | 1 | 0.01% | 0.02% | 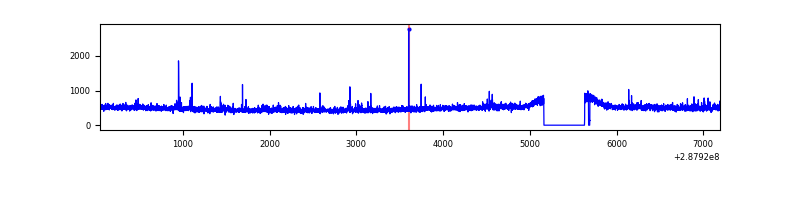 |
| C | 7149 | 6666 | 1 | 1 | 0.01% | 0.02% | 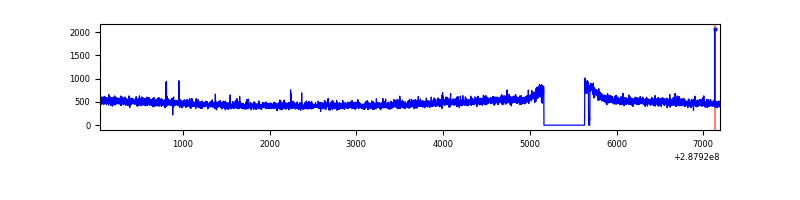 |
| D | 7148 | 6665 | 659 | 659 | 9.22% | 9.89% | 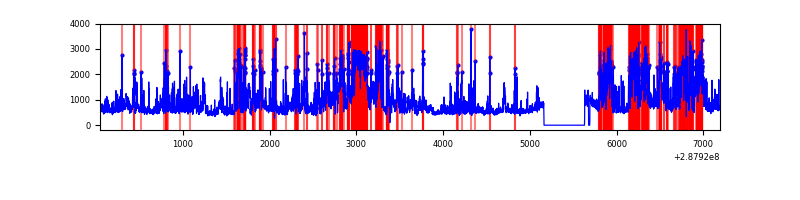 |
Top three noisy pixels from each quadrant. If the there are fewer than three noisy pixels in the level2.evt file, extra rows are filled as -1
| Pixel properties | Quadrant properties | ||||||
|---|---|---|---|---|---|---|---|
| Quadrant | DetID | PixID | Counts | Sigma | Mean | Median | Sigma |
| A | 15 | 174 | 214917 | 1283.77 | 824 | 806 | 166.8 |
| A | 4 | 2 | 204236 | 1219.73 | 824 | 806 | 166.8 |
| A | 9 | 143 | 96868 | 575.97 | 824 | 806 | 166.8 |
| B | 7 | 220 | 19536 | 118.56 | 821 | 801 | 158.0 |
| B | 12 | 111 | 18228 | 110.28 | 821 | 801 | 158.0 |
| B | 11 | 111 | 15559 | 93.39 | 821 | 801 | 158.0 |
| C | 14 | 238 | 121079 | 652.33 | 787 | 791 | 184.4 |
| C | 8 | 128 | 8377 | 41.14 | 787 | 791 | 184.4 |
| C | 3 | 233 | 7685 | 37.39 | 787 | 791 | 184.4 |
| D | 7 | 238 | 1876331 | 9792.56 | 781 | 757 | 191.5 |
| D | 1 | 52 | 778605 | 4061.22 | 781 | 757 | 191.5 |
| D | 13 | 168 | 520458 | 2713.41 | 781 | 757 | 191.5 |
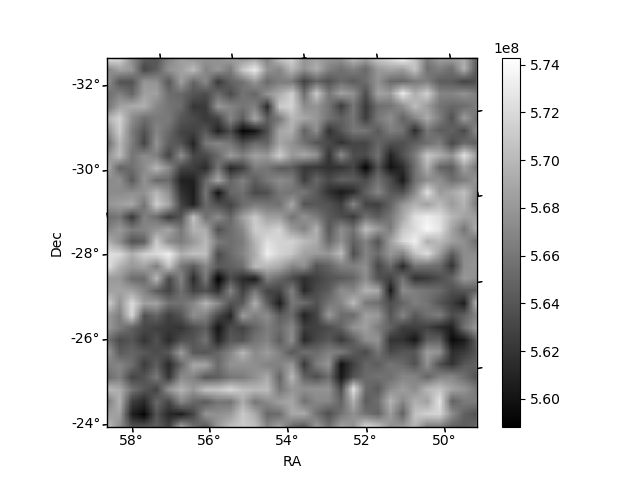
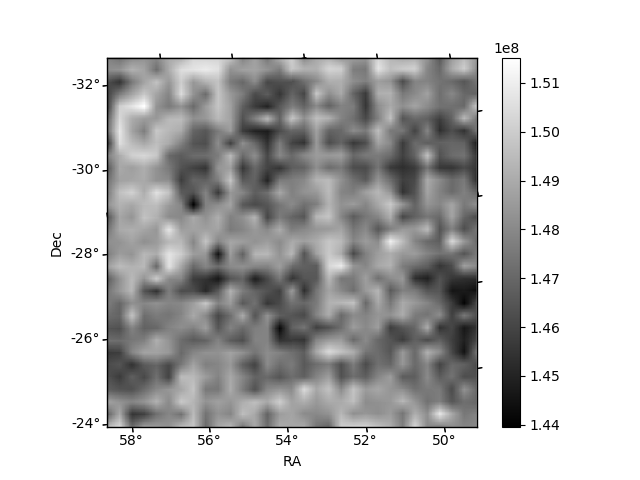
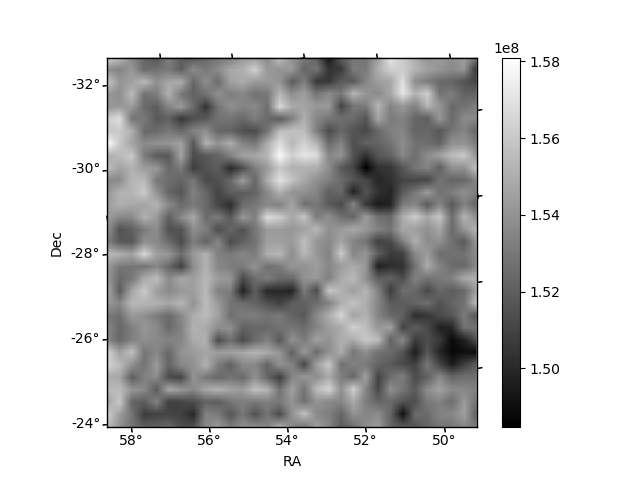
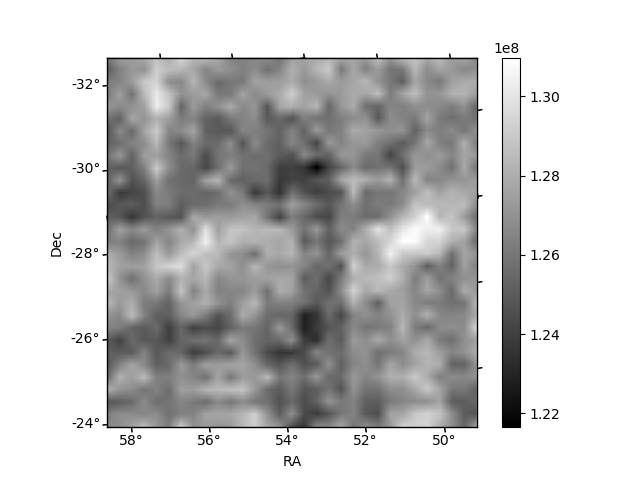
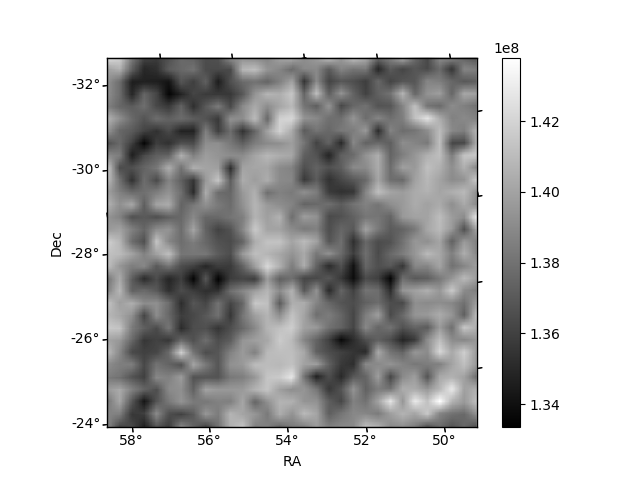
Histogram calculated using DETX and DETY for each event in the final _common_clean file
| Quadrant A | 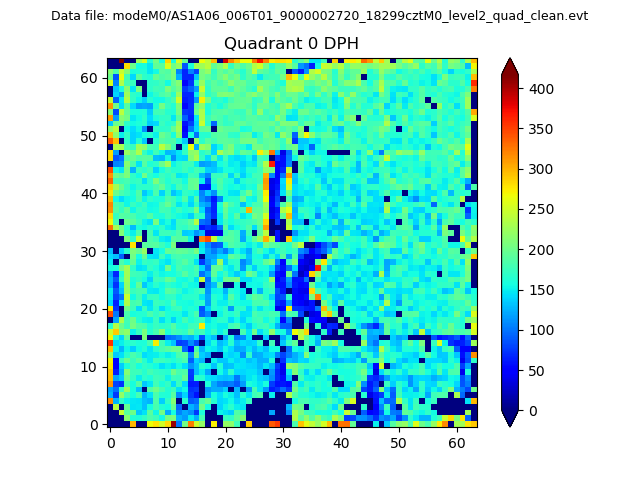 |
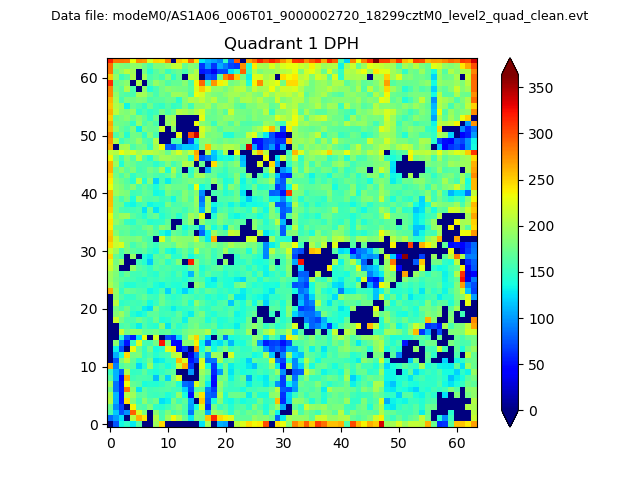 |
Quadrant B |
|---|---|---|---|
| Quadrant D |  |
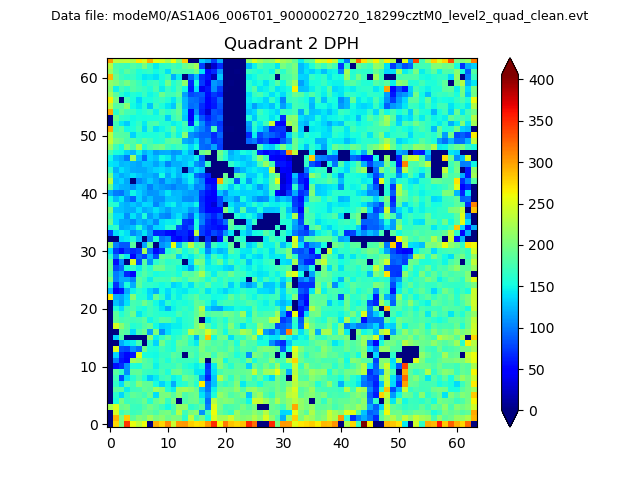 |
Quadrant C |
| Plot type | Count rate plots | Images |
|---|---|---|
| Comparison with Poisson distribution Blue bars denote a histogram of data divided into 1 sec bins. Red curve is a Poisson curve with rate = median count rate of data. |
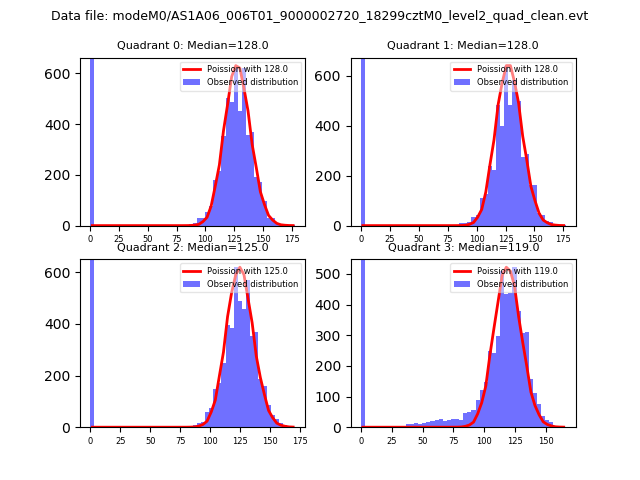 |
 |
| Quadrant-wise count rates Data is divided into 100 sec bins |
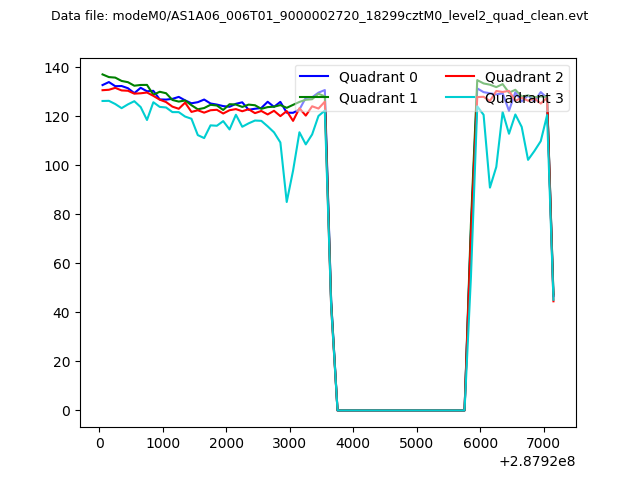 |
|
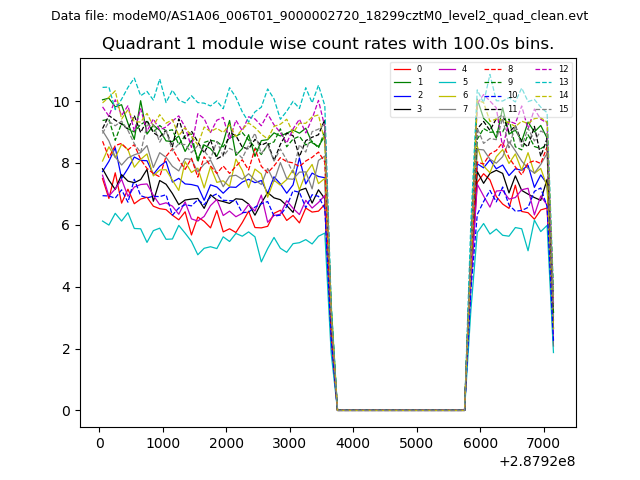
| Module-wise count rates for Quadrant A Data is divided into 100 sec bins |
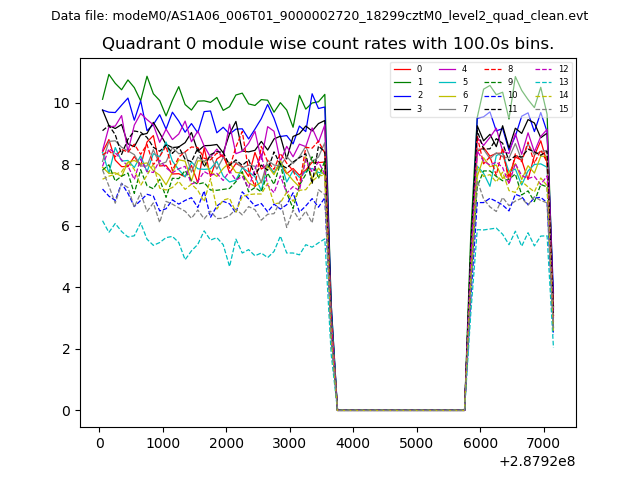 |
 |
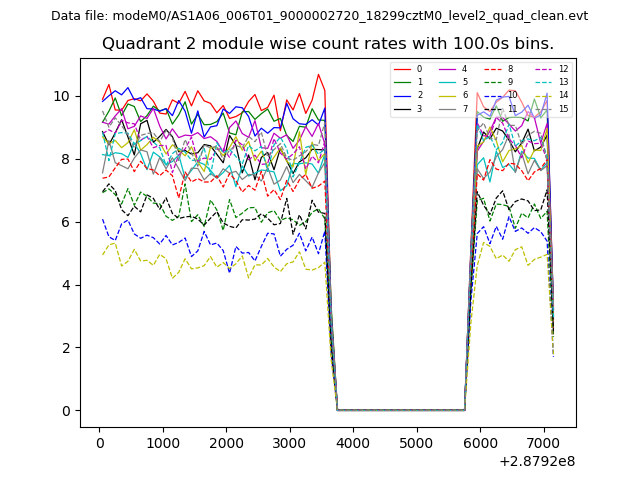
| Module-wise count rates for Quadrant B Data is divided into 100 sec bins |
 |
 |
| Module-wise count rates for Quadrant C Data is divided into 100 sec bins |
 |
 |
| Module-wise count rates for Quadrant D Data is divided into 100 sec bins |
 |
 |
| Parameter | Plot |
|---|---|
| CZT HV Monitor | 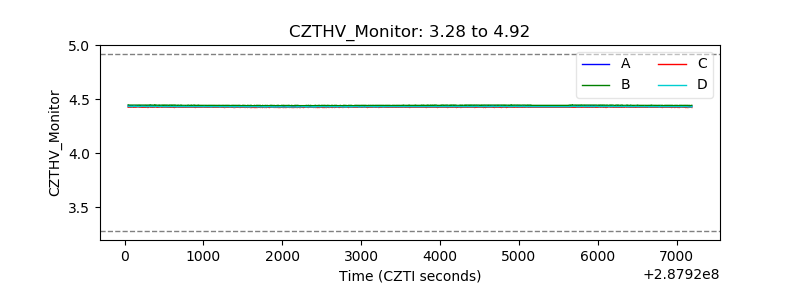 |
| D_VDD | 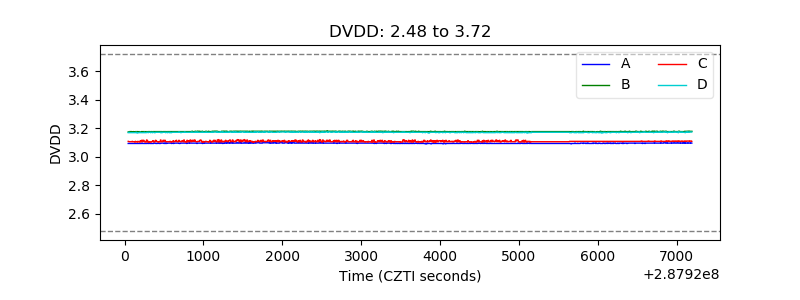 |
| Temperature 1 | 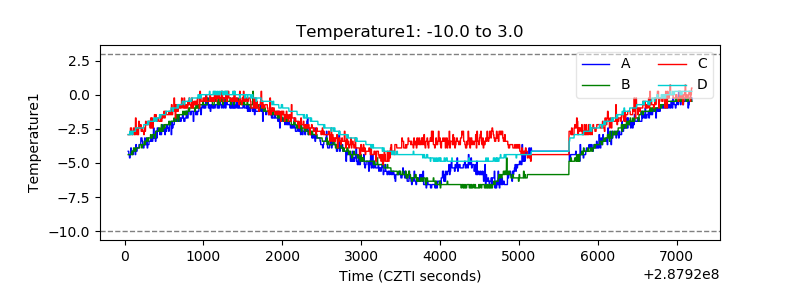 |
| Veto HV Monitor | 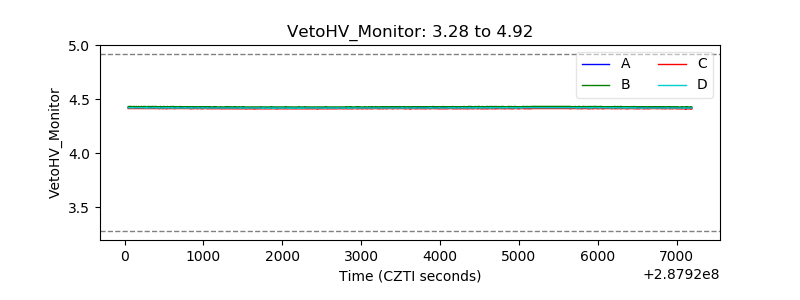 |
| Veto LLD |  |
| Alpha Counter | 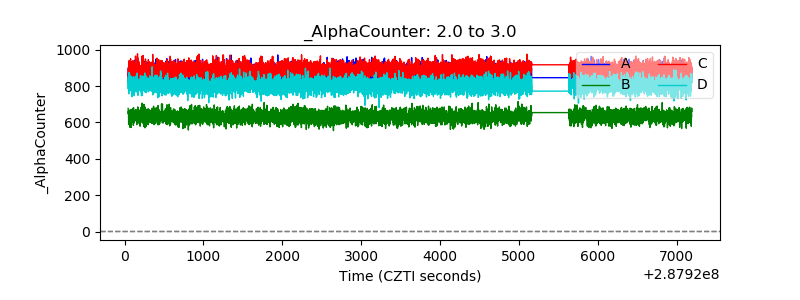 |
| _CPM_Rate | 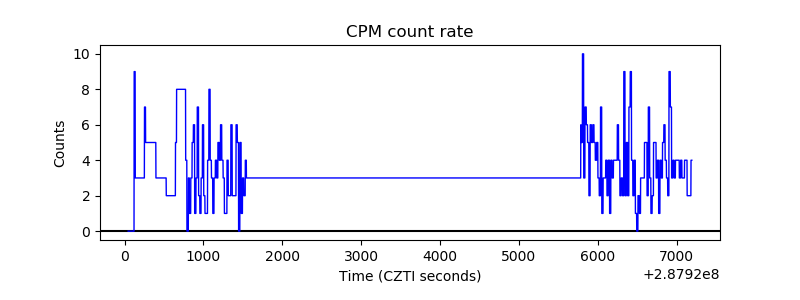 |
| CZT Counter | 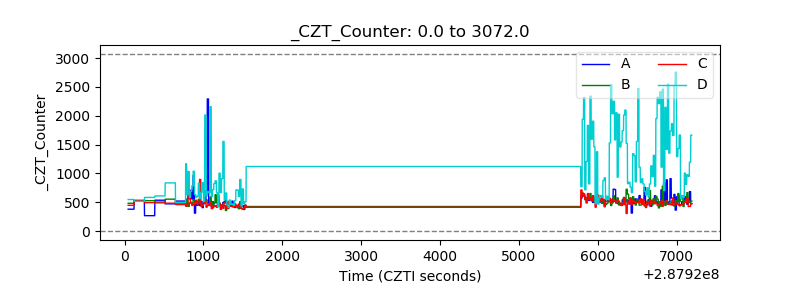 |
| +2.5 Volts monitor |  |
| +5 Volts monitor |  |
| _ROLL_ROT |  |
| _Roll_DEC | 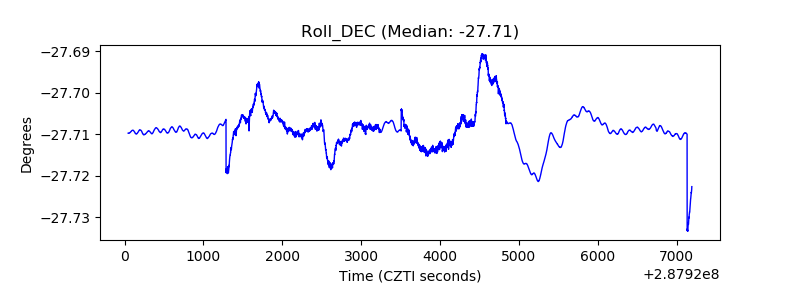 |
| _Roll_RA | 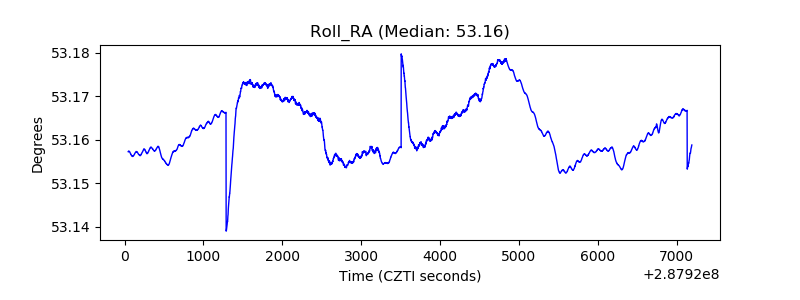 |
| Veto Counter | 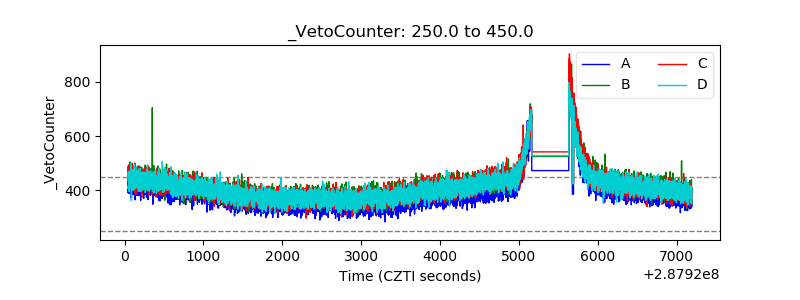 |