| Param | Original file | Final file |
|---|---|---|
| Filename | modeM0/AS1A06_006T01_9000002720_18305cztM0_level2.evt | modeM0/AS1A06_006T01_9000002720_18305cztM0_level2_quad_clean.evt |
| Size (bytes) | 494,775,360 | 87,537,600 |
| Size | 471.9 MB | 83.5 MB |
| Events in quadrant A | 3,083,343 | 557,670 |
| Events in quadrant B | 3,271,984 | 560,671 |
| Events in quadrant C | 3,113,600 | 545,961 |
| Events in quadrant D | 5,063,576 | 522,535 |
| Mode SS | |||
|---|---|---|---|
| Quadrant | BADHDUFLAG | Total packets | Discarded packets |
| A | 0 | 136 | 0 |
| B | 0 | 136 | 0 |
| C | 0 | 136 | 0 |
| D | 0 | 136 | 0 |
| Mode M9 | |||
|---|---|---|---|
| Quadrant | BADHDUFLAG | Total packets | Discarded packets |
| A | 0 | 11 | 0 |
| B | 0 | 12 | 0 |
| C | 0 | 12 | 0 |
| D | 0 | 12 | 0 |
| Mode M0 | |||
|---|---|---|---|
| Quadrant | BADHDUFLAG | Total packets | Discarded packets |
| A | 0 | 13523 | 2 |
| B | 0 | 13965 | 2 |
| C | 0 | 13522 | 2 |
| D | 0 | 19527 | 2 |
| Quadrant | Total seconds | Saturated seconds | Saturation percentage |
|---|---|---|---|
| A | 6652 | 21 | 0.315695% |
| B | 6652 | 43 | 0.646422% |
| C | 6652 | 40 | 0.601323% |
| D | 6652 | 318 | 4.780517% |
Noise dominated data is calculated using 1-second bins in cleaned event files. If a bin has >2000 counts, and if more than 50% of those come from <1% of pixels, then it is considered to be noise-dominated and hence unusable.
| Quadrant | # 1 sec bins | Bins with >0 counts | Bins with >2000 counts | High rate bins dominated by noise | Noise dominated (total time) | Noise dominated (detector-on time) | Marked lightcurve |
|---|---|---|---|---|---|---|---|
| A | 7622 | 6652 | 3 | 3 | 0.04% | 0.05% | 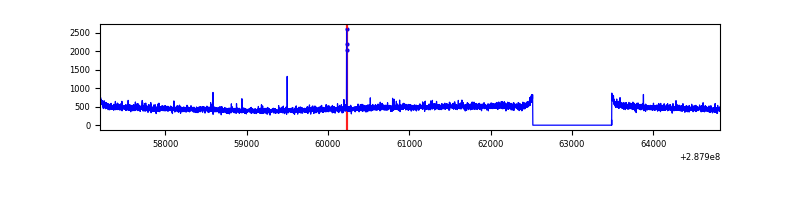 |
| B | 7622 | 6652 | 12 | 12 | 0.16% | 0.18% | 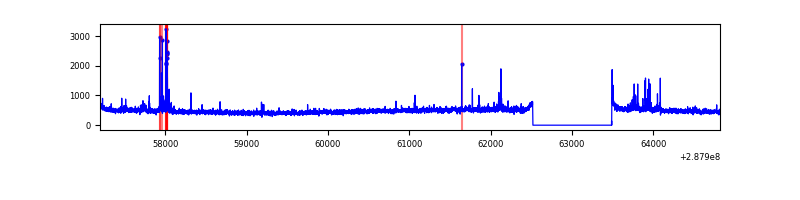 |
| C | 7622 | 6653 | 0 | 0 | 0.00% | 0.00% | 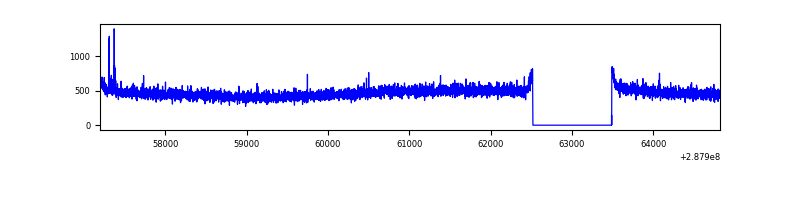 |
| D | 7622 | 6653 | 205 | 205 | 2.69% | 3.08% | 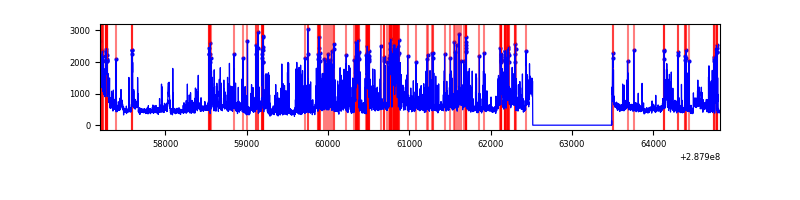 |
Top three noisy pixels from each quadrant. If the there are fewer than three noisy pixels in the level2.evt file, extra rows are filled as -1
| Pixel properties | Quadrant properties | ||||||
|---|---|---|---|---|---|---|---|
| Quadrant | DetID | PixID | Counts | Sigma | Mean | Median | Sigma |
| A | 4 | 2 | 14270 | 83.3 | 797 | 780 | 161.9 |
| A | 0 | 226 | 6934 | 38.0 | 797 | 780 | 161.9 |
| A | 3 | 137 | 5973 | 32.07 | 797 | 780 | 161.9 |
| B | 7 | 220 | 59115 | 380.22 | 801 | 779 | 153.4 |
| B | 0 | 197 | 32797 | 208.69 | 801 | 779 | 153.4 |
| B | 12 | 111 | 17986 | 112.15 | 801 | 779 | 153.4 |
| C | 14 | 238 | 117929 | 652.64 | 765 | 772 | 179.5 |
| C | 0 | 207 | 9529 | 48.78 | 765 | 772 | 179.5 |
| C | 13 | 61 | 5474 | 26.19 | 765 | 772 | 179.5 |
| D | 1 | 52 | 1023501 | 5478.53 | 762 | 739 | 186.7 |
| D | 7 | 238 | 707888 | 3787.91 | 762 | 739 | 186.7 |
| D | 13 | 168 | 374876 | 2004.1 | 762 | 739 | 186.7 |
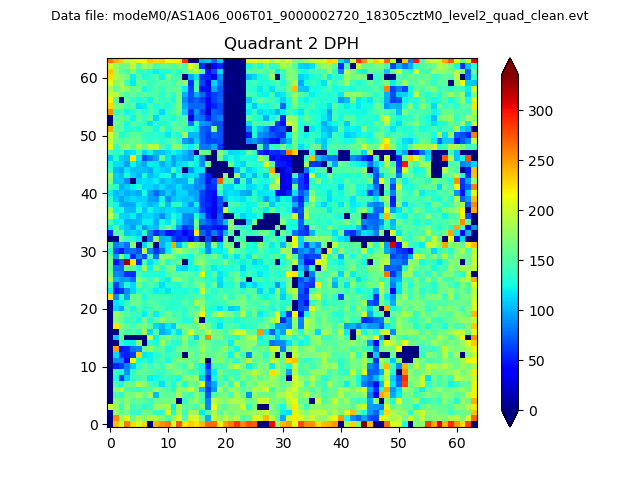
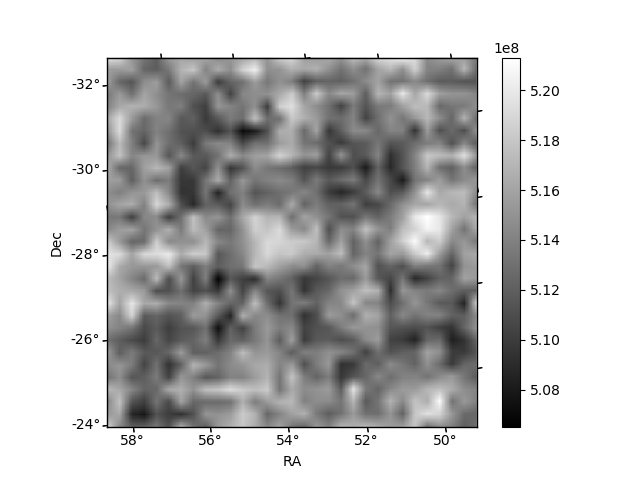
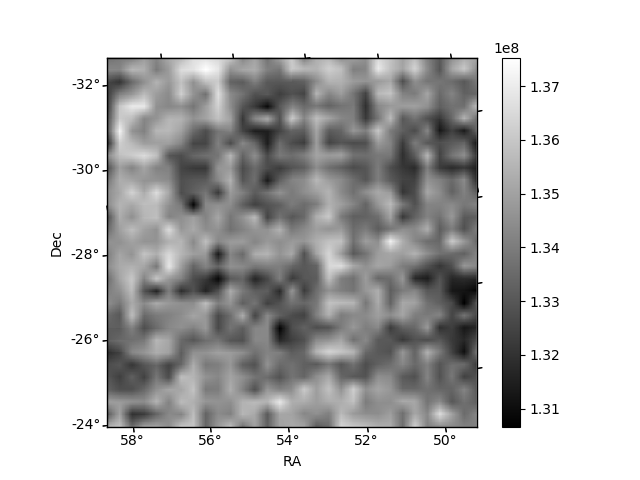
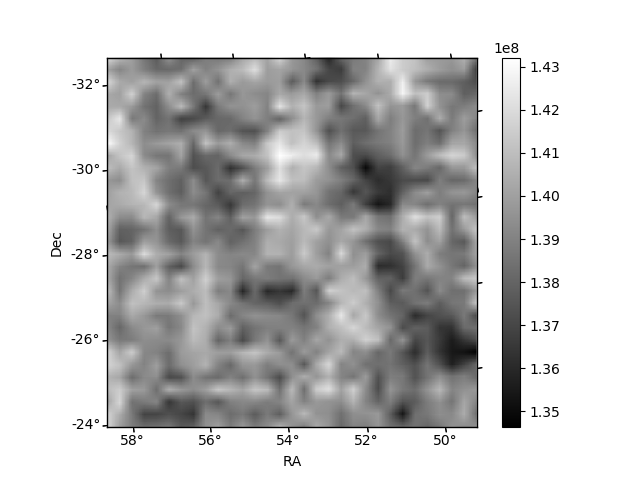
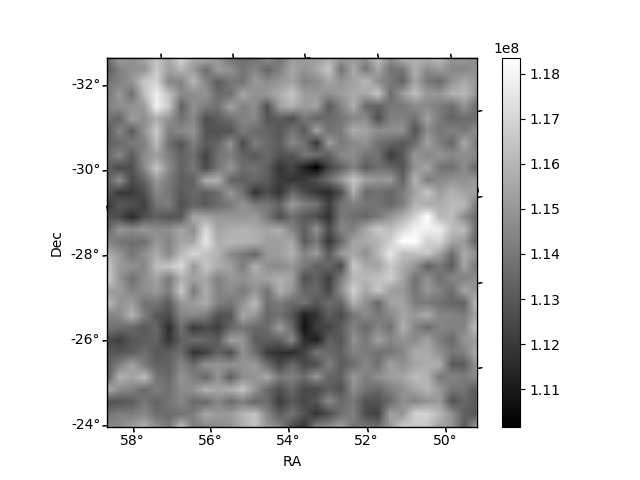
Histogram calculated using DETX and DETY for each event in the final _common_clean file
| Quadrant A | 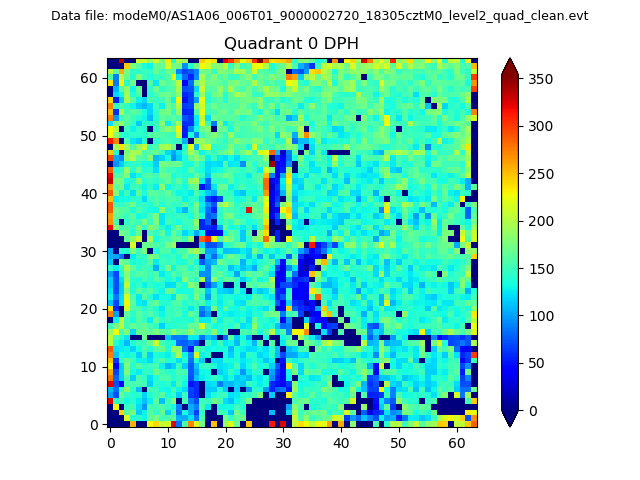 |
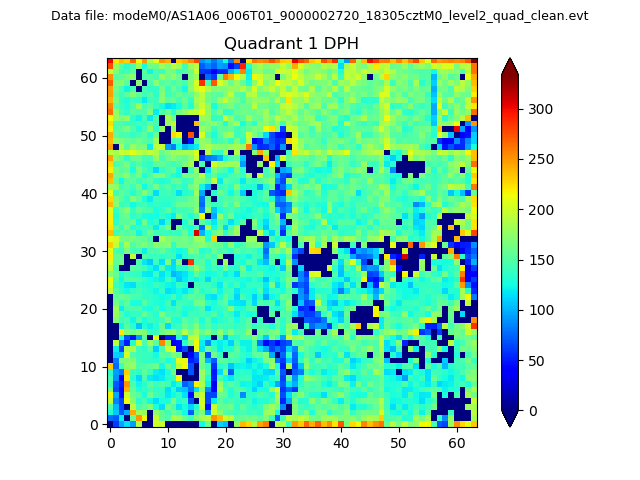 |
Quadrant B |
|---|---|---|---|
| Quadrant D | 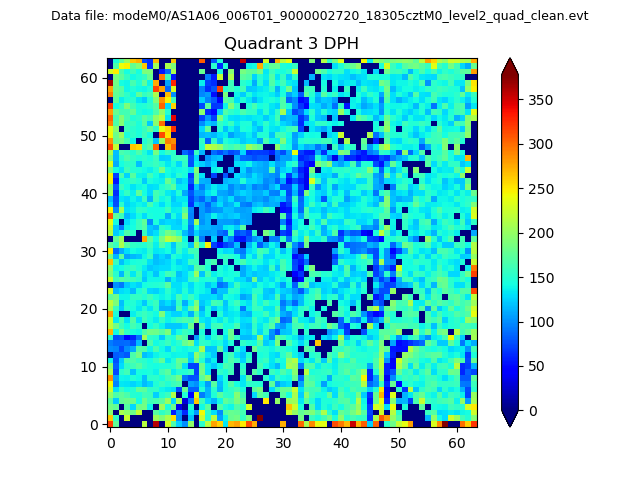 |
 |
Quadrant C |
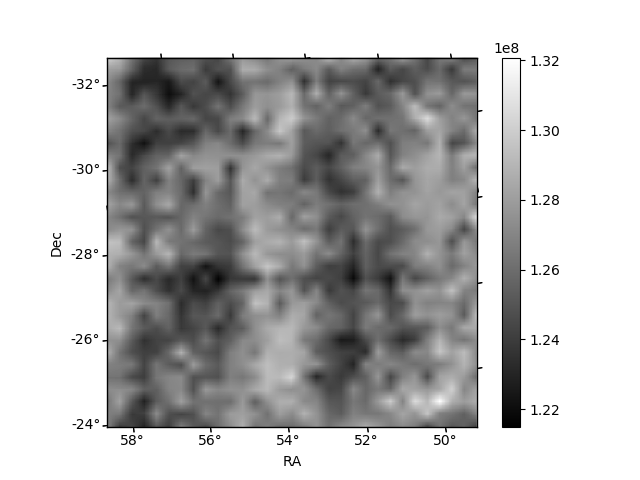
| Plot type | Count rate plots | Images |
|---|---|---|
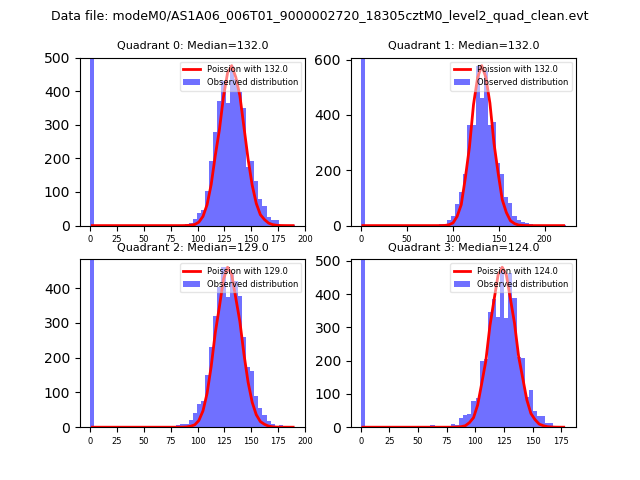
| Comparison with Poisson distribution Blue bars denote a histogram of data divided into 1 sec bins. Red curve is a Poisson curve with rate = median count rate of data. |
 |
 |
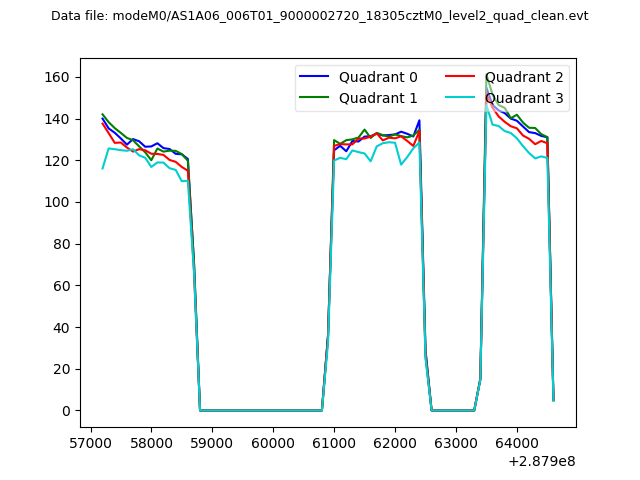
| Quadrant-wise count rates Data is divided into 100 sec bins |
 |
|
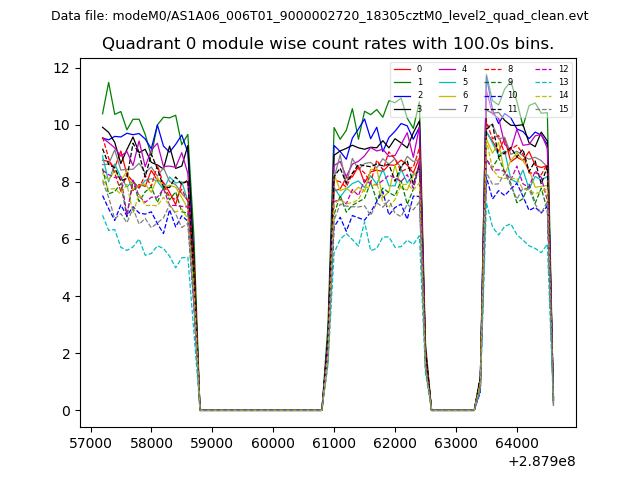
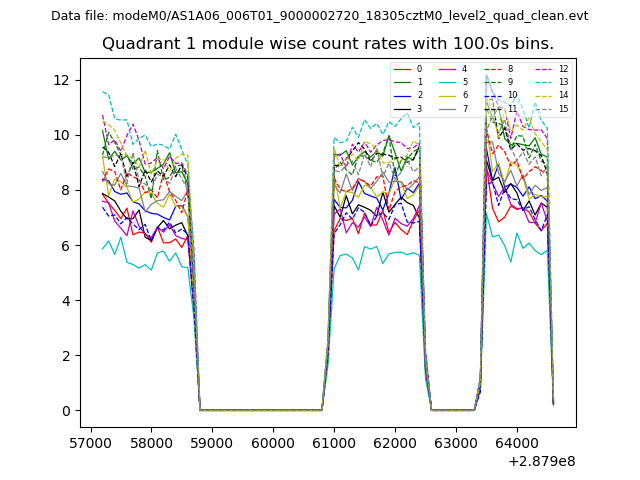
| Module-wise count rates for Quadrant A Data is divided into 100 sec bins |
 |
 |
| Module-wise count rates for Quadrant B Data is divided into 100 sec bins |
 |
 |
| Module-wise count rates for Quadrant C Data is divided into 100 sec bins |
 |
 |
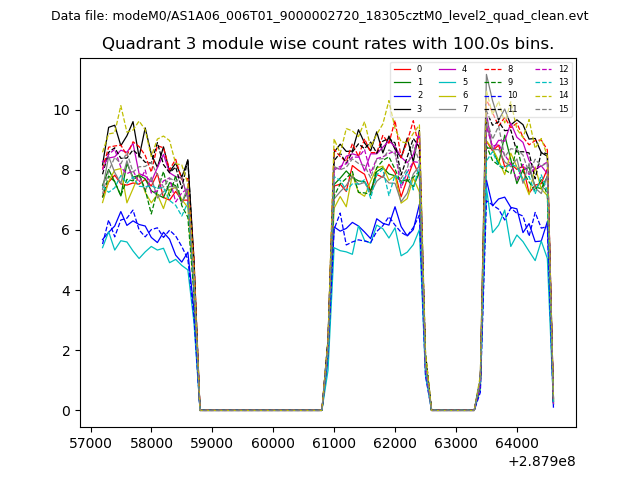
| Module-wise count rates for Quadrant D Data is divided into 100 sec bins |
 |
 |
| Parameter | Plot |
|---|---|
| CZT HV Monitor | 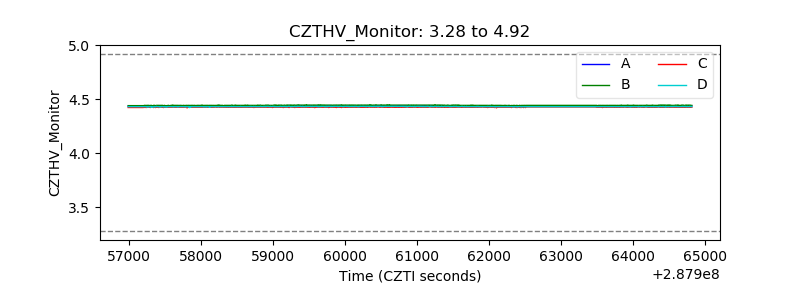 |
| D_VDD | 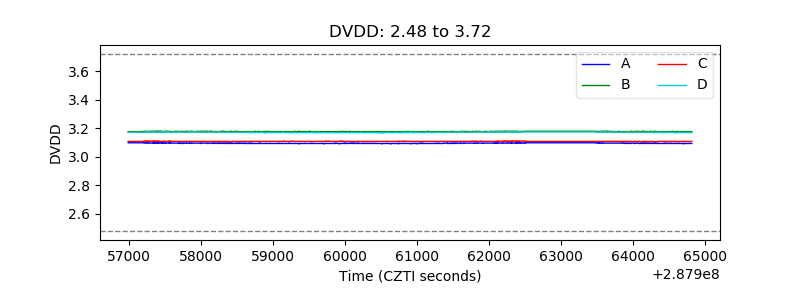 |
| Temperature 1 | 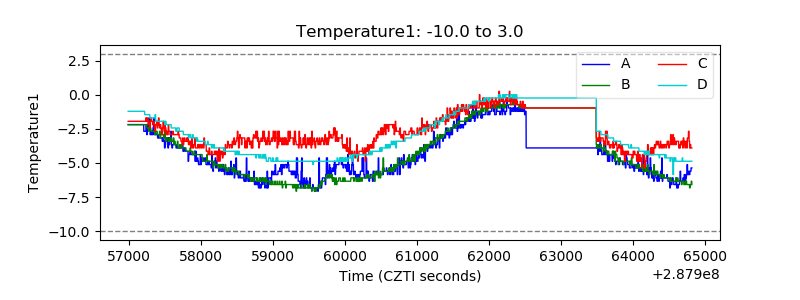 |
| Veto HV Monitor |  |
| Veto LLD | 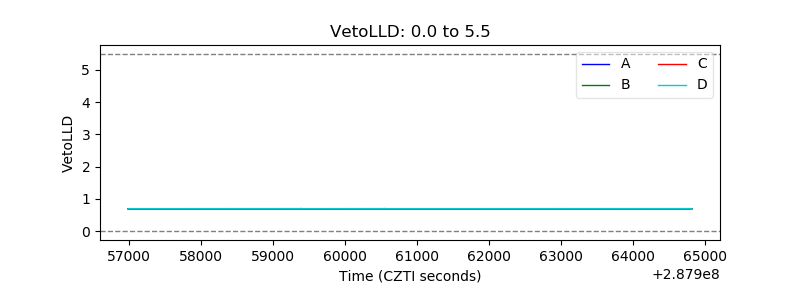 |
| Alpha Counter | 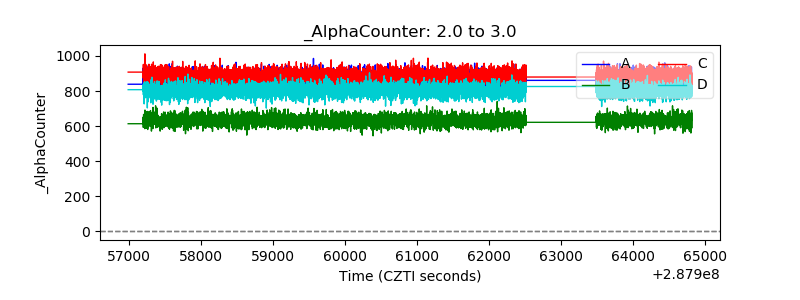 |
| _CPM_Rate | 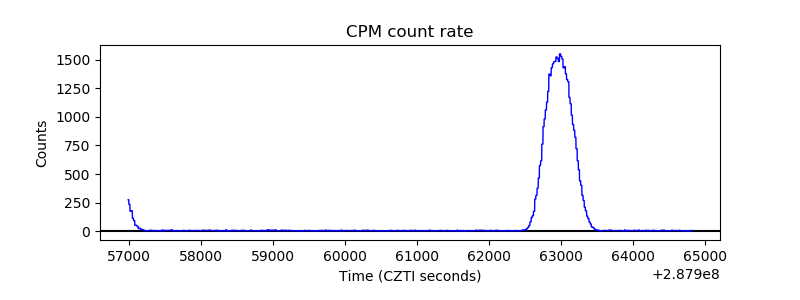 |
| CZT Counter |  |
| +2.5 Volts monitor | 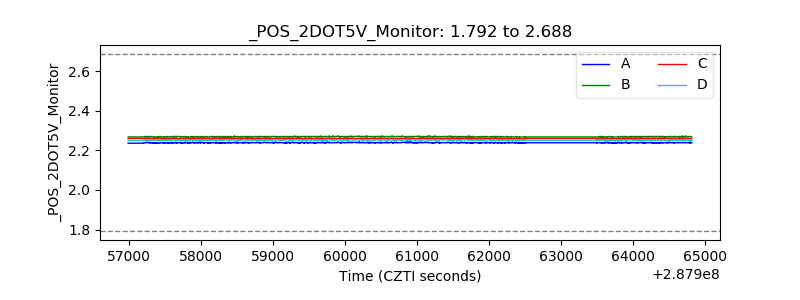 |
| +5 Volts monitor |  |
| _ROLL_ROT | 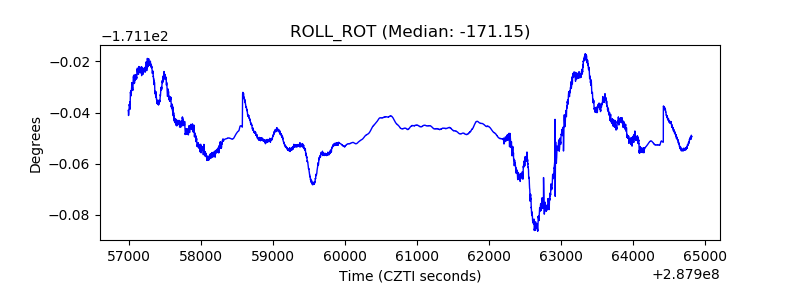 |
| _Roll_DEC | 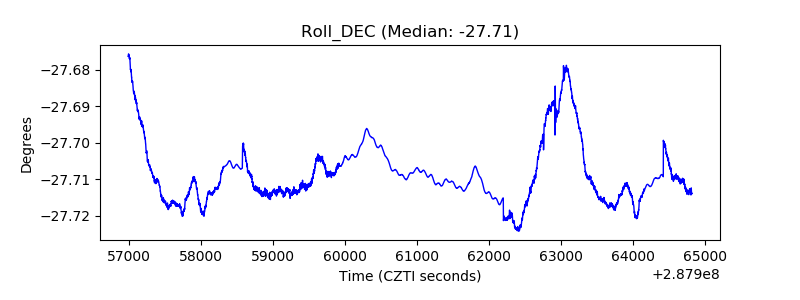 |
| _Roll_RA |  |
| Veto Counter | 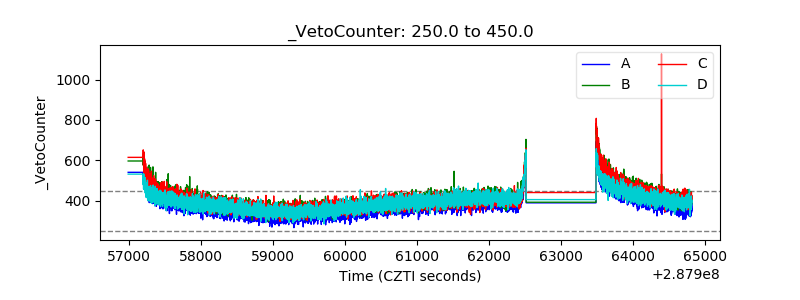 |