| Param | Original file | Final file |
|---|---|---|
| Filename | modeM0/AS1A06_006T01_9000002720_18308cztM0_level2.evt | modeM0/AS1A06_006T01_9000002720_18308cztM0_level2_quad_clean.evt |
| Size (bytes) | 979,868,160 | 134,902,080 |
| Size | 934.5 MB | 128.7 MB |
| Events in quadrant A | 5,639,694 | 840,500 |
| Events in quadrant B | 5,951,572 | 852,234 |
| Events in quadrant C | 5,737,188 | 825,608 |
| Events in quadrant D | 11,556,981 | 757,365 |
| Mode SS | |||
|---|---|---|---|
| Quadrant | BADHDUFLAG | Total packets | Discarded packets |
| A | 0 | 240 | 0 |
| B | 0 | 240 | 0 |
| C | 0 | 240 | 0 |
| D | 0 | 240 | 0 |
| Mode M9 | |||
|---|---|---|---|
| Quadrant | BADHDUFLAG | Total packets | Discarded packets |
| A | 0 | 29 | 0 |
| B | 0 | 30 | 0 |
| C | 0 | 30 | 0 |
| D | 0 | 30 | 0 |
| Mode M0 | |||
|---|---|---|---|
| Quadrant | BADHDUFLAG | Total packets | Discarded packets |
| A | 0 | 24017 | 3 |
| B | 0 | 24858 | 3 |
| C | 0 | 24154 | 3 |
| D | 0 | 42364 | 3 |
| Quadrant | Total seconds | Saturated seconds | Saturation percentage |
|---|---|---|---|
| A | 11694 | 28 | 0.239439% |
| B | 11694 | 59 | 0.504532% |
| C | 11694 | 89 | 0.761074% |
| D | 11694 | 1006 | 8.602702% |
Noise dominated data is calculated using 1-second bins in cleaned event files. If a bin has >2000 counts, and if more than 50% of those come from <1% of pixels, then it is considered to be noise-dominated and hence unusable.
| Quadrant | # 1 sec bins | Bins with >0 counts | Bins with >2000 counts | High rate bins dominated by noise | Noise dominated (total time) | Noise dominated (detector-on time) | Marked lightcurve |
|---|---|---|---|---|---|---|---|
| A | 14040 | 11695 | 0 | 0 | 0.00% | 0.00% | 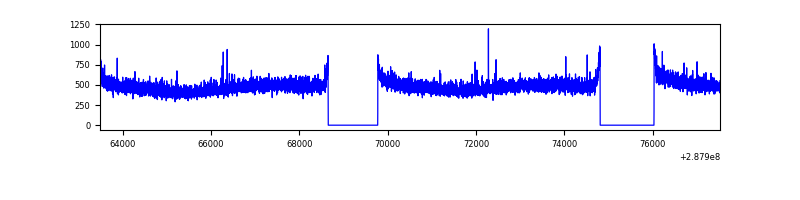 |
| B | 14040 | 11695 | 5 | 5 | 0.04% | 0.04% | 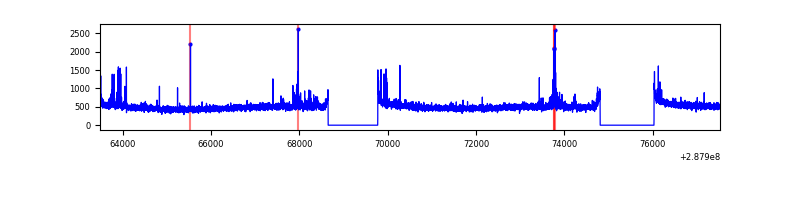 |
| C | 14040 | 11696 | 0 | 0 | 0.00% | 0.00% | 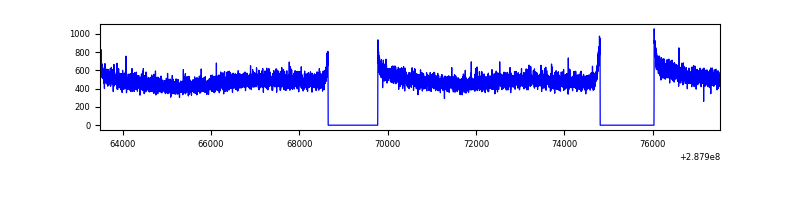 |
| D | 14040 | 11695 | 857 | 857 | 6.10% | 7.33% | 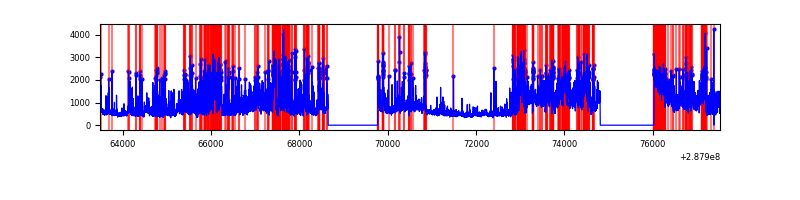 |
Top three noisy pixels from each quadrant. If the there are fewer than three noisy pixels in the level2.evt file, extra rows are filled as -1
| Pixel properties | Quadrant properties | ||||||
|---|---|---|---|---|---|---|---|
| Quadrant | DetID | PixID | Counts | Sigma | Mean | Median | Sigma |
| A | 0 | 226 | 12558 | 37.89 | 1464 | 1437 | 293.5 |
| A | 12 | 194 | 10549 | 31.04 | 1464 | 1437 | 293.5 |
| A | 3 | 137 | 10412 | 30.58 | 1464 | 1437 | 293.5 |
| B | 7 | 220 | 64418 | 227.39 | 1476 | 1442 | 277.0 |
| B | 0 | 197 | 37511 | 130.24 | 1476 | 1442 | 277.0 |
| B | 4 | 216 | 34834 | 120.57 | 1476 | 1442 | 277.0 |
| C | 14 | 238 | 218911 | 664.93 | 1412 | 1421 | 327.1 |
| C | 3 | 233 | 10739 | 28.49 | 1412 | 1421 | 327.1 |
| C | 13 | 61 | 10344 | 27.28 | 1412 | 1421 | 327.1 |
| D | 7 | 238 | 3972114 | 11902.38 | 1383 | 1343 | 333.6 |
| D | 1 | 52 | 1710036 | 5121.81 | 1383 | 1343 | 333.6 |
| D | 13 | 168 | 517455 | 1547.04 | 1383 | 1343 | 333.6 |
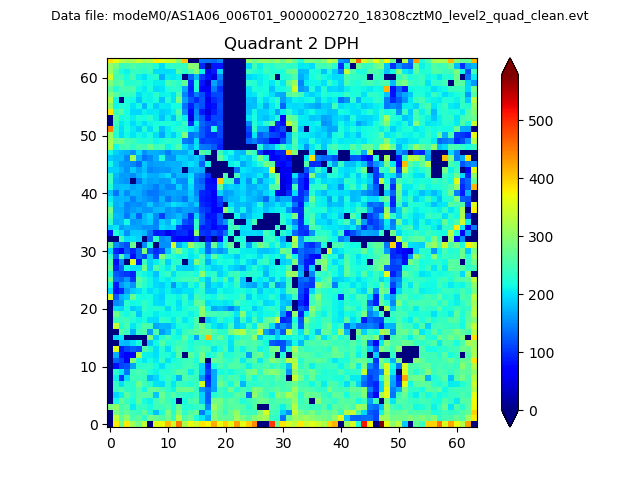
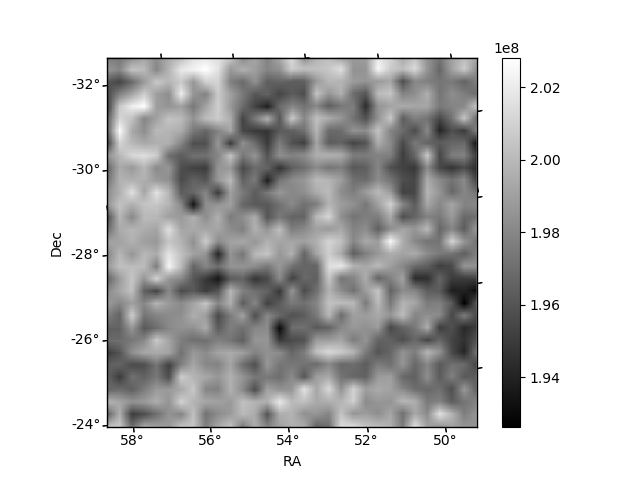
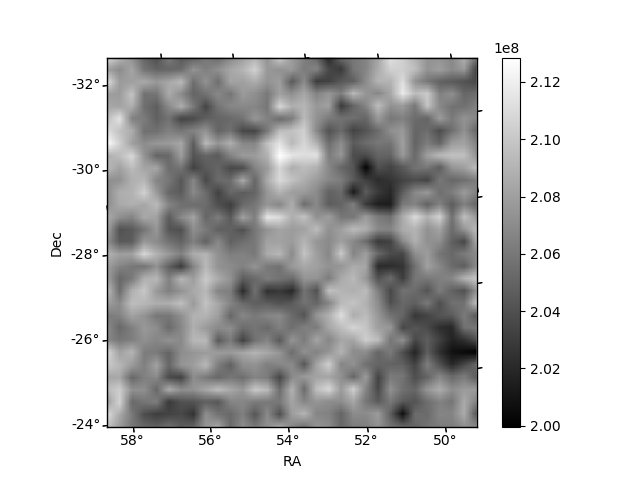
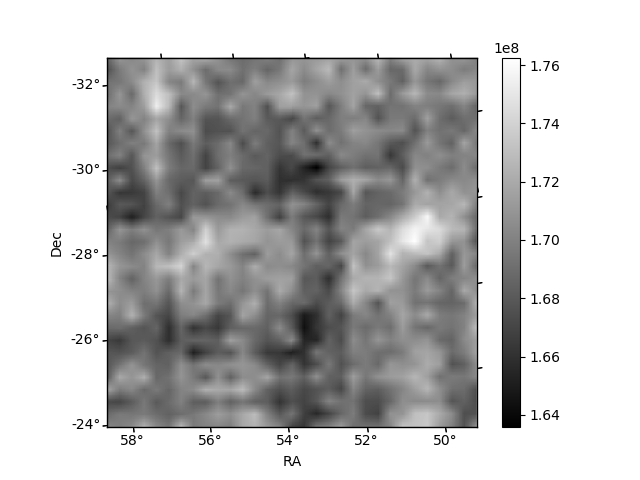
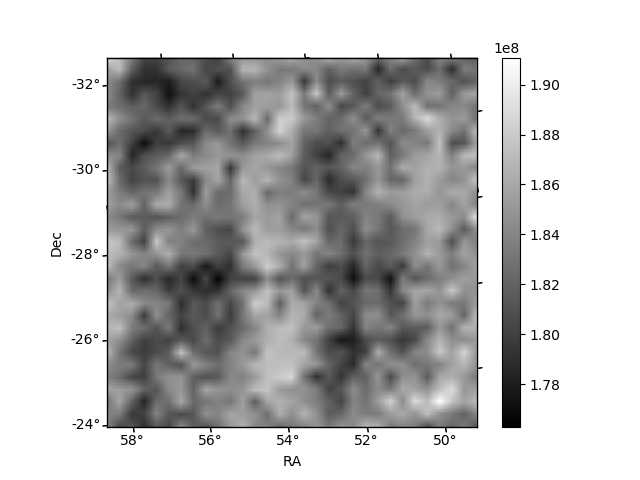
Histogram calculated using DETX and DETY for each event in the final _common_clean file
| Quadrant A |  |
 |
Quadrant B |
|---|---|---|---|
| Quadrant D | 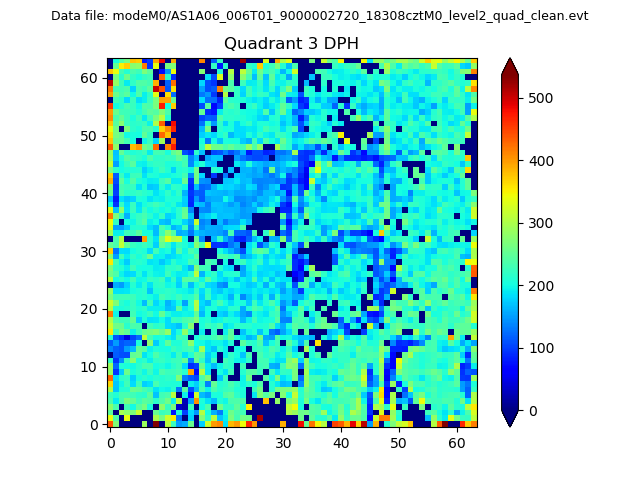 |
 |
Quadrant C |
| Plot type | Count rate plots | Images |
|---|---|---|
| Comparison with Poisson distribution Blue bars denote a histogram of data divided into 1 sec bins. Red curve is a Poisson curve with rate = median count rate of data. |
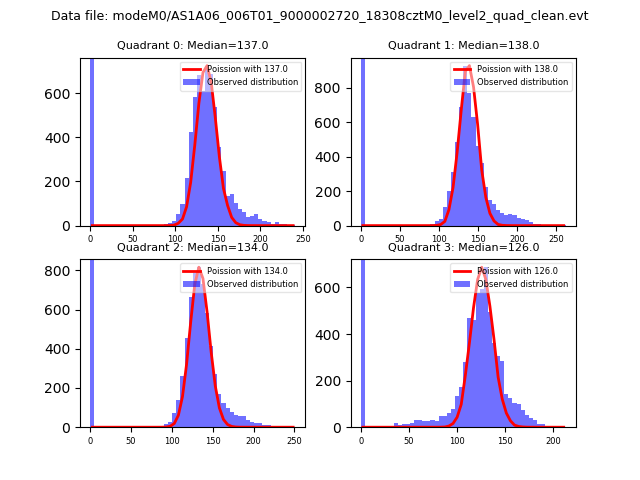 |
 |
| Quadrant-wise count rates Data is divided into 100 sec bins |
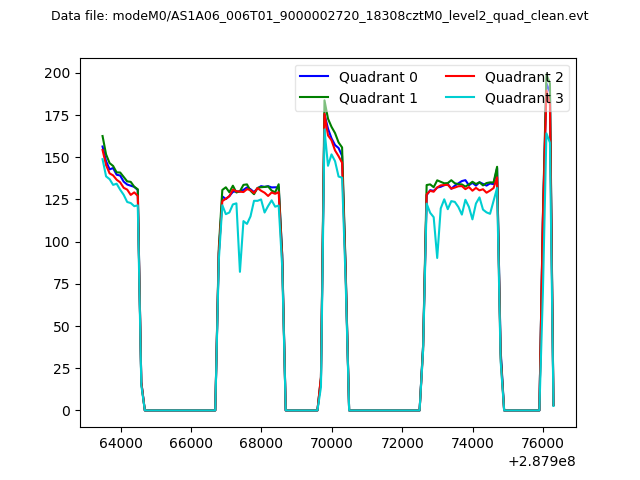 |
|
| Module-wise count rates for Quadrant A Data is divided into 100 sec bins |
 |
 |
| Module-wise count rates for Quadrant B Data is divided into 100 sec bins |
 |
 |
| Module-wise count rates for Quadrant C Data is divided into 100 sec bins |
 |
 |
| Module-wise count rates for Quadrant D Data is divided into 100 sec bins |
 |
 |
| Parameter | Plot |
|---|---|
| CZT HV Monitor |  |
| D_VDD | 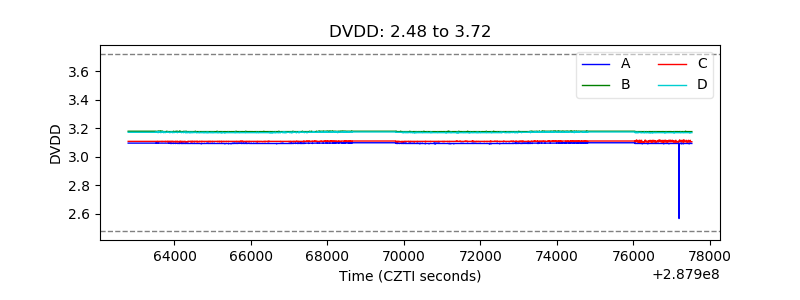 |
| Temperature 1 | 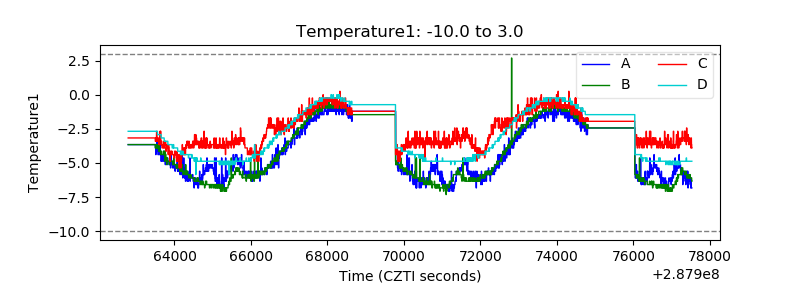 |
| Veto HV Monitor | 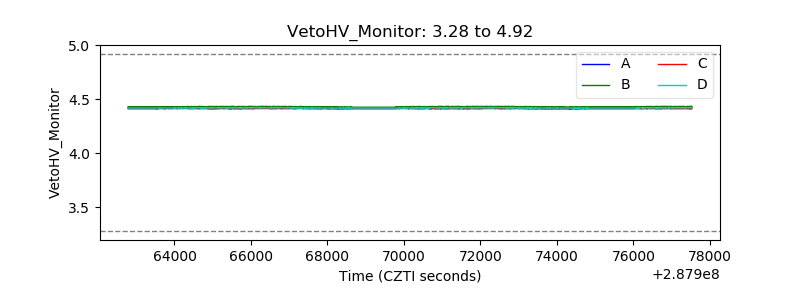 |
| Veto LLD | 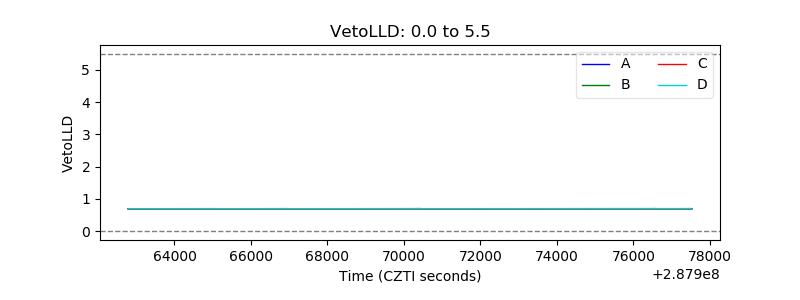 |
| Alpha Counter |  |
| _CPM_Rate | 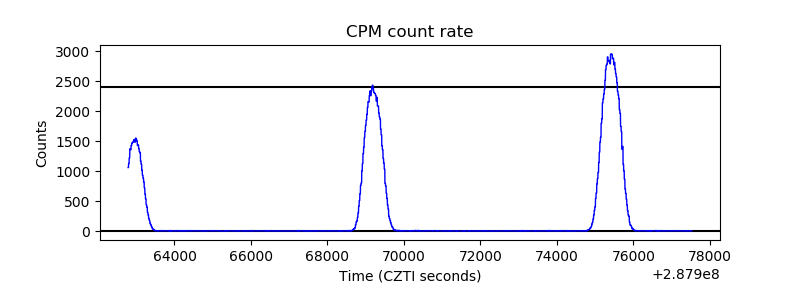 |
| CZT Counter | 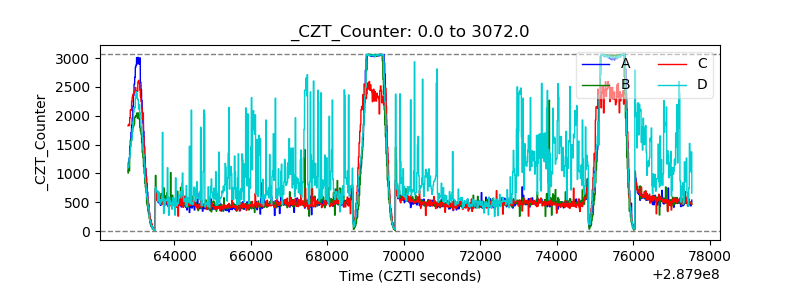 |
| +2.5 Volts monitor |  |
| +5 Volts monitor |  |
| _ROLL_ROT |  |
| _Roll_DEC | 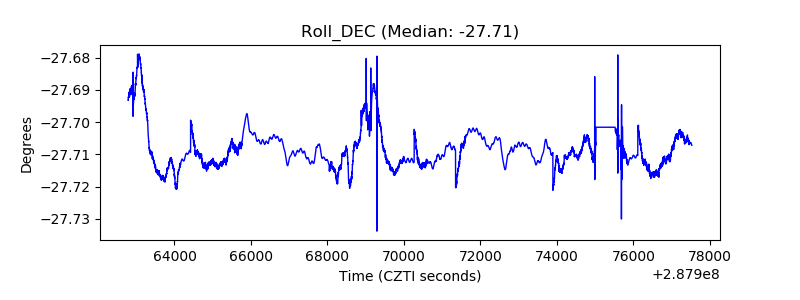 |
| _Roll_RA | 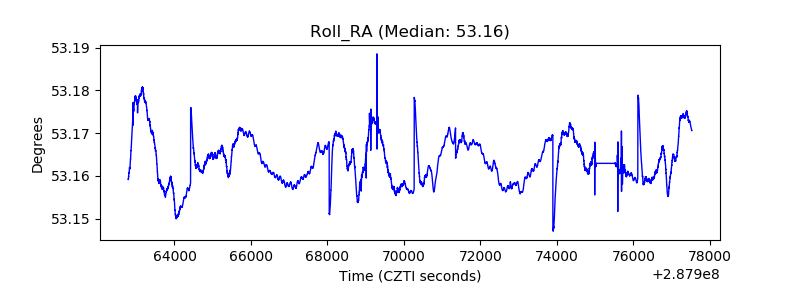 |
| Veto Counter | 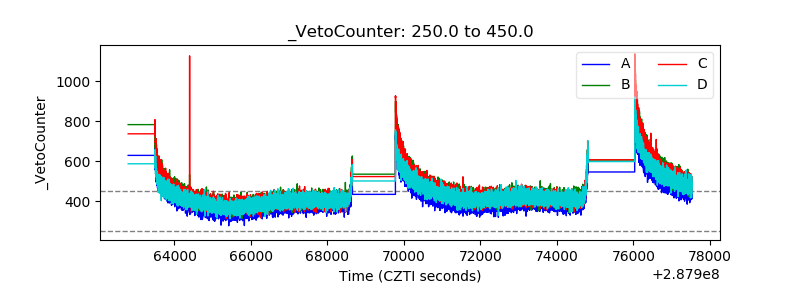 |