| Param | Original file | Final file |
|---|---|---|
| Filename | modeM0/AS1A06_006T01_9000002720_18309cztM0_level2.evt | modeM0/AS1A06_006T01_9000002720_18309cztM0_level2_quad_clean.evt |
| Size (bytes) | 585,682,560 | 57,697,920 |
| Size | 558.6 MB | 55.0 MB |
| Events in quadrant A | 3,107,982 | 342,478 |
| Events in quadrant B | 3,343,247 | 344,964 |
| Events in quadrant C | 3,222,358 | 337,853 |
| Events in quadrant D | 7,655,525 | 299,395 |
| Mode SS | |||
|---|---|---|---|
| Quadrant | BADHDUFLAG | Total packets | Discarded packets |
| A | 0 | 122 | 0 |
| B | 0 | 122 | 0 |
| C | 0 | 122 | 0 |
| D | 0 | 122 | 0 |
| Mode M9 | |||
|---|---|---|---|
| Quadrant | BADHDUFLAG | Total packets | Discarded packets |
| A | 0 | 13 | 0 |
| B | 0 | 13 | 0 |
| C | 0 | 13 | 0 |
| D | 0 | 13 | 0 |
| Mode M0 | |||
|---|---|---|---|
| Quadrant | BADHDUFLAG | Total packets | Discarded packets |
| A | 0 | 12670 | 1 |
| B | 0 | 13410 | 1 |
| C | 0 | 12961 | 1 |
| D | 0 | 26998 | 3 |
| Quadrant | Total seconds | Saturated seconds | Saturation percentage |
|---|---|---|---|
| A | 6041 | 36 | 0.595928% |
| B | 6042 | 85 | 1.406819% |
| C | 6042 | 79 | 1.307514% |
| D | 6041 | 845 | 13.987750% |
Noise dominated data is calculated using 1-second bins in cleaned event files. If a bin has >2000 counts, and if more than 50% of those come from <1% of pixels, then it is considered to be noise-dominated and hence unusable.
| Quadrant | # 1 sec bins | Bins with >0 counts | Bins with >2000 counts | High rate bins dominated by noise | Noise dominated (total time) | Noise dominated (detector-on time) | Marked lightcurve |
|---|---|---|---|---|---|---|---|
| A | 7336 | 6042 | 0 | 0 | 0.00% | 0.00% | 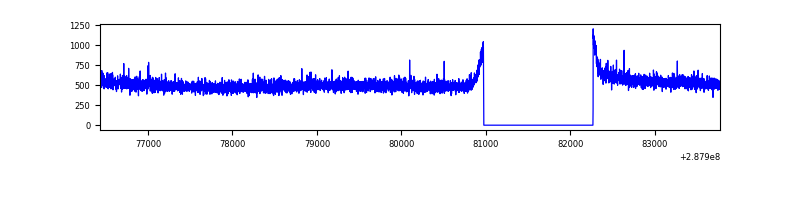 |
| B | 7337 | 6043 | 17 | 17 | 0.23% | 0.28% | 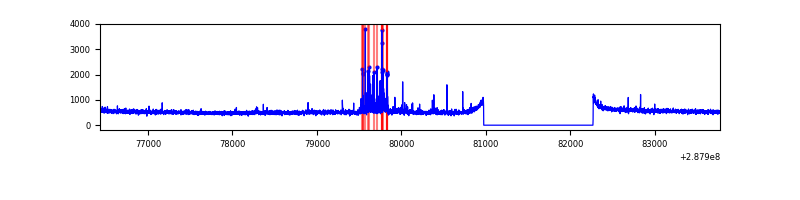 |
| C | 7337 | 6043 | 0 | 0 | 0.00% | 0.00% | 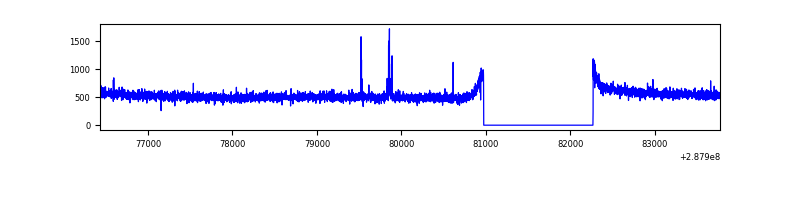 |
| D | 7336 | 6041 | 764 | 764 | 10.41% | 12.65% | 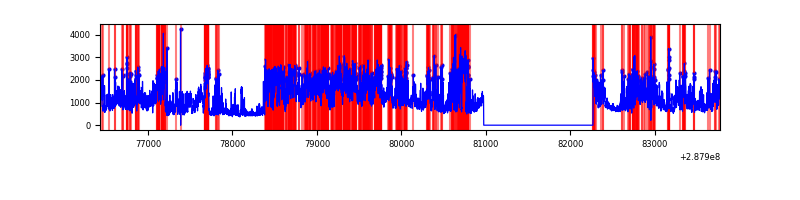 |
Top three noisy pixels from each quadrant. If the there are fewer than three noisy pixels in the level2.evt file, extra rows are filled as -1
| Pixel properties | Quadrant properties | ||||||
|---|---|---|---|---|---|---|---|
| Quadrant | DetID | PixID | Counts | Sigma | Mean | Median | Sigma |
| A | 0 | 226 | 7229 | 39.95 | 808 | 791 | 161.2 |
| A | 12 | 194 | 5778 | 30.95 | 808 | 791 | 161.2 |
| A | 3 | 137 | 5564 | 29.62 | 808 | 791 | 161.2 |
| B | 7 | 220 | 141170 | 931.25 | 813 | 797 | 150.7 |
| B | 12 | 111 | 16770 | 105.97 | 813 | 797 | 150.7 |
| B | 11 | 111 | 14317 | 89.69 | 813 | 797 | 150.7 |
| C | 14 | 238 | 123903 | 685.41 | 782 | 789 | 179.6 |
| C | 0 | 207 | 21652 | 116.15 | 782 | 789 | 179.6 |
| C | 3 | 233 | 15222 | 80.35 | 782 | 789 | 179.6 |
| D | 7 | 238 | 3717055 | 20251.4 | 760 | 737 | 183.5 |
| D | 1 | 52 | 755250 | 4111.58 | 760 | 737 | 183.5 |
| D | 13 | 168 | 261432 | 1420.61 | 760 | 737 | 183.5 |
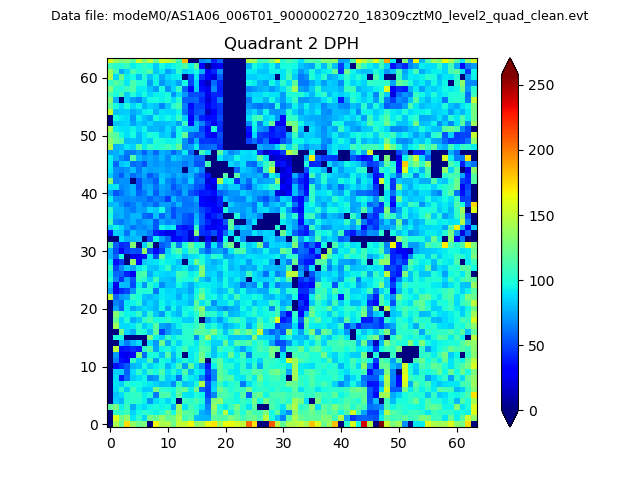
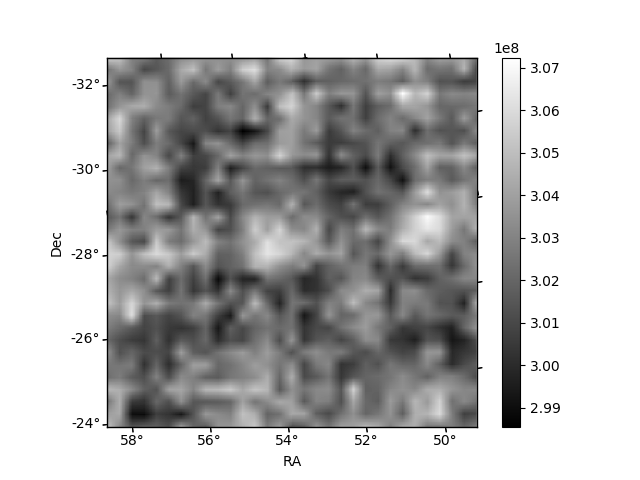
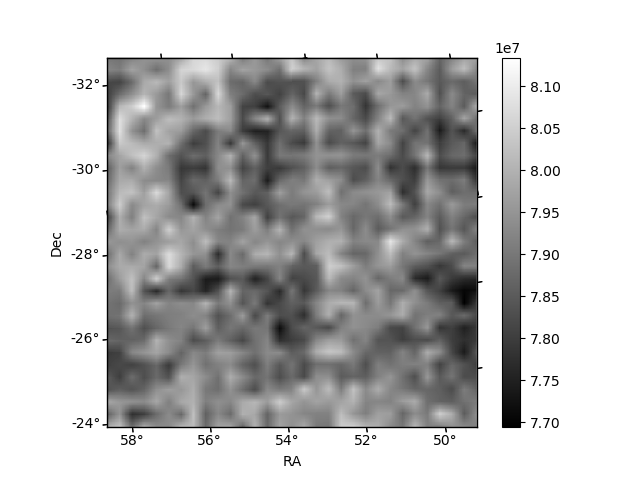
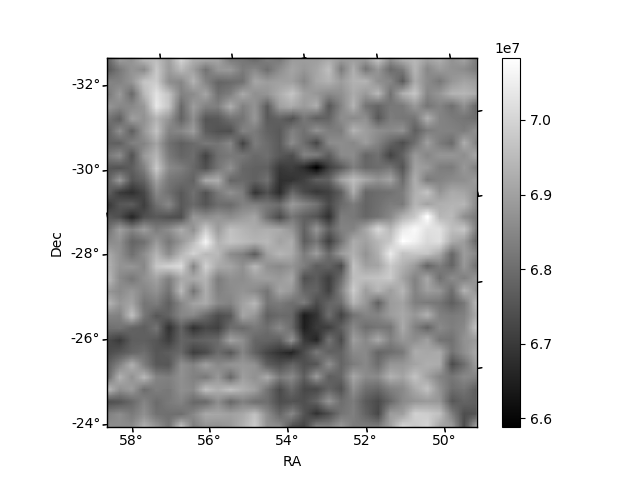
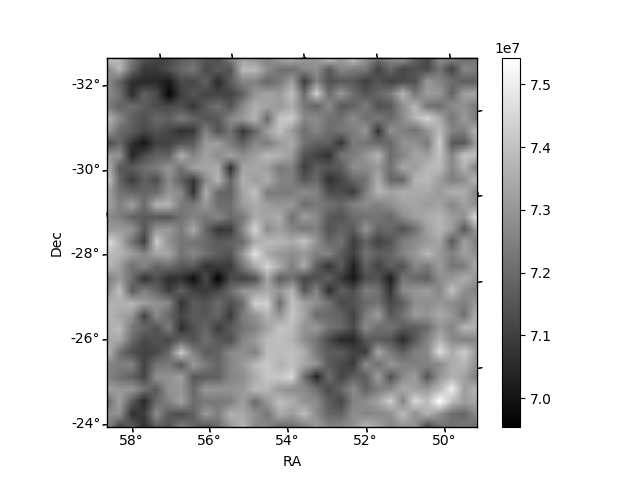
Histogram calculated using DETX and DETY for each event in the final _common_clean file
| Quadrant A | 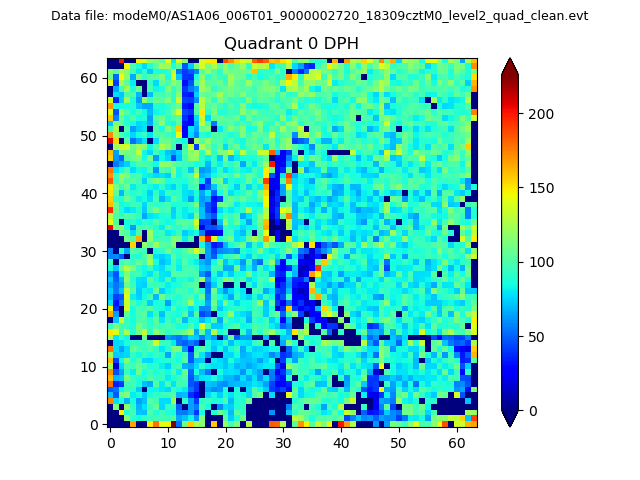 |
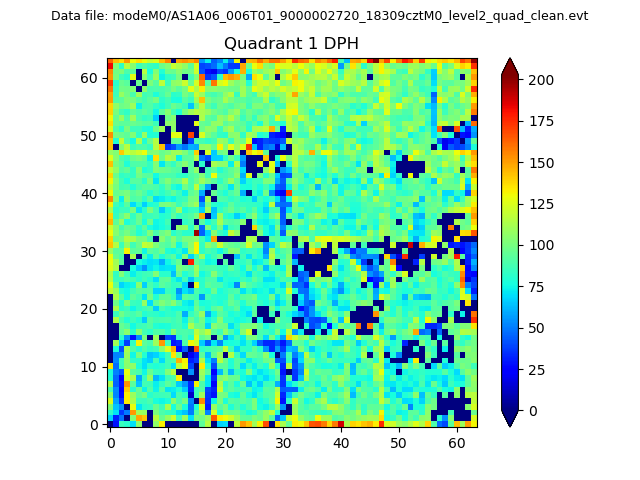 |
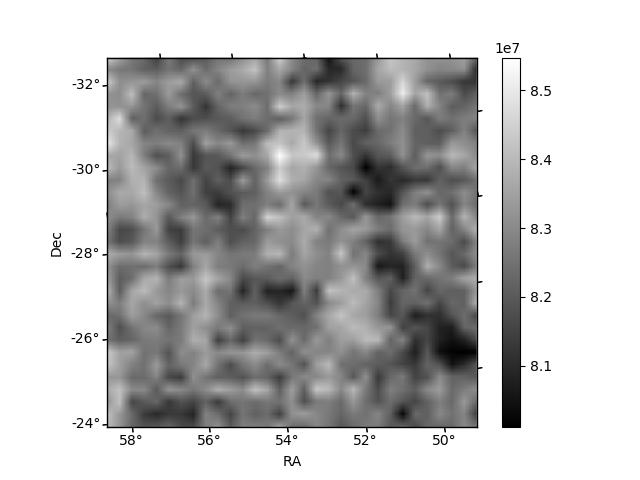
Quadrant B |
|---|---|---|---|
| Quadrant D | 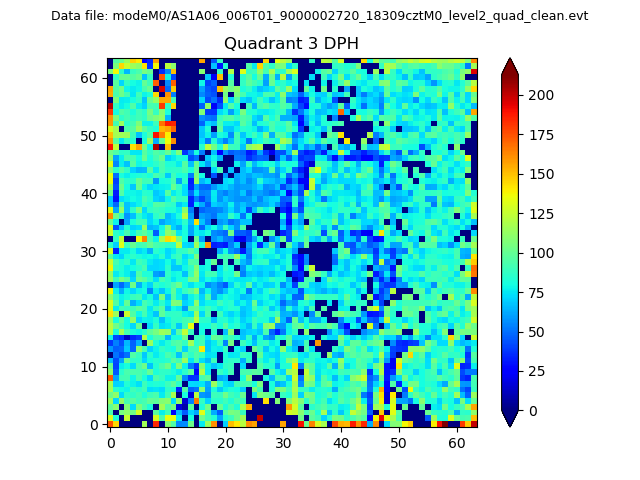 |
 |
Quadrant C |
| Plot type | Count rate plots | Images |
|---|---|---|
| Comparison with Poisson distribution Blue bars denote a histogram of data divided into 1 sec bins. Red curve is a Poisson curve with rate = median count rate of data. |
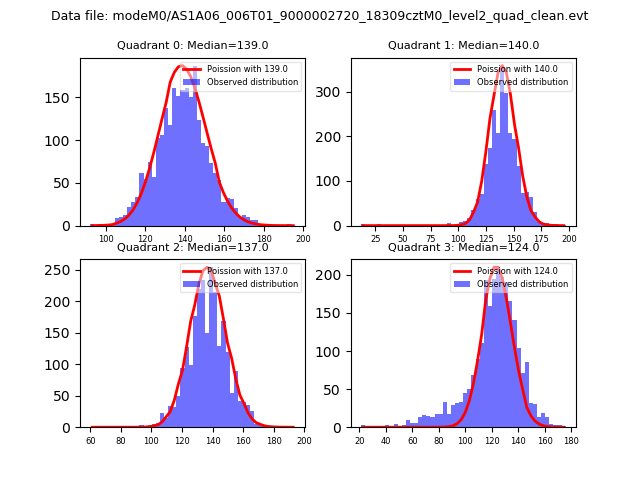 |
 |
| Quadrant-wise count rates Data is divided into 100 sec bins |
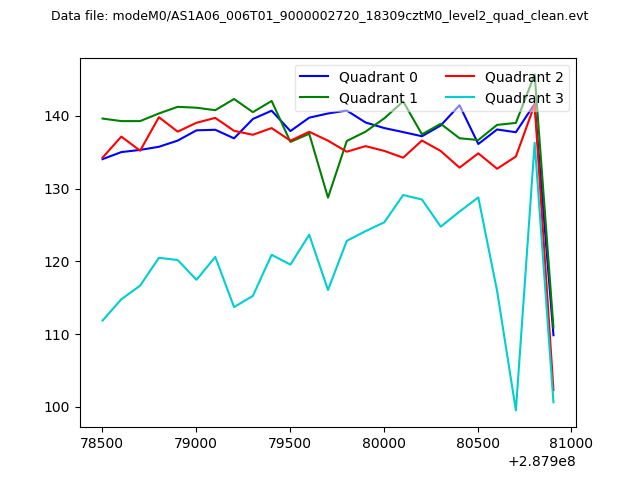 |
|
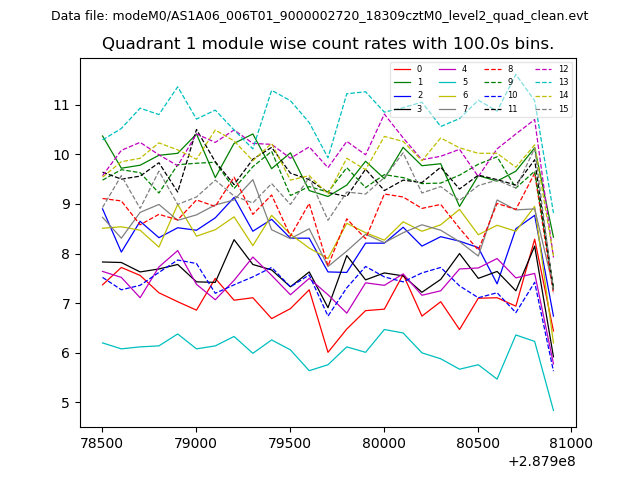
| Module-wise count rates for Quadrant A Data is divided into 100 sec bins |
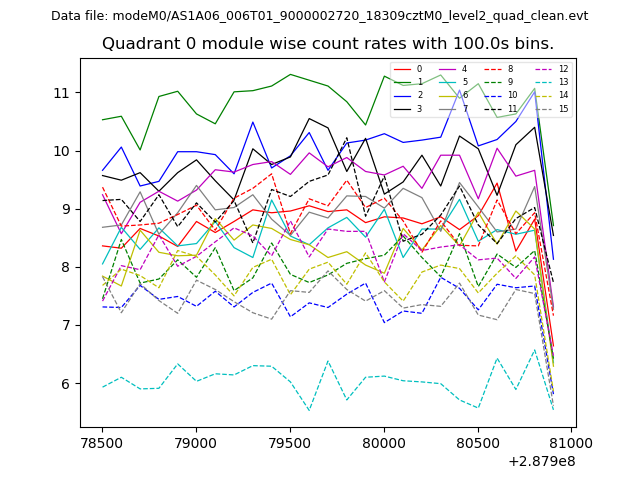 |
 |
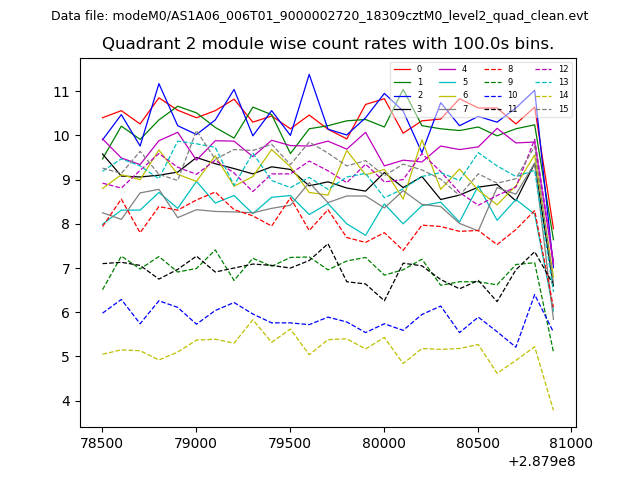
| Module-wise count rates for Quadrant B Data is divided into 100 sec bins |
 |
 |
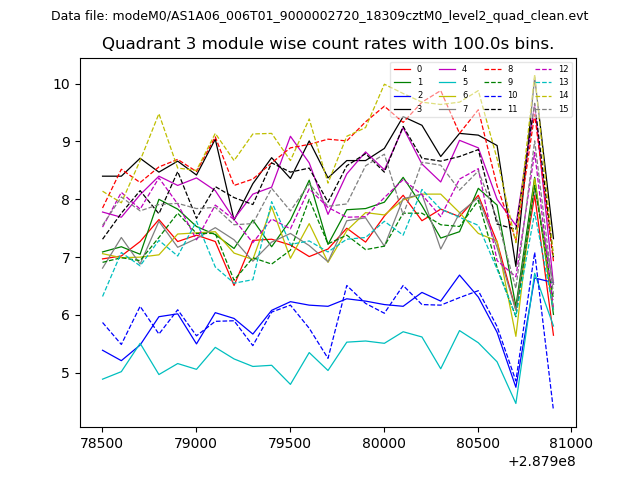
| Module-wise count rates for Quadrant C Data is divided into 100 sec bins |
 |
 |
| Module-wise count rates for Quadrant D Data is divided into 100 sec bins |
 |
 |
| Parameter | Plot |
|---|---|
| CZT HV Monitor | 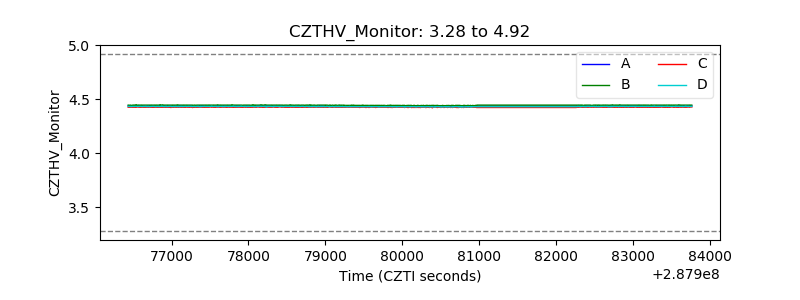 |
| D_VDD |  |
| Temperature 1 |  |
| Veto HV Monitor | 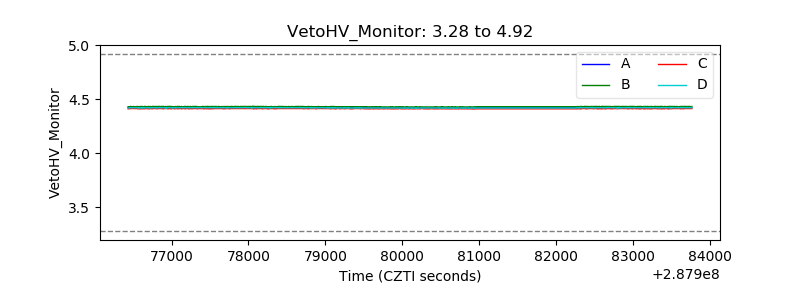 |
| Veto LLD | 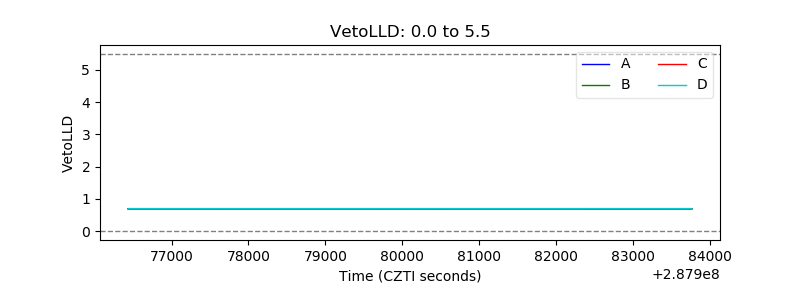 |
| Alpha Counter | 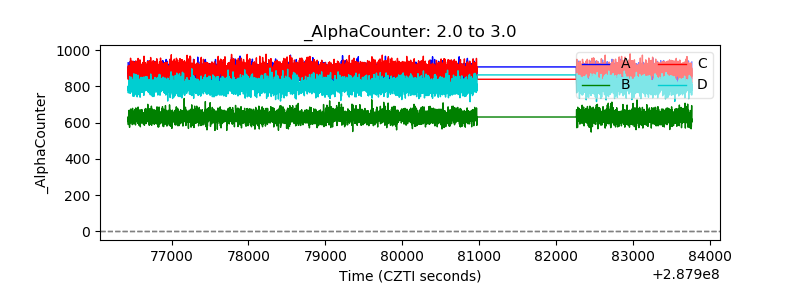 |
| _CPM_Rate | 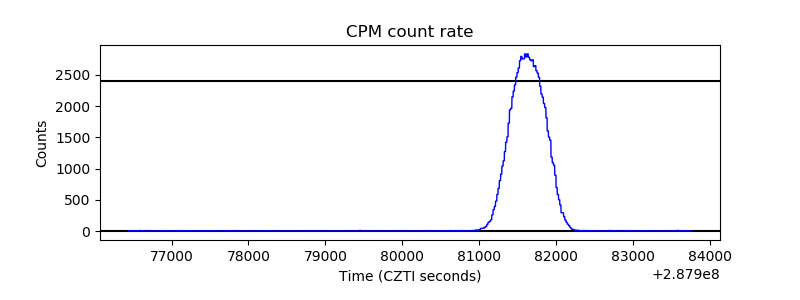 |
| CZT Counter | 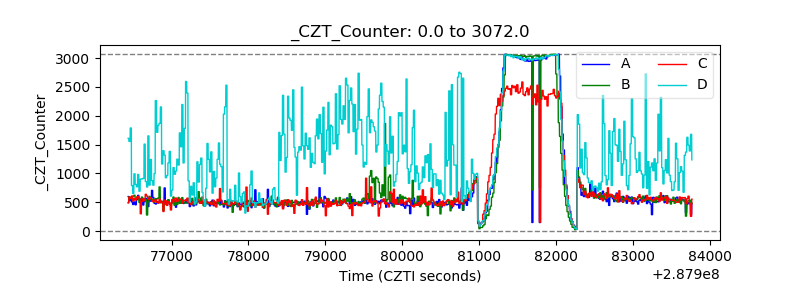 |
| +2.5 Volts monitor | 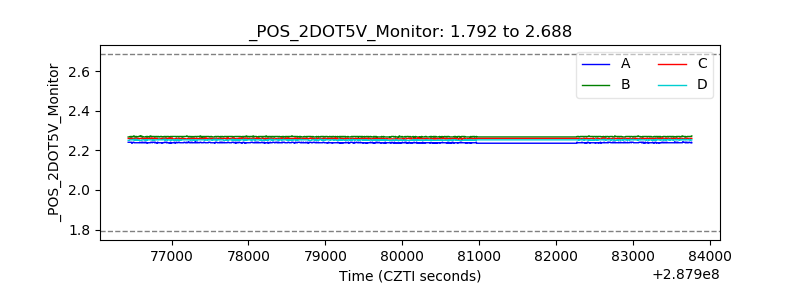 |
| +5 Volts monitor |  |
| _ROLL_ROT | 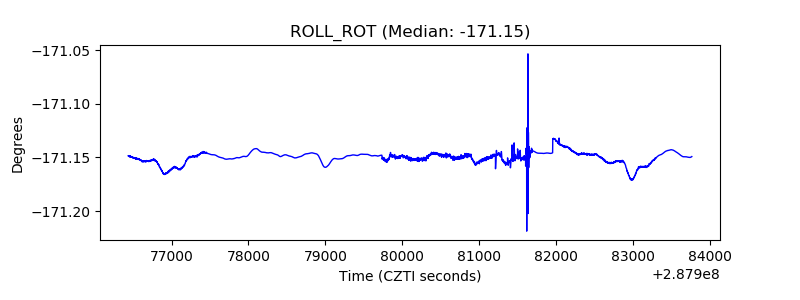 |
| _Roll_DEC | 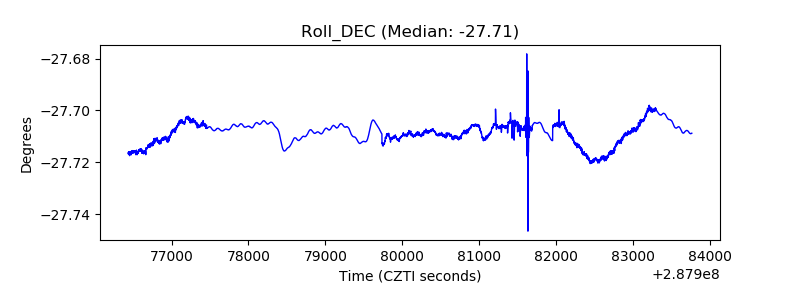 |
| _Roll_RA | 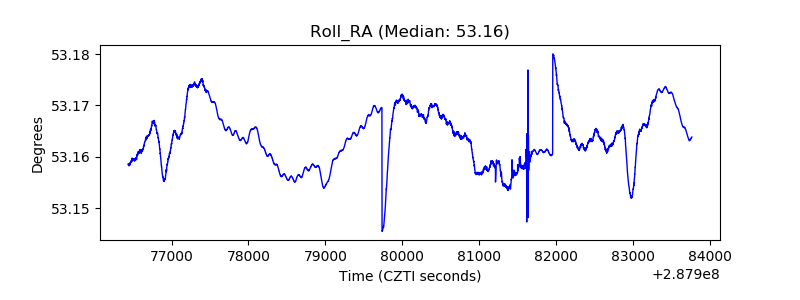 |
| Veto Counter |  |