| Param | Original file | Final file |
|---|---|---|
| Filename | modeM0/AS1A06_006T01_9000002720_18311cztM0_level2.evt | modeM0/AS1A06_006T01_9000002720_18311cztM0_level2_quad_clean.evt |
| Size (bytes) | 887,904,000 | 139,947,840 |
| Size | 846.8 MB | 133.5 MB |
| Events in quadrant A | 5,580,935 | 888,234 |
| Events in quadrant B | 5,910,010 | 895,392 |
| Events in quadrant C | 5,687,288 | 875,010 |
| Events in quadrant D | 8,989,328 | 838,820 |
| Mode SS | |||
|---|---|---|---|
| Quadrant | BADHDUFLAG | Total packets | Discarded packets |
| A | 0 | 216 | 0 |
| B | 0 | 216 | 0 |
| C | 0 | 216 | 0 |
| D | 0 | 216 | 0 |
| Mode M9 | |||
|---|---|---|---|
| Quadrant | BADHDUFLAG | Total packets | Discarded packets |
| A | 0 | 27 | 0 |
| B | 0 | 27 | 0 |
| C | 0 | 27 | 0 |
| D | 0 | 27 | 0 |
| Mode M0 | |||
|---|---|---|---|
| Quadrant | BADHDUFLAG | Total packets | Discarded packets |
| A | 0 | 22605 | 2 |
| B | 0 | 23633 | 2 |
| C | 0 | 23059 | 2 |
| D | 0 | 33944 | 2 |
| Quadrant | Total seconds | Saturated seconds | Saturation percentage |
|---|---|---|---|
| A | 10704 | 148 | 1.382661% |
| B | 10705 | 199 | 1.858944% |
| C | 10705 | 243 | 2.269967% |
| D | 10705 | 660 | 6.165343% |
Noise dominated data is calculated using 1-second bins in cleaned event files. If a bin has >2000 counts, and if more than 50% of those come from <1% of pixels, then it is considered to be noise-dominated and hence unusable.
| Quadrant | # 1 sec bins | Bins with >0 counts | Bins with >2000 counts | High rate bins dominated by noise | Noise dominated (total time) | Noise dominated (detector-on time) | Marked lightcurve |
|---|---|---|---|---|---|---|---|
| A | 13319 | 10706 | 0 | 0 | 0.00% | 0.00% | 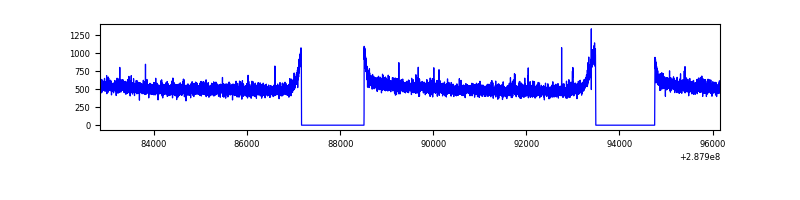 |
| B | 13320 | 10707 | 11 | 11 | 0.08% | 0.10% | 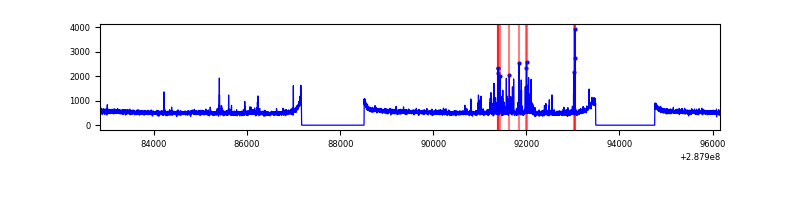 |
| C | 13320 | 10707 | 1 | 1 | 0.01% | 0.01% | 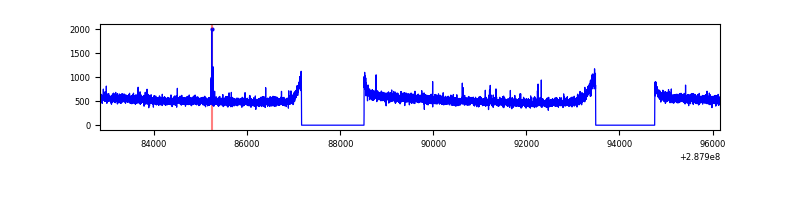 |
| D | 13320 | 10707 | 485 | 485 | 3.64% | 4.53% | 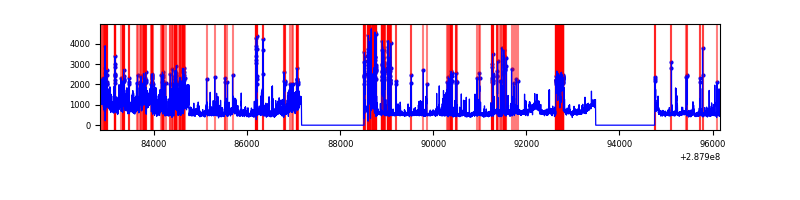 |
Top three noisy pixels from each quadrant. If the there are fewer than three noisy pixels in the level2.evt file, extra rows are filled as -1
| Pixel properties | Quadrant properties | ||||||
|---|---|---|---|---|---|---|---|
| Quadrant | DetID | PixID | Counts | Sigma | Mean | Median | Sigma |
| A | 0 | 226 | 13076 | 40.49 | 1449 | 1423 | 287.8 |
| A | 12 | 194 | 10678 | 32.16 | 1449 | 1423 | 287.8 |
| A | 3 | 137 | 9845 | 29.27 | 1449 | 1423 | 287.8 |
| B | 7 | 220 | 158728 | 581.81 | 1444 | 1413 | 270.4 |
| B | 0 | 197 | 39780 | 141.9 | 1444 | 1413 | 270.4 |
| B | 12 | 111 | 30113 | 106.14 | 1444 | 1413 | 270.4 |
| C | 14 | 238 | 218884 | 682.28 | 1392 | 1410 | 318.7 |
| C | 3 | 233 | 24302 | 71.82 | 1392 | 1410 | 318.7 |
| C | 0 | 207 | 15609 | 44.55 | 1392 | 1410 | 318.7 |
| D | 1 | 52 | 1484053 | 4430.04 | 1385 | 1346 | 334.7 |
| D | 7 | 238 | 1250654 | 3732.69 | 1385 | 1346 | 334.7 |
| D | 13 | 168 | 690676 | 2059.59 | 1385 | 1346 | 334.7 |
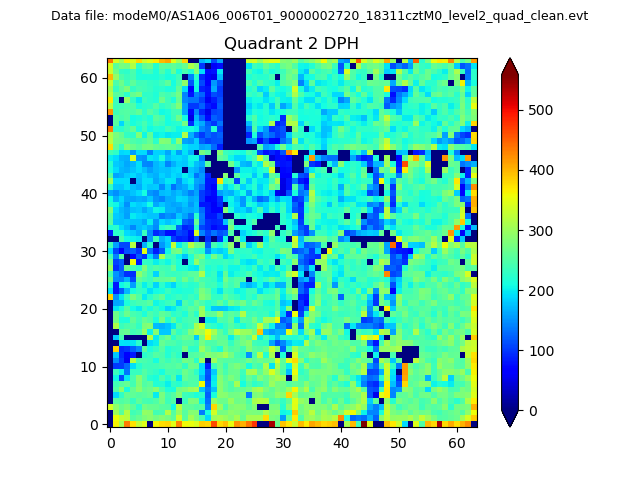
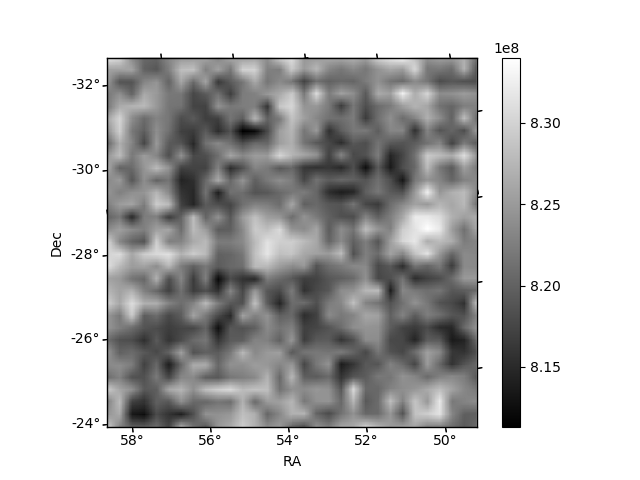
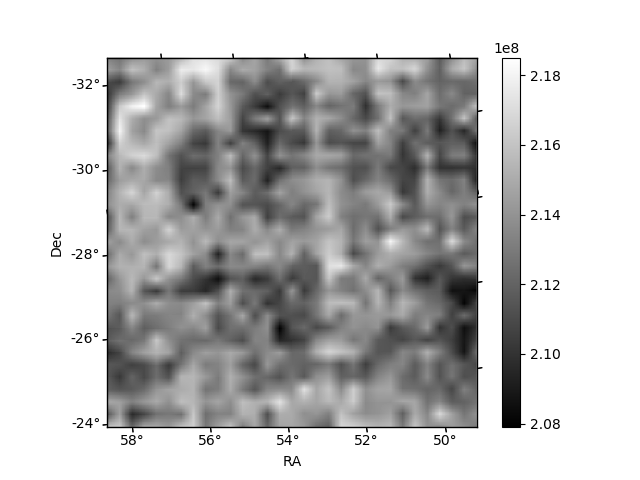
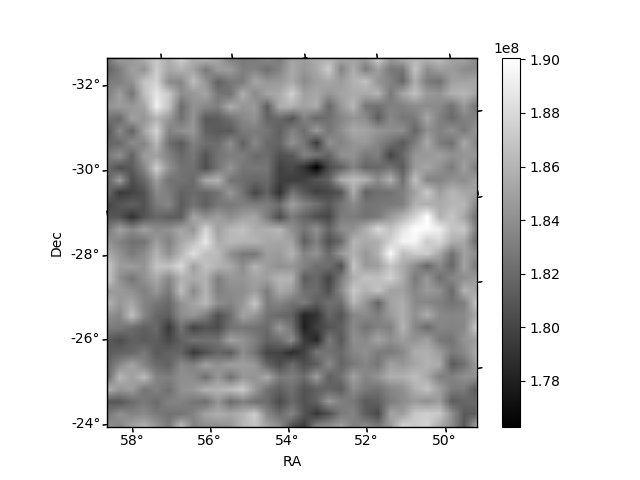
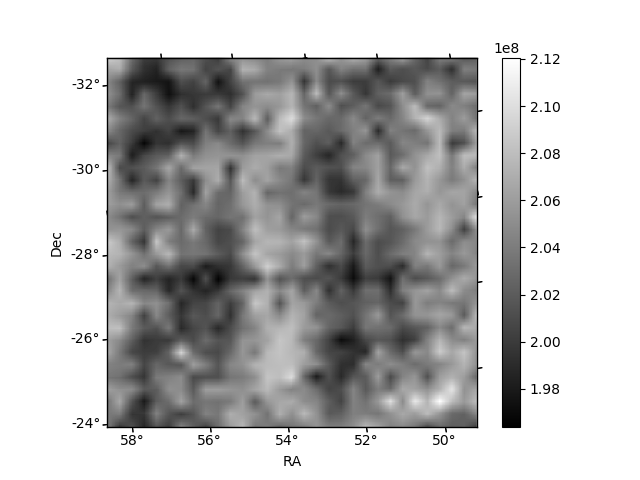
Histogram calculated using DETX and DETY for each event in the final _common_clean file
| Quadrant A | 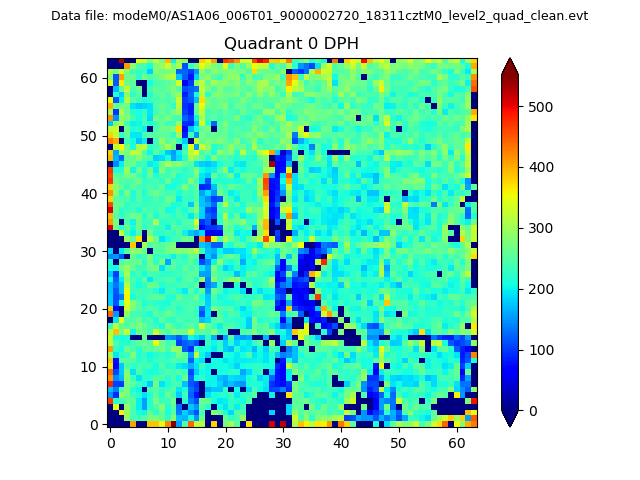 |
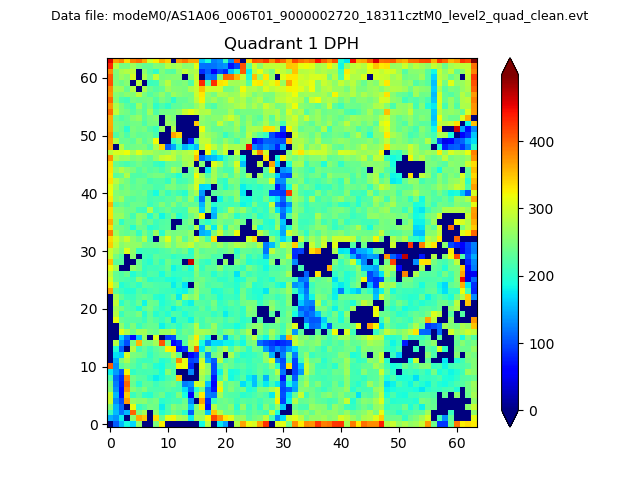 |
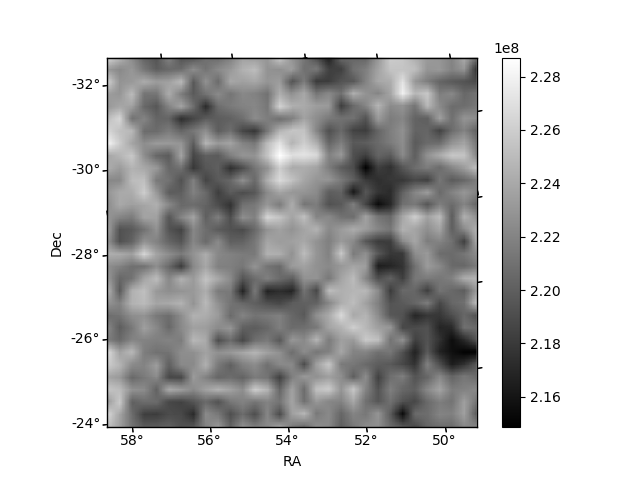
Quadrant B |
|---|---|---|---|
| Quadrant D | 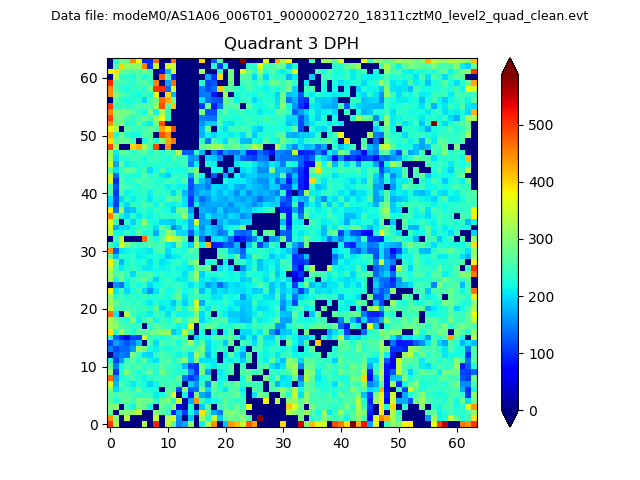 |
 |
Quadrant C |
| Plot type | Count rate plots | Images |
|---|---|---|
| Comparison with Poisson distribution Blue bars denote a histogram of data divided into 1 sec bins. Red curve is a Poisson curve with rate = median count rate of data. |
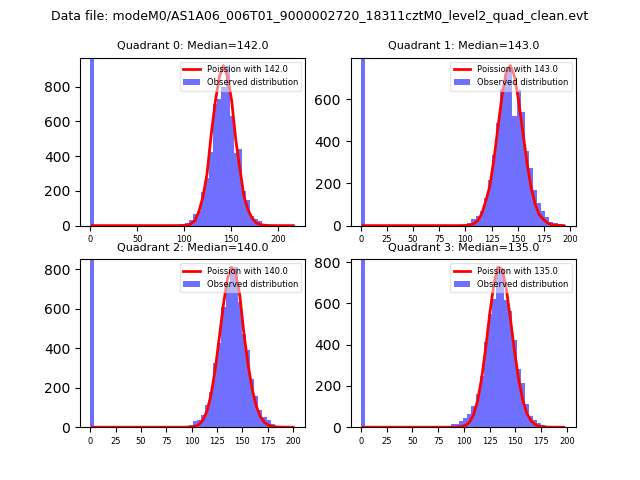 |
 |
| Quadrant-wise count rates Data is divided into 100 sec bins |
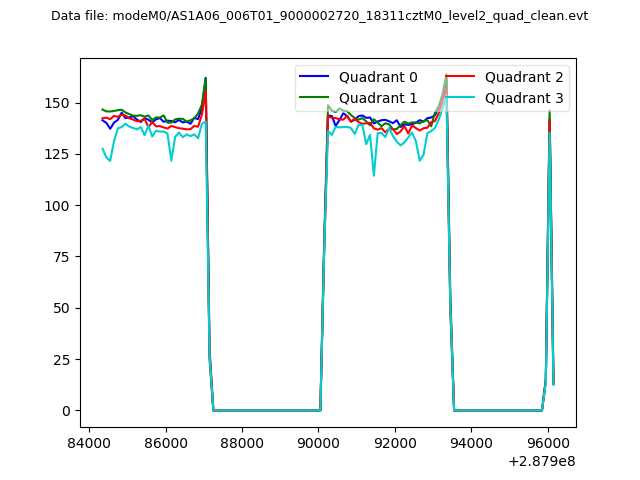 |
|
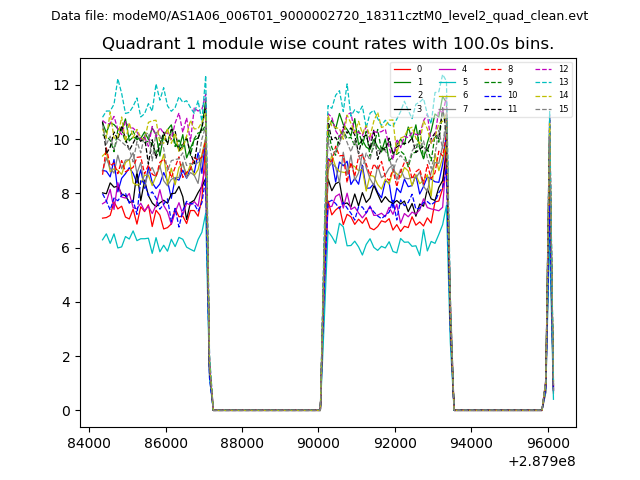
| Module-wise count rates for Quadrant A Data is divided into 100 sec bins |
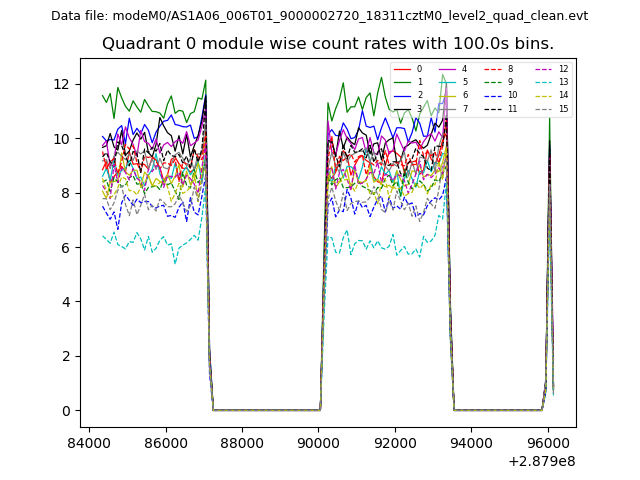 |
 |
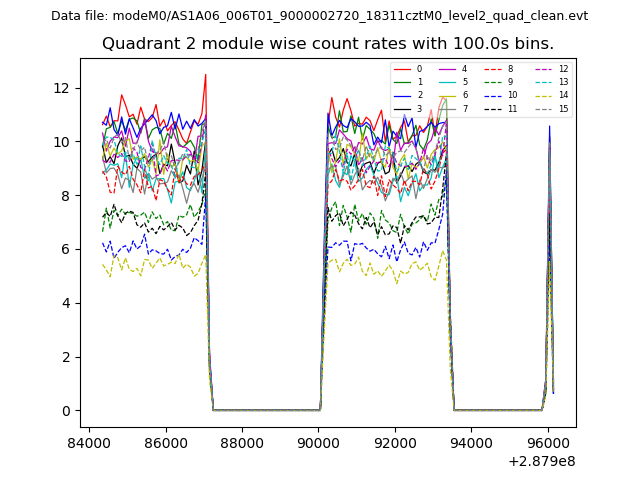
| Module-wise count rates for Quadrant B Data is divided into 100 sec bins |
 |
 |
| Module-wise count rates for Quadrant C Data is divided into 100 sec bins |
 |
 |
| Module-wise count rates for Quadrant D Data is divided into 100 sec bins |
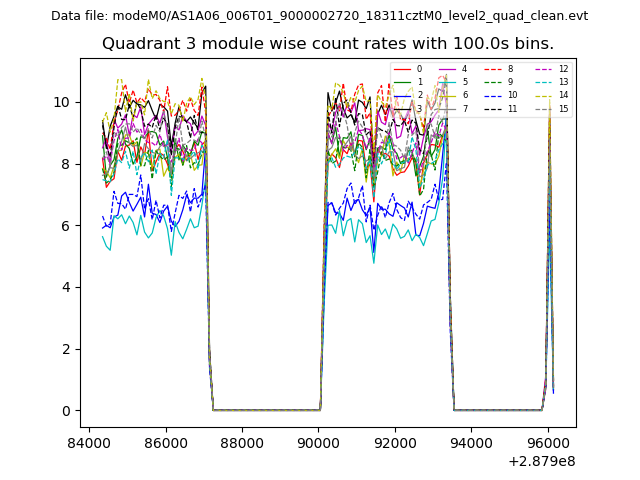 |
 |
| Parameter | Plot |
|---|---|
| CZT HV Monitor | 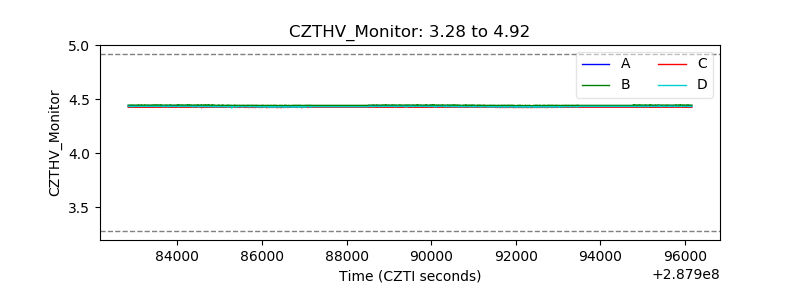 |
| D_VDD | 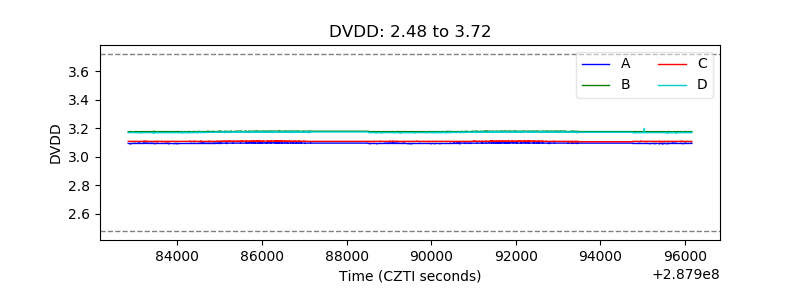 |
| Temperature 1 | 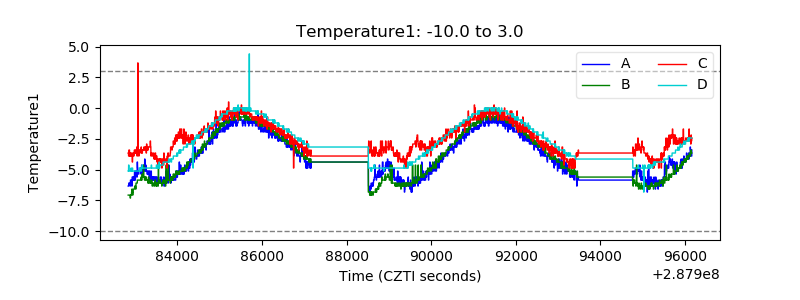 |
| Veto HV Monitor | 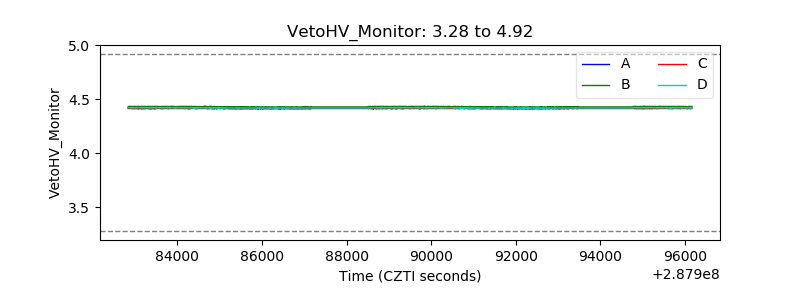 |
| Veto LLD | 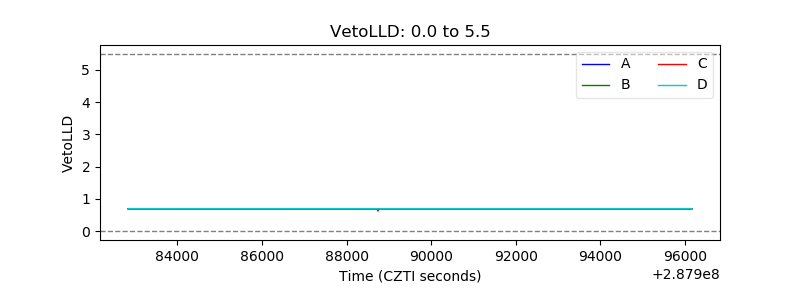 |
| Alpha Counter | 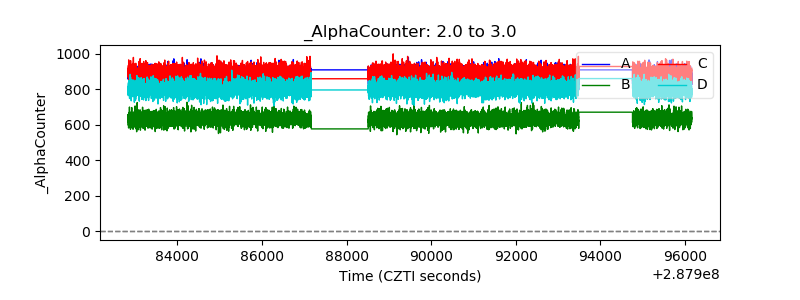 |
| _CPM_Rate | 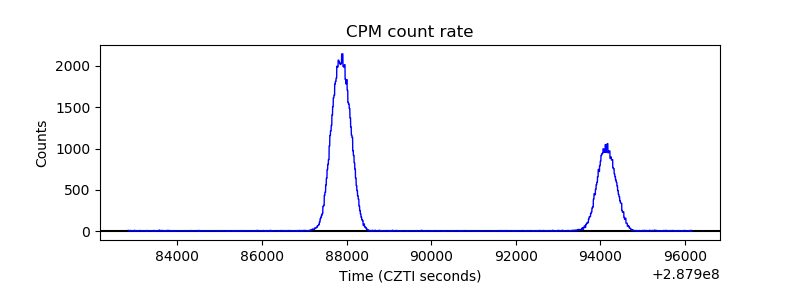 |
| CZT Counter | 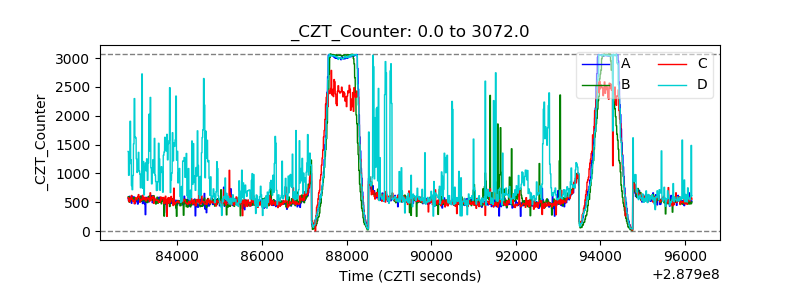 |
| +2.5 Volts monitor | 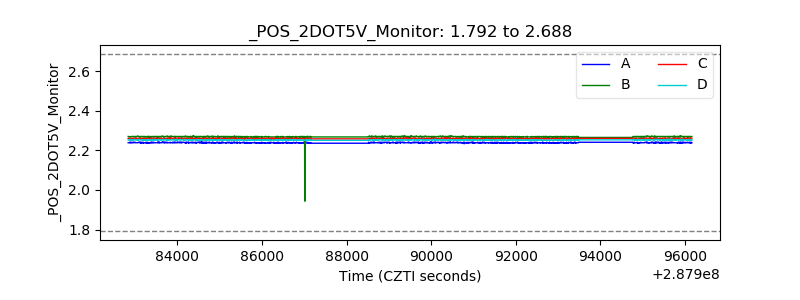 |
| +5 Volts monitor |  |
| _ROLL_ROT | 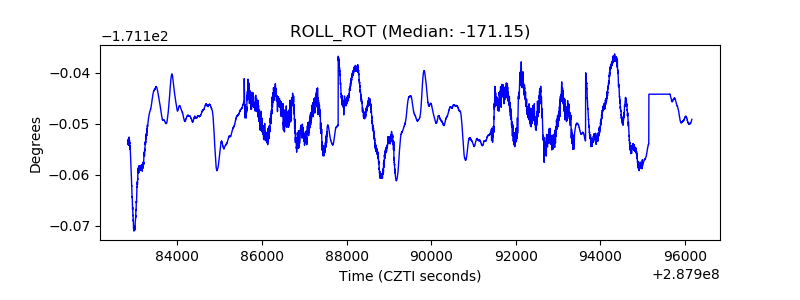 |
| _Roll_DEC | 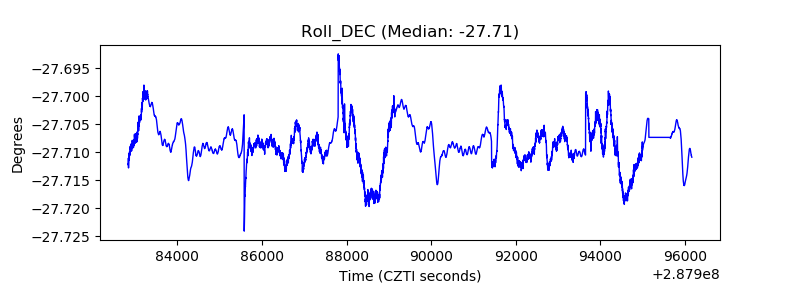 |
| _Roll_RA | 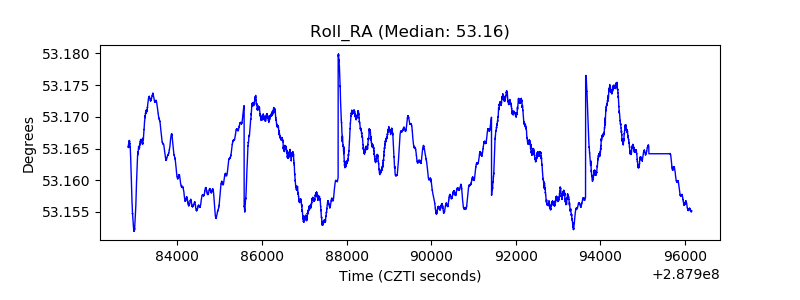 |
| Veto Counter | 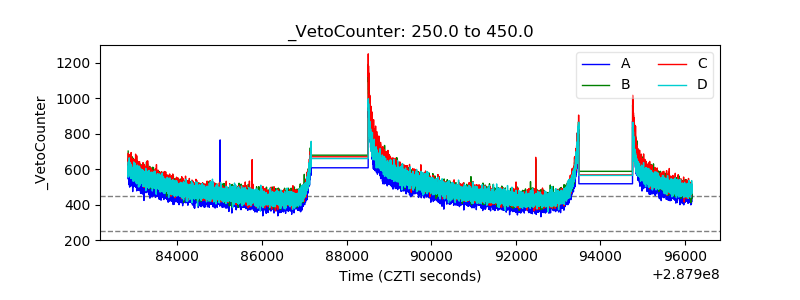 |