| Param | Original file | Final file |
|---|---|---|
| Filename | modeM0/AS1A06_006T01_9000002720_18312cztM0_level2.evt | modeM0/AS1A06_006T01_9000002720_18312cztM0_level2_quad_clean.evt |
| Size (bytes) | 526,420,800 | 88,418,880 |
| Size | 502.0 MB | 84.3 MB |
| Events in quadrant A | 3,351,728 | 567,323 |
| Events in quadrant B | 3,547,971 | 569,550 |
| Events in quadrant C | 3,378,028 | 554,638 |
| Events in quadrant D | 5,218,489 | 527,103 |
| Mode SS | |||
|---|---|---|---|
| Quadrant | BADHDUFLAG | Total packets | Discarded packets |
| A | 0 | 134 | 0 |
| B | 0 | 134 | 0 |
| C | 0 | 134 | 0 |
| D | 0 | 134 | 0 |
| Mode M9 | |||
|---|---|---|---|
| Quadrant | BADHDUFLAG | Total packets | Discarded packets |
| A | 0 | 19 | 0 |
| B | 0 | 20 | 0 |
| C | 0 | 20 | 0 |
| D | 0 | 20 | 0 |
| Mode M0 | |||
|---|---|---|---|
| Quadrant | BADHDUFLAG | Total packets | Discarded packets |
| A | 0 | 13836 | 2 |
| B | 0 | 14363 | 2 |
| C | 0 | 13957 | 2 |
| D | 0 | 19858 | 3 |
| Quadrant | Total seconds | Saturated seconds | Saturation percentage |
|---|---|---|---|
| A | 6579 | 144 | 2.188782% |
| B | 6579 | 172 | 2.614379% |
| C | 6579 | 178 | 2.705578% |
| D | 6578 | 381 | 5.792034% |
Noise dominated data is calculated using 1-second bins in cleaned event files. If a bin has >2000 counts, and if more than 50% of those come from <1% of pixels, then it is considered to be noise-dominated and hence unusable.
| Quadrant | # 1 sec bins | Bins with >0 counts | Bins with >2000 counts | High rate bins dominated by noise | Noise dominated (total time) | Noise dominated (detector-on time) | Marked lightcurve |
|---|---|---|---|---|---|---|---|
| A | 7634 | 6580 | 0 | 0 | 0.00% | 0.00% | 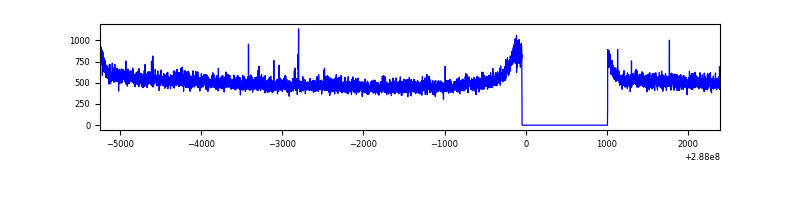 |
| B | 7634 | 6580 | 5 | 5 | 0.07% | 0.08% | 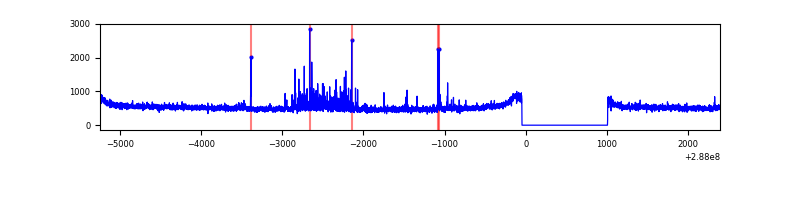 |
| C | 7634 | 6580 | 0 | 0 | 0.00% | 0.00% | 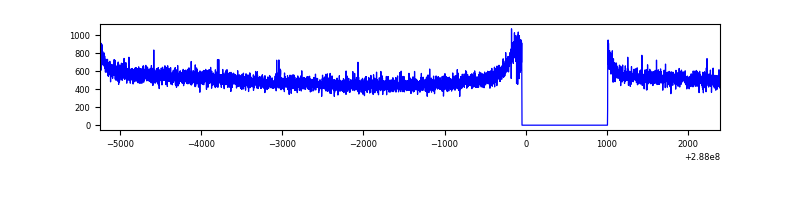 |
| D | 7633 | 6579 | 306 | 306 | 4.01% | 4.65% | 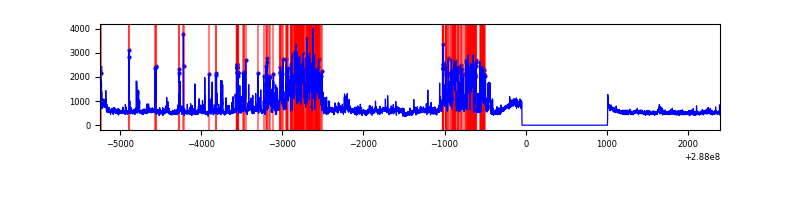 |
Top three noisy pixels from each quadrant. If the there are fewer than three noisy pixels in the level2.evt file, extra rows are filled as -1
| Pixel properties | Quadrant properties | ||||||
|---|---|---|---|---|---|---|---|
| Quadrant | DetID | PixID | Counts | Sigma | Mean | Median | Sigma |
| A | 0 | 226 | 7527 | 38.24 | 870 | 851 | 174.6 |
| A | 4 | 2 | 6807 | 34.12 | 870 | 851 | 174.6 |
| A | 12 | 194 | 6336 | 31.42 | 870 | 851 | 174.6 |
| B | 7 | 220 | 128642 | 774.21 | 863 | 840 | 165.1 |
| B | 0 | 197 | 18652 | 107.9 | 863 | 840 | 165.1 |
| B | 12 | 111 | 18483 | 106.88 | 863 | 840 | 165.1 |
| C | 14 | 238 | 128686 | 666.35 | 830 | 835 | 191.9 |
| C | 3 | 233 | 10445 | 50.09 | 830 | 835 | 191.9 |
| C | 13 | 61 | 5859 | 26.18 | 830 | 835 | 191.9 |
| D | 7 | 238 | 1208478 | 5935.05 | 839 | 817 | 203.5 |
| D | 13 | 168 | 467404 | 2293.04 | 839 | 817 | 203.5 |
| D | 1 | 52 | 329142 | 1613.55 | 839 | 817 | 203.5 |
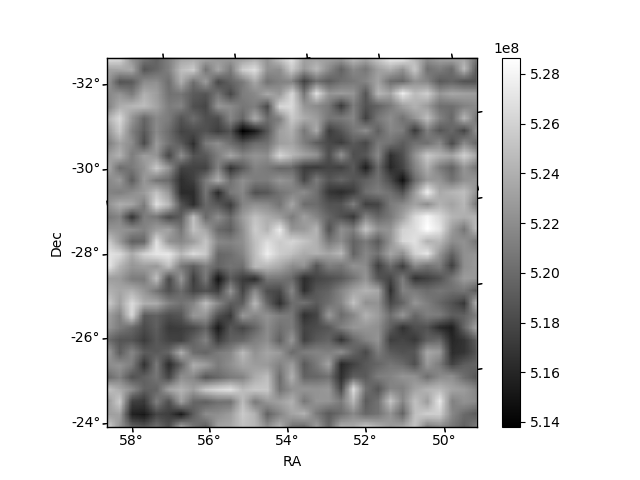
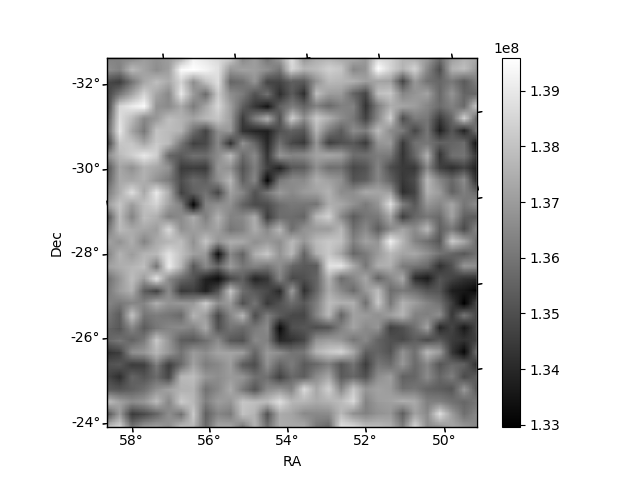
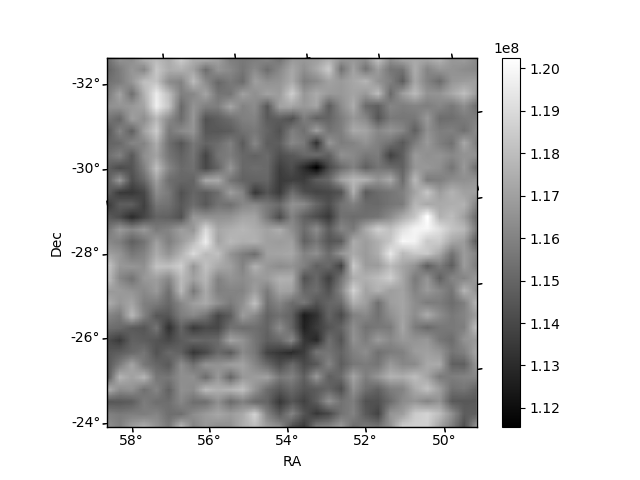
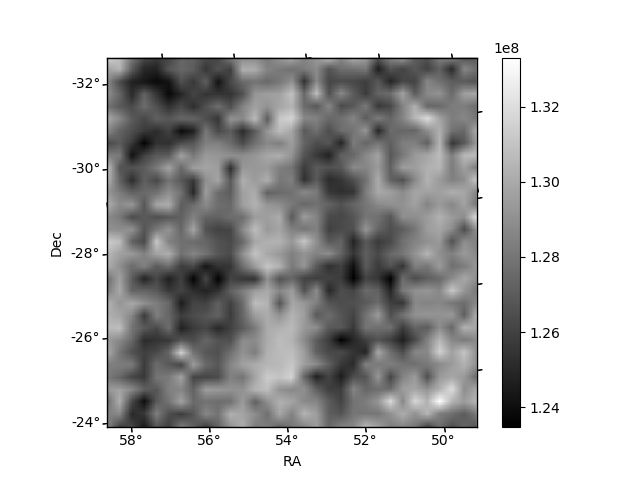
Histogram calculated using DETX and DETY for each event in the final _common_clean file
| Quadrant A | 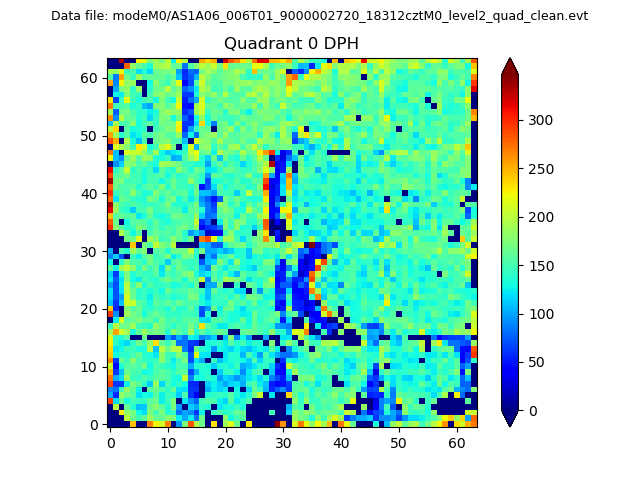 |
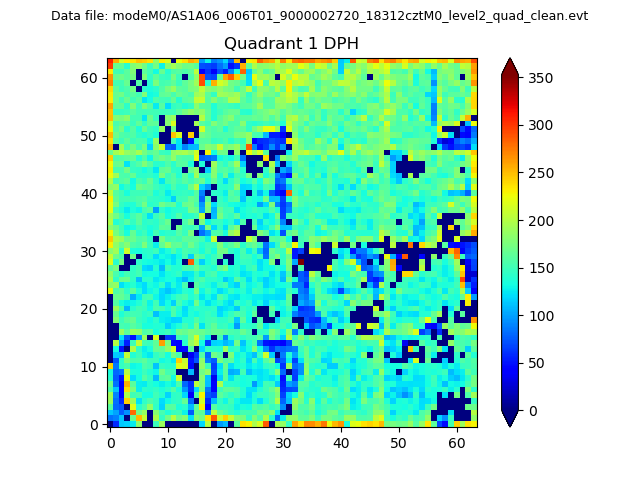 |
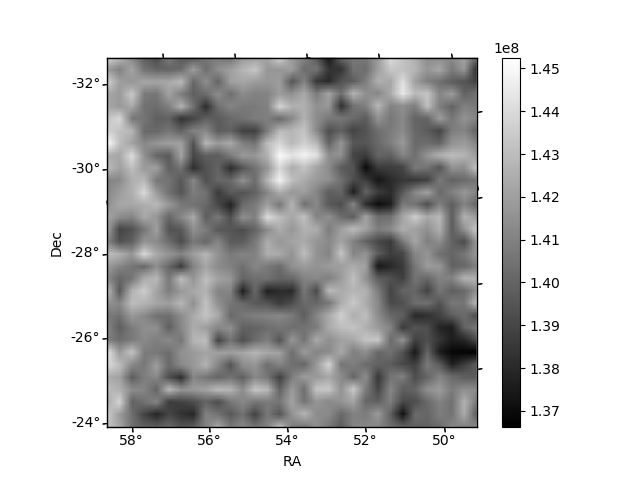
Quadrant B |
|---|---|---|---|
| Quadrant D | 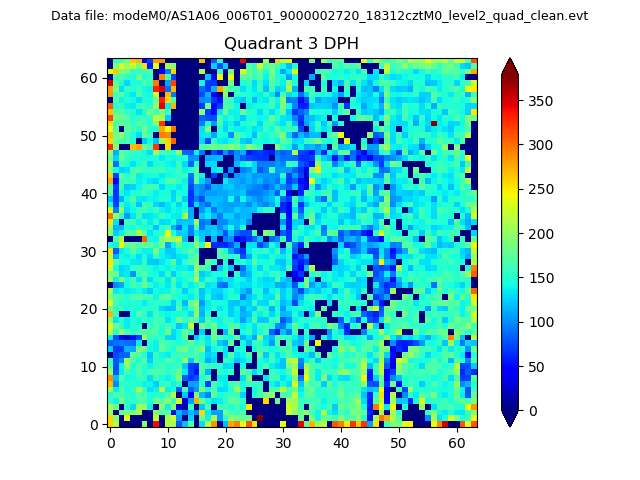 |
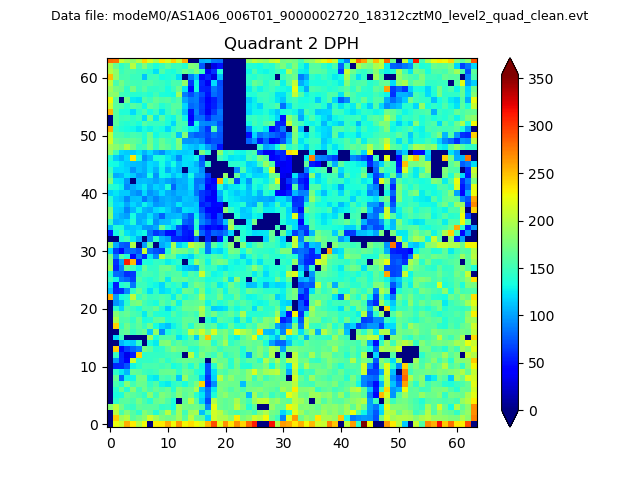 |
Quadrant C |
| Plot type | Count rate plots | Images |
|---|---|---|
| Comparison with Poisson distribution Blue bars denote a histogram of data divided into 1 sec bins. Red curve is a Poisson curve with rate = median count rate of data. |
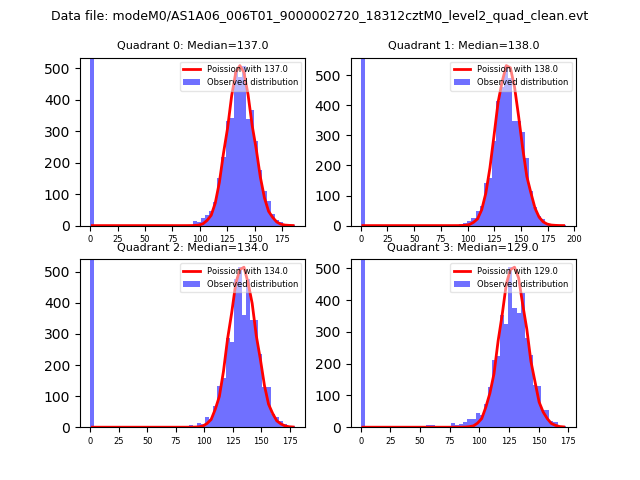 |
 |
| Quadrant-wise count rates Data is divided into 100 sec bins |
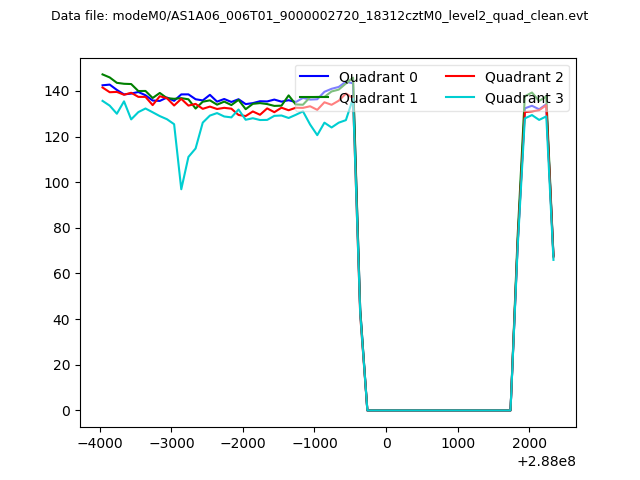 |
|
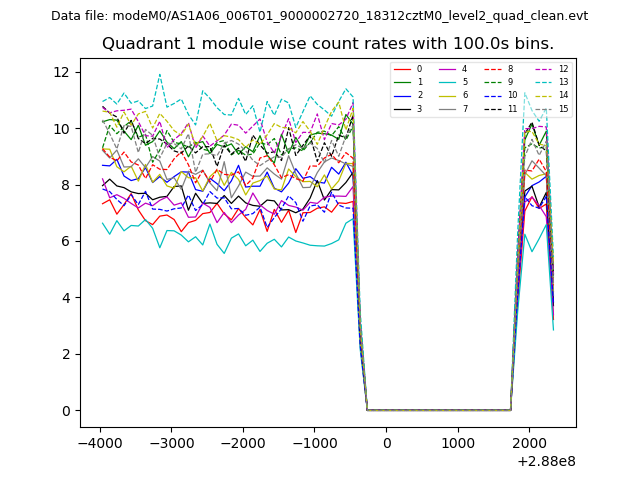
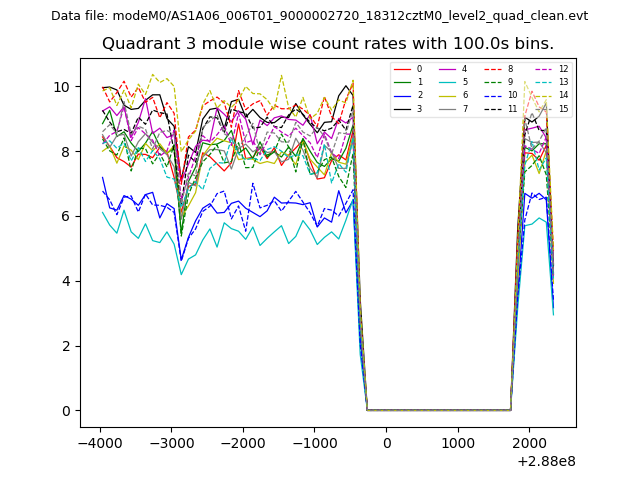
| Module-wise count rates for Quadrant A Data is divided into 100 sec bins |
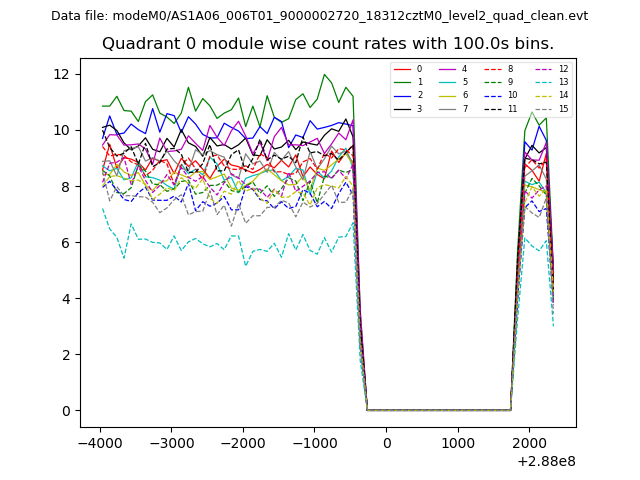 |
 |
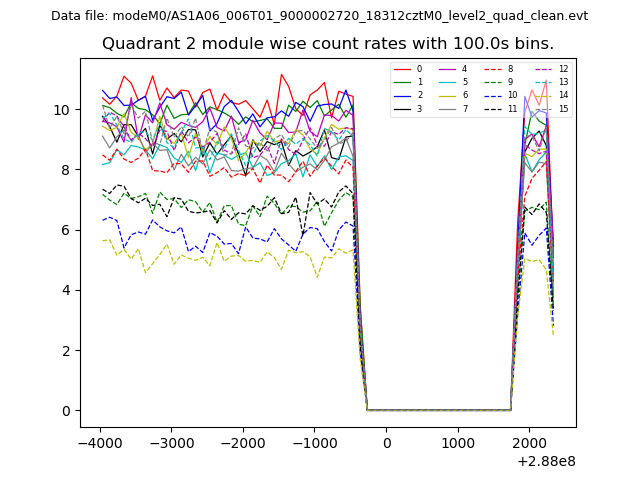
| Module-wise count rates for Quadrant B Data is divided into 100 sec bins |
 |
 |
| Module-wise count rates for Quadrant C Data is divided into 100 sec bins |
 |
 |
| Module-wise count rates for Quadrant D Data is divided into 100 sec bins |
 |
 |
| Parameter | Plot |
|---|---|
| CZT HV Monitor | 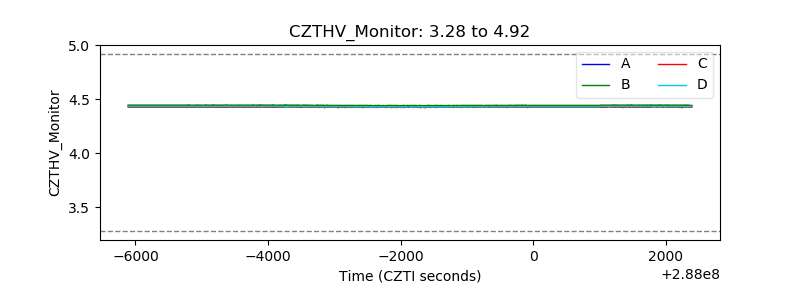 |
| D_VDD | 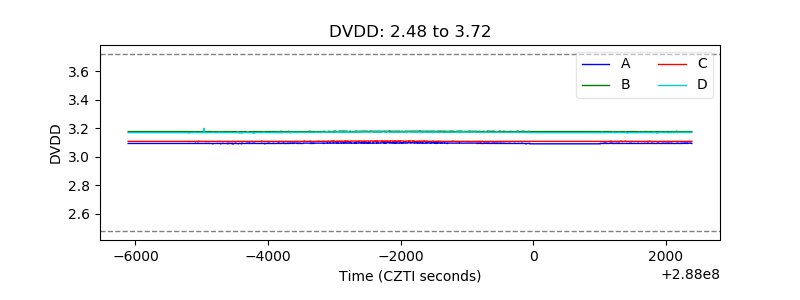 |
| Temperature 1 | 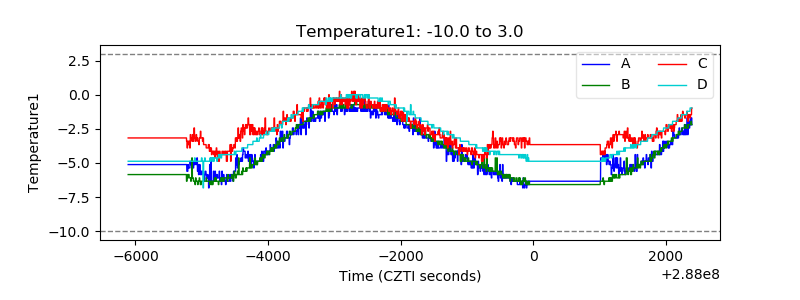 |
| Veto HV Monitor | 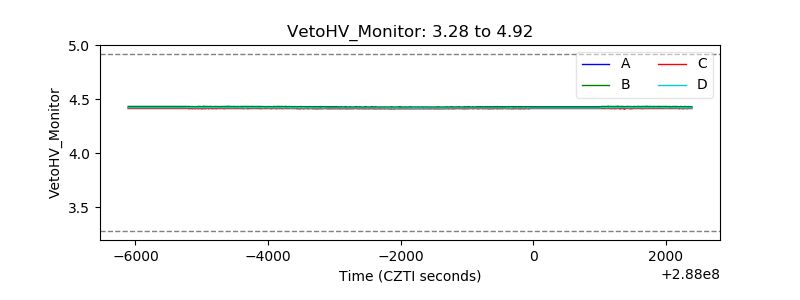 |
| Veto LLD | 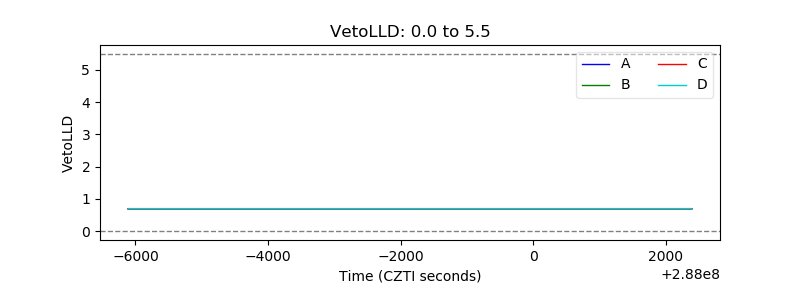 |
| Alpha Counter | 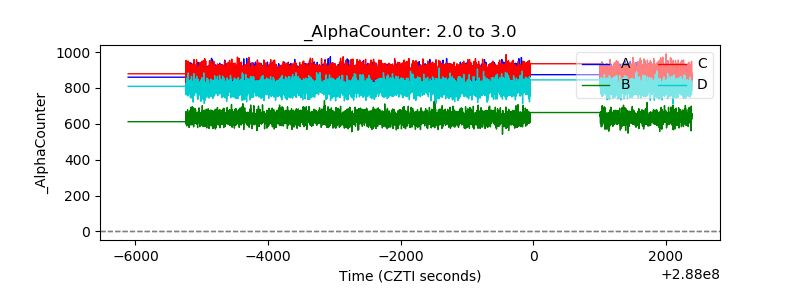 |
| _CPM_Rate | 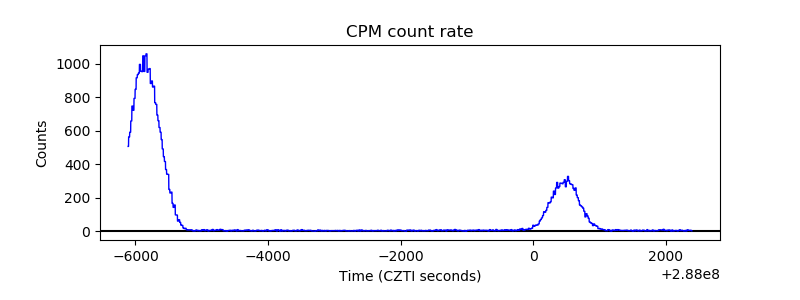 |
| CZT Counter | 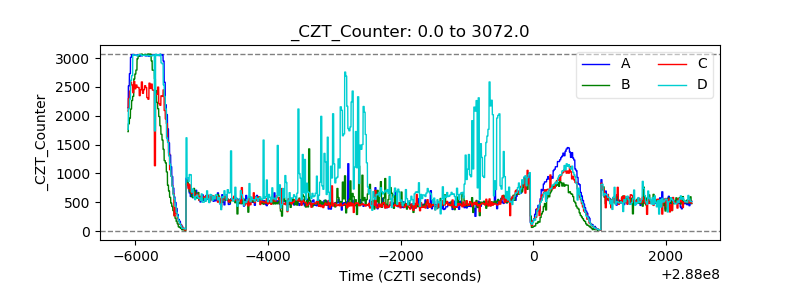 |
| +2.5 Volts monitor |  |
| +5 Volts monitor |  |
| _ROLL_ROT | 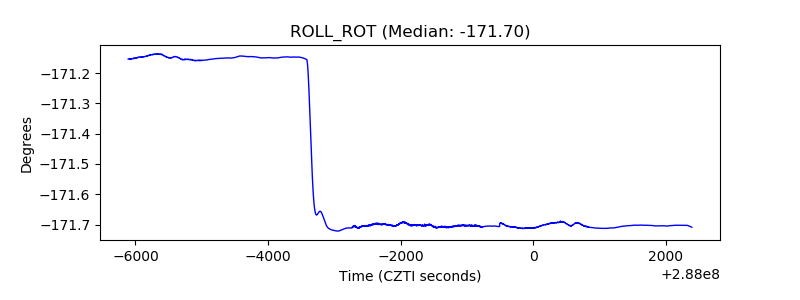 |
| _Roll_DEC | 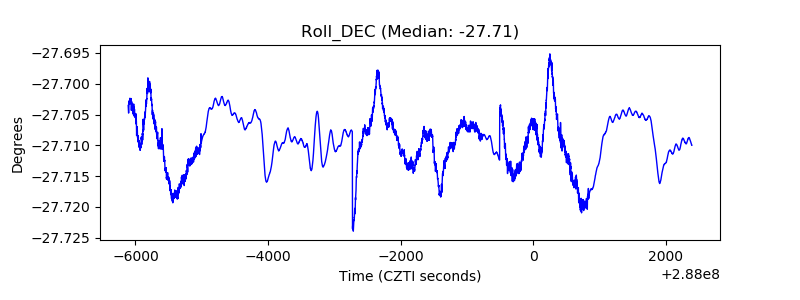 |
| _Roll_RA | 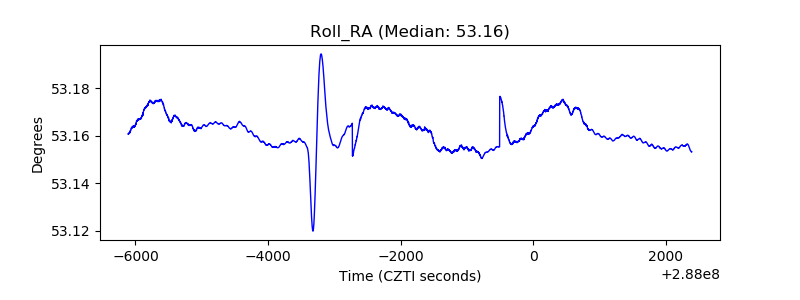 |
| Veto Counter | 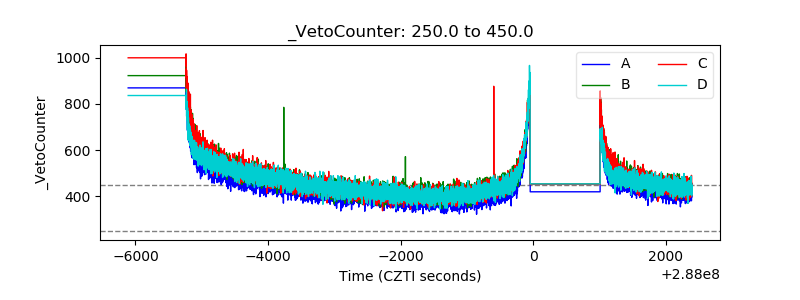 |