| Param | Original file | Final file |
|---|---|---|
| Filename | modeM0/AS1A06_006T01_9000002720_18313cztM0_level2.evt | modeM0/AS1A06_006T01_9000002720_18313cztM0_level2_quad_clean.evt |
| Size (bytes) | 1,733,817,600 | 305,170,560 |
| Size | 1.6 GB | 291.0 MB |
| Events in quadrant A | 10,885,726 | 1,973,525 |
| Events in quadrant B | 11,802,925 | 1,980,825 |
| Events in quadrant C | 11,013,146 | 1,941,663 |
| Events in quadrant D | 17,352,377 | 1,862,164 |
| Mode SS | |||
|---|---|---|---|
| Quadrant | BADHDUFLAG | Total packets | Discarded packets |
| A | 0 | 436 | 0 |
| B | 0 | 436 | 0 |
| C | 0 | 436 | 0 |
| D | 0 | 436 | 0 |
| Mode M9 | |||
|---|---|---|---|
| Quadrant | BADHDUFLAG | Total packets | Discarded packets |
| A | 0 | 45 | 0 |
| B | 0 | 45 | 0 |
| C | 0 | 45 | 0 |
| D | 0 | 45 | 0 |
| Mode M0 | |||
|---|---|---|---|
| Quadrant | BADHDUFLAG | Total packets | Discarded packets |
| A | 0 | 45154 | 4 |
| B | 0 | 47744 | 4 |
| C | 0 | 45654 | 4 |
| D | 0 | 66063 | 4 |
| Quadrant | Total seconds | Saturated seconds | Saturation percentage |
|---|---|---|---|
| A | 21581 | 391 | 1.811779% |
| B | 21582 | 543 | 2.515986% |
| C | 21582 | 514 | 2.381614% |
| D | 21582 | 1184 | 5.486053% |
Noise dominated data is calculated using 1-second bins in cleaned event files. If a bin has >2000 counts, and if more than 50% of those come from <1% of pixels, then it is considered to be noise-dominated and hence unusable.
| Quadrant | # 1 sec bins | Bins with >0 counts | Bins with >2000 counts | High rate bins dominated by noise | Noise dominated (total time) | Noise dominated (detector-on time) | Marked lightcurve |
|---|---|---|---|---|---|---|---|
| A | 25936 | 21585 | 0 | 0 | 0.00% | 0.00% | 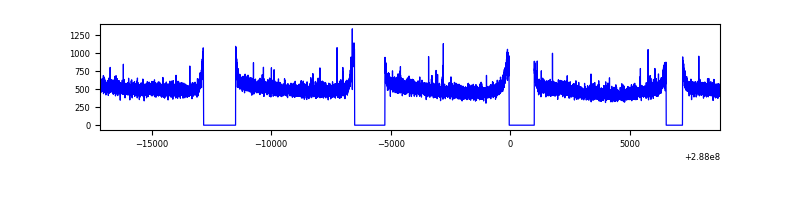 |
| B | 25937 | 21586 | 71 | 71 | 0.27% | 0.33% | 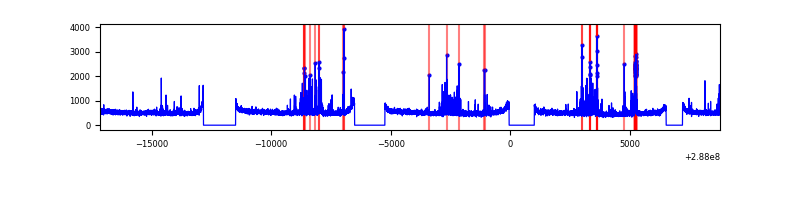 |
| C | 25937 | 21586 | 1 | 1 | 0.00% | 0.00% | 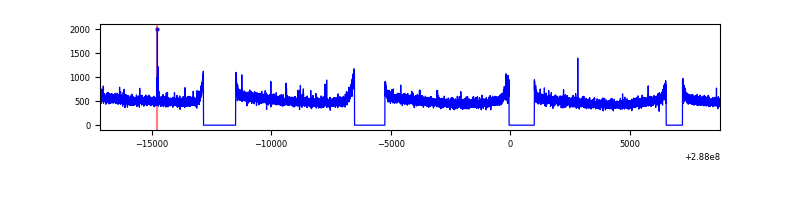 |
| D | 25937 | 21586 | 880 | 880 | 3.39% | 4.08% | 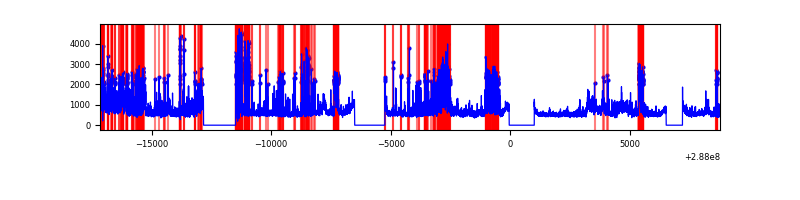 |
Top three noisy pixels from each quadrant. If the there are fewer than three noisy pixels in the level2.evt file, extra rows are filled as -1
| Pixel properties | Quadrant properties | ||||||
|---|---|---|---|---|---|---|---|
| Quadrant | DetID | PixID | Counts | Sigma | Mean | Median | Sigma |
| A | 0 | 226 | 25132 | 39.65 | 2828 | 2771 | 564.0 |
| A | 12 | 194 | 20882 | 32.11 | 2828 | 2771 | 564.0 |
| A | 3 | 137 | 19899 | 30.37 | 2828 | 2771 | 564.0 |
| B | 7 | 220 | 462016 | 870.54 | 2807 | 2743 | 527.6 |
| B | 12 | 18 | 104517 | 192.91 | 2807 | 2743 | 527.6 |
| B | 0 | 197 | 84342 | 154.67 | 2807 | 2743 | 527.6 |
| C | 14 | 238 | 419258 | 667.39 | 2705 | 2728 | 624.1 |
| C | 3 | 233 | 39690 | 59.22 | 2705 | 2728 | 624.1 |
| C | 0 | 207 | 21901 | 30.72 | 2705 | 2728 | 624.1 |
| D | 7 | 238 | 3163785 | 4810.16 | 2718 | 2646 | 657.2 |
| D | 1 | 52 | 1847938 | 2807.89 | 2718 | 2646 | 657.2 |
| D | 13 | 168 | 1633537 | 2481.65 | 2718 | 2646 | 657.2 |
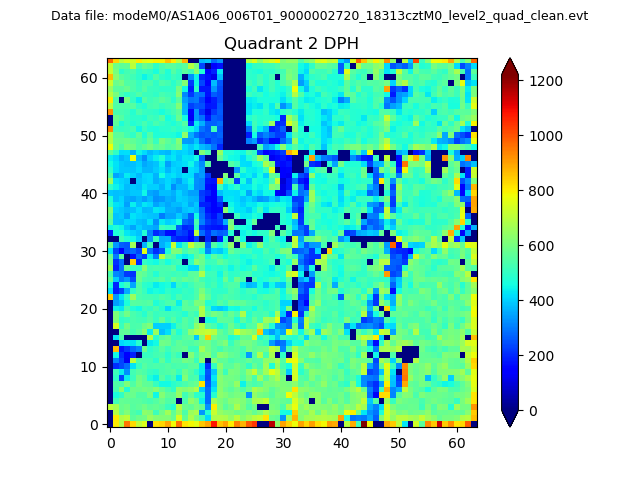
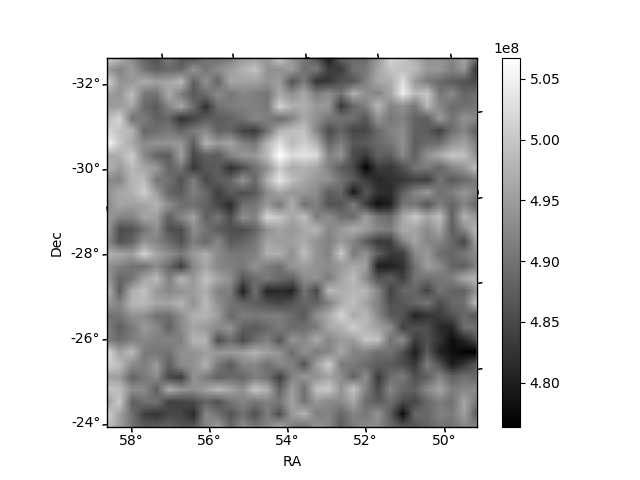
Histogram calculated using DETX and DETY for each event in the final _common_clean file
| Quadrant A | 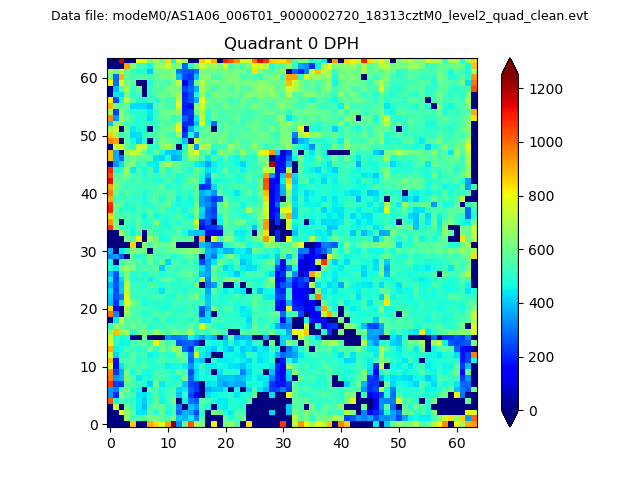 |
 |
Quadrant B |
|---|---|---|---|
| Quadrant D |  |
 |
Quadrant C |
| Plot type | Count rate plots | Images |
|---|---|---|
| Comparison with Poisson distribution Blue bars denote a histogram of data divided into 1 sec bins. Red curve is a Poisson curve with rate = median count rate of data. |
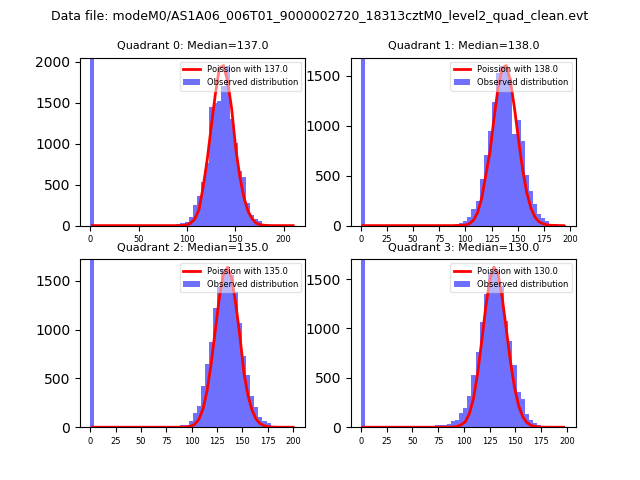 |
 |
| Quadrant-wise count rates Data is divided into 100 sec bins |
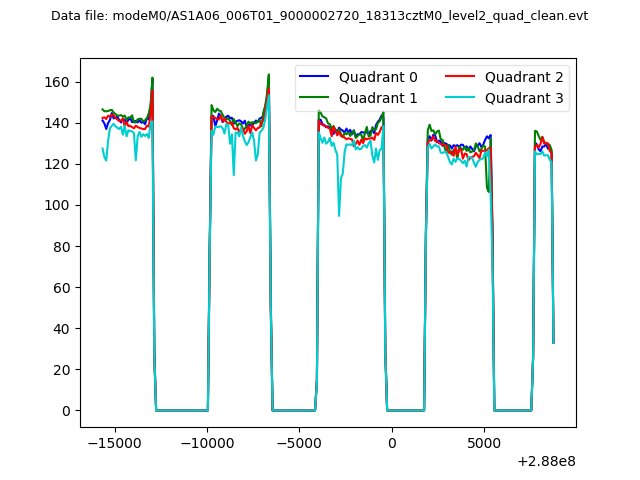 |
|
| Module-wise count rates for Quadrant A Data is divided into 100 sec bins |
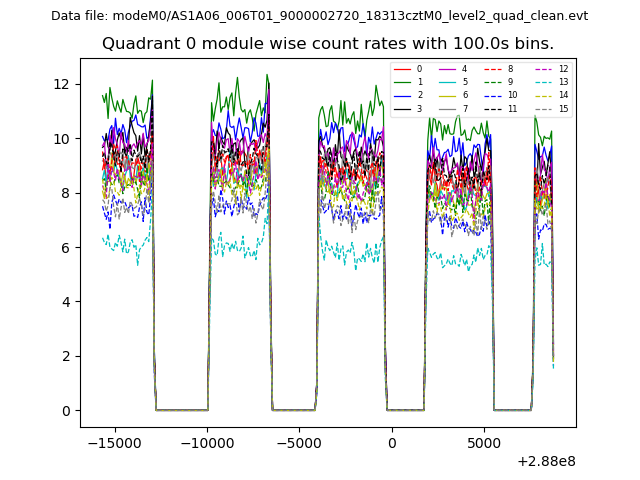 |
 |
| Module-wise count rates for Quadrant B Data is divided into 100 sec bins |
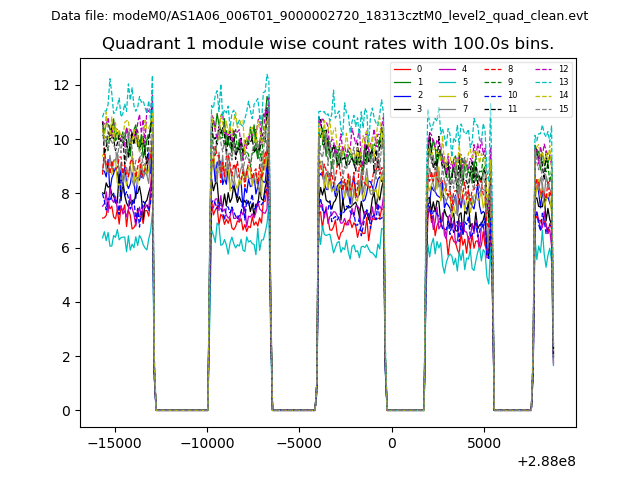 |
 |
| Module-wise count rates for Quadrant C Data is divided into 100 sec bins |
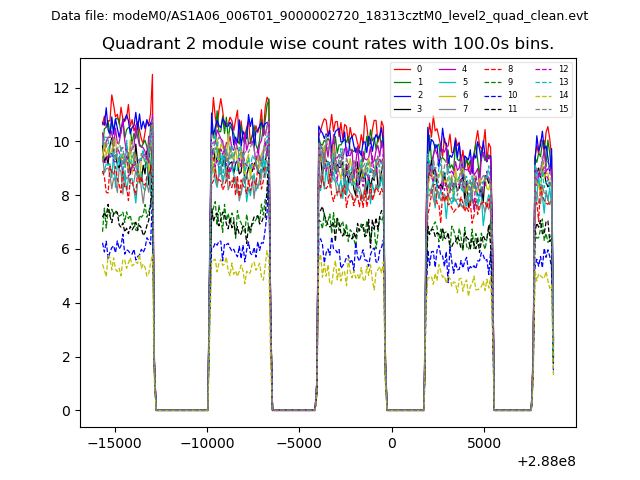 |
 |
| Module-wise count rates for Quadrant D Data is divided into 100 sec bins |
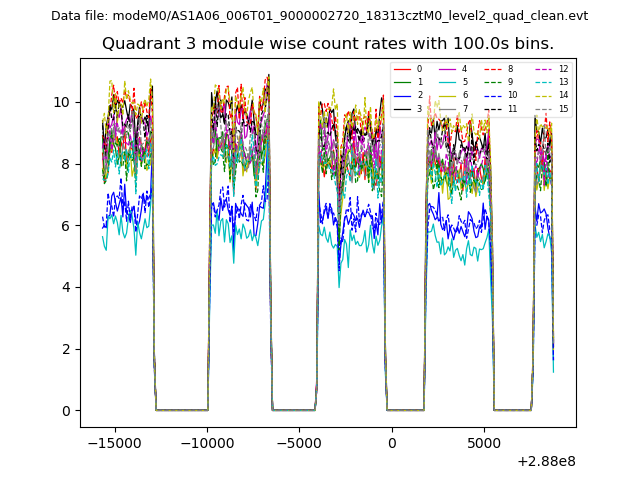 |
 |
| Parameter | Plot |
|---|---|
| CZT HV Monitor | 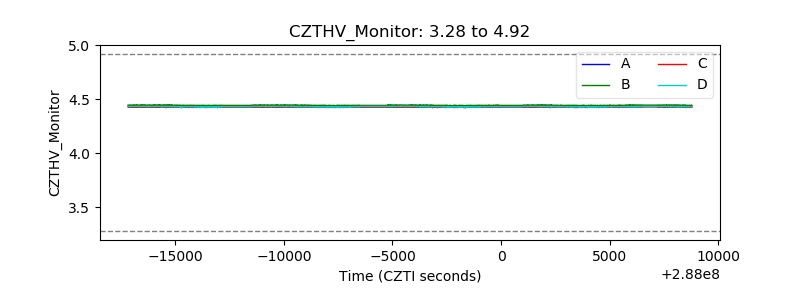 |
| D_VDD | 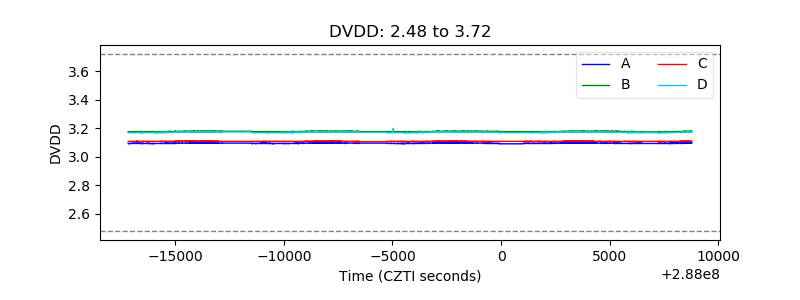 |
| Temperature 1 | 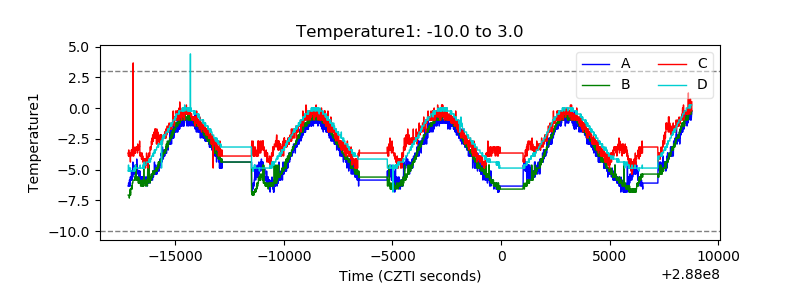 |
| Veto HV Monitor | 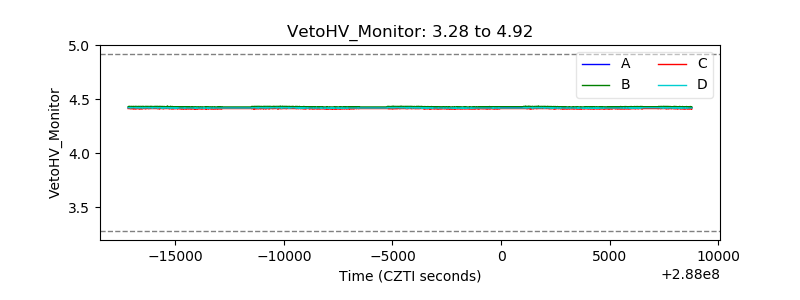 |
| Veto LLD | 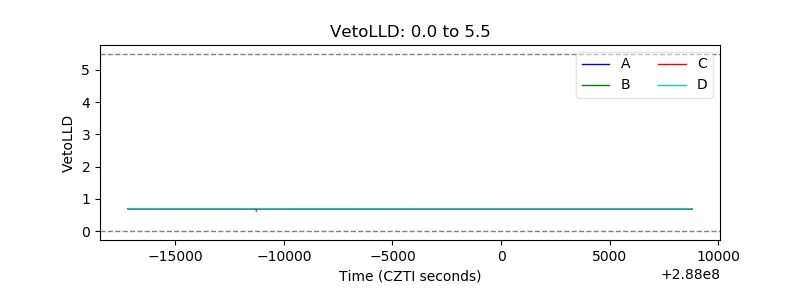 |
| Alpha Counter | 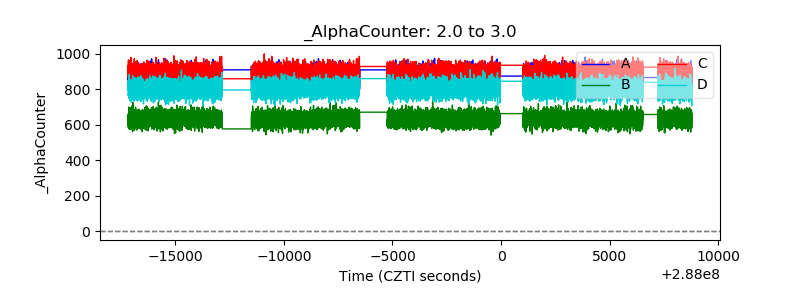 |
| _CPM_Rate | 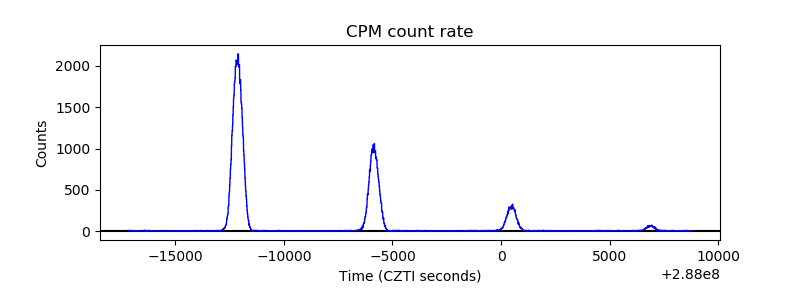 |
| CZT Counter | 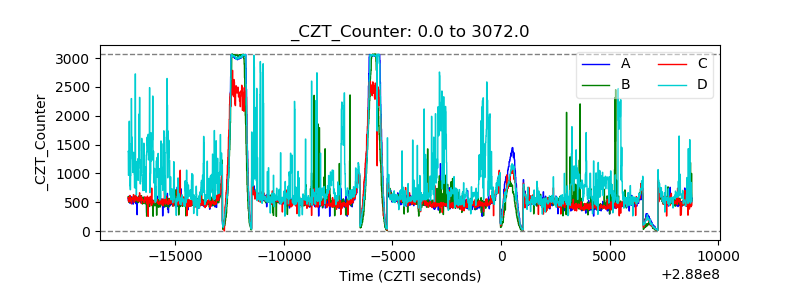 |
| +2.5 Volts monitor |  |
| +5 Volts monitor |  |
| _ROLL_ROT | 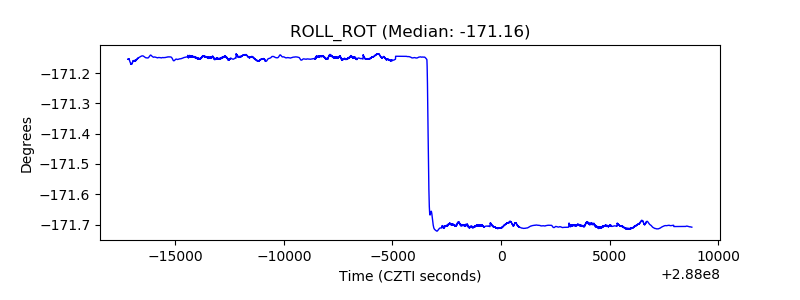 |
| _Roll_DEC | 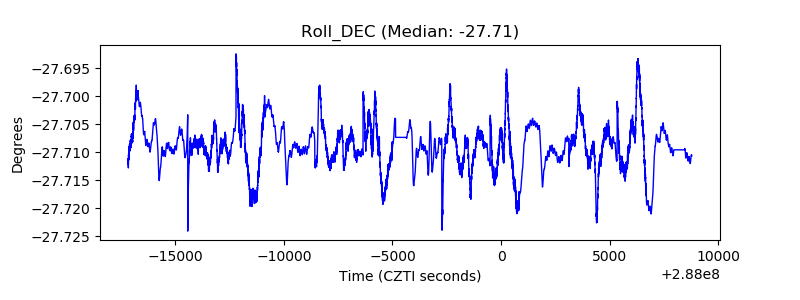 |
| _Roll_RA | 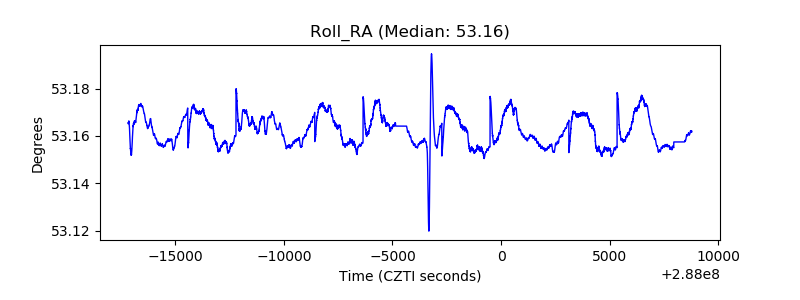 |
| Veto Counter | 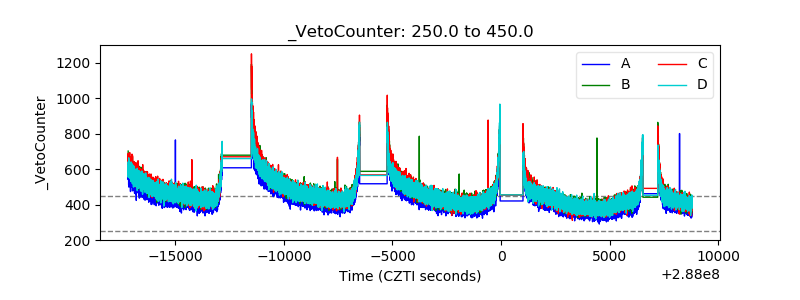 |