| Param | Original file | Final file |
|---|---|---|
| Filename | modeM0/AS1A06_006T01_9000002720_18316cztM0_level2.evt | modeM0/AS1A06_006T01_9000002720_18316cztM0_level2_quad_clean.evt |
| Size (bytes) | 405,864,000 | 61,966,080 |
| Size | 387.1 MB | 59.1 MB |
| Events in quadrant A | 2,481,493 | 384,919 |
| Events in quadrant B | 2,631,803 | 385,354 |
| Events in quadrant C | 2,475,126 | 376,945 |
| Events in quadrant D | 4,338,720 | 353,415 |
| Mode SS | |||
|---|---|---|---|
| Quadrant | BADHDUFLAG | Total packets | Discarded packets |
| A | 0 | 108 | 0 |
| B | 0 | 108 | 0 |
| C | 0 | 108 | 0 |
| D | 0 | 108 | 0 |
| Mode M9 | |||
|---|---|---|---|
| Quadrant | BADHDUFLAG | Total packets | Discarded packets |
| A | 0 | 5 | 0 |
| B | 0 | 5 | 0 |
| C | 0 | 5 | 0 |
| D | 0 | 5 | 0 |
| Mode M0 | |||
|---|---|---|---|
| Quadrant | BADHDUFLAG | Total packets | Discarded packets |
| A | 0 | 10994 | 0 |
| B | 0 | 11260 | 0 |
| C | 0 | 10956 | 2 |
| D | 0 | 16360 | 0 |
| Quadrant | Total seconds | Saturated seconds | Saturation percentage |
|---|---|---|---|
| A | 5366 | 19 | 0.354081% |
| B | 5367 | 34 | 0.633501% |
| C | 5366 | 38 | 0.708163% |
| D | 5366 | 230 | 4.286247% |
Noise dominated data is calculated using 1-second bins in cleaned event files. If a bin has >2000 counts, and if more than 50% of those come from <1% of pixels, then it is considered to be noise-dominated and hence unusable.
| Quadrant | # 1 sec bins | Bins with >0 counts | Bins with >2000 counts | High rate bins dominated by noise | Noise dominated (total time) | Noise dominated (detector-on time) | Marked lightcurve |
|---|---|---|---|---|---|---|---|
| A | 5831 | 5367 | 1 | 1 | 0.02% | 0.02% | 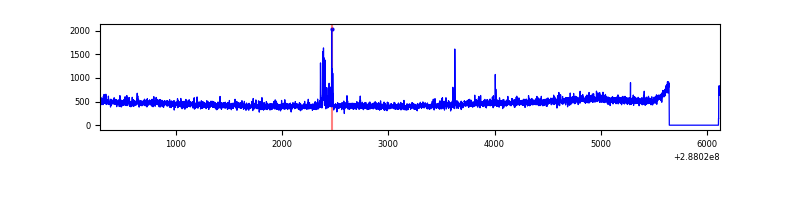 |
| B | 5832 | 5368 | 5 | 5 | 0.09% | 0.09% | 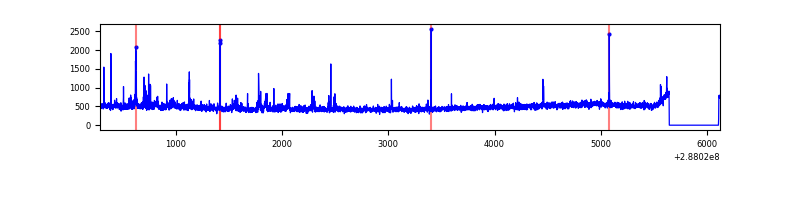 |
| C | 5832 | 5368 | 0 | 0 | 0.00% | 0.00% |  |
| D | 5832 | 5368 | 258 | 258 | 4.42% | 4.81% | 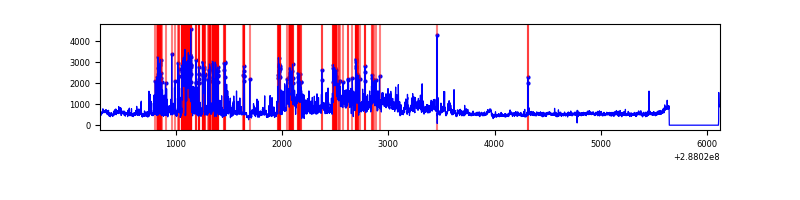 |
Top three noisy pixels from each quadrant. If the there are fewer than three noisy pixels in the level2.evt file, extra rows are filled as -1
| Pixel properties | Quadrant properties | ||||||
|---|---|---|---|---|---|---|---|
| Quadrant | DetID | PixID | Counts | Sigma | Mean | Median | Sigma |
| A | 15 | 174 | 37166 | 277.86 | 636 | 622 | 131.5 |
| A | 0 | 226 | 5553 | 37.49 | 636 | 622 | 131.5 |
| A | 3 | 137 | 4728 | 31.22 | 636 | 622 | 131.5 |
| B | 15 | 35 | 49159 | 393.16 | 636 | 620 | 123.5 |
| B | 4 | 216 | 28740 | 227.77 | 636 | 620 | 123.5 |
| B | 7 | 220 | 23108 | 182.15 | 636 | 620 | 123.5 |
| C | 14 | 238 | 93041 | 640.4 | 609 | 614 | 144.3 |
| C | 0 | 207 | 5299 | 32.46 | 609 | 614 | 144.3 |
| C | 13 | 61 | 4311 | 25.62 | 609 | 614 | 144.3 |
| D | 7 | 238 | 1511069 | 9990.07 | 608 | 587 | 151.2 |
| D | 13 | 168 | 310786 | 2051.6 | 608 | 587 | 151.2 |
| D | 1 | 52 | 72637 | 476.53 | 608 | 587 | 151.2 |
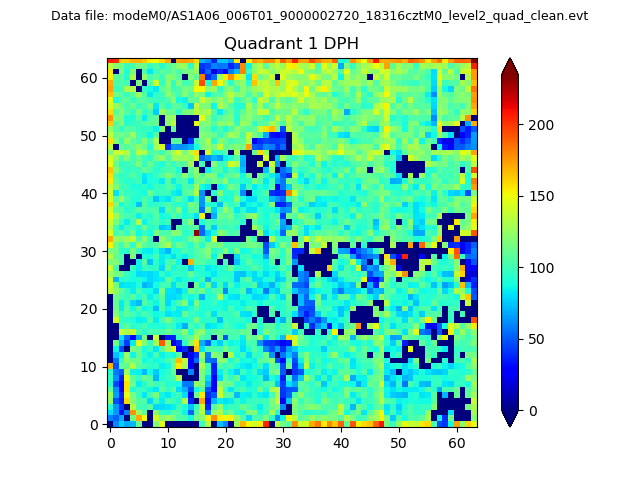
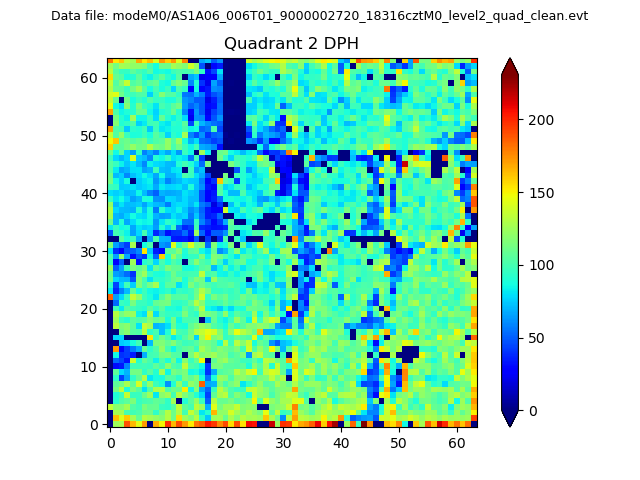
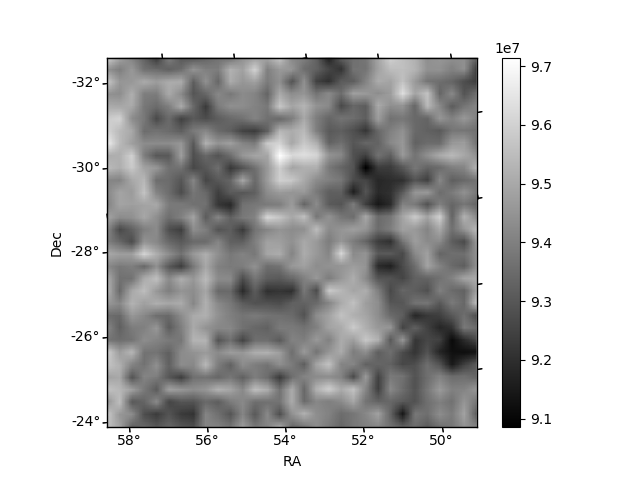
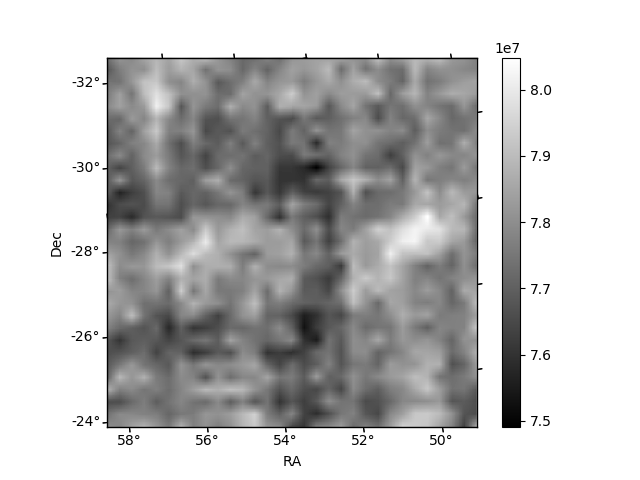
Histogram calculated using DETX and DETY for each event in the final _common_clean file
| Quadrant A |  |
 |
Quadrant B |
|---|---|---|---|
| Quadrant D |  |
 |
Quadrant C |
| Plot type | Count rate plots | Images |
|---|---|---|
| Comparison with Poisson distribution Blue bars denote a histogram of data divided into 1 sec bins. Red curve is a Poisson curve with rate = median count rate of data. |
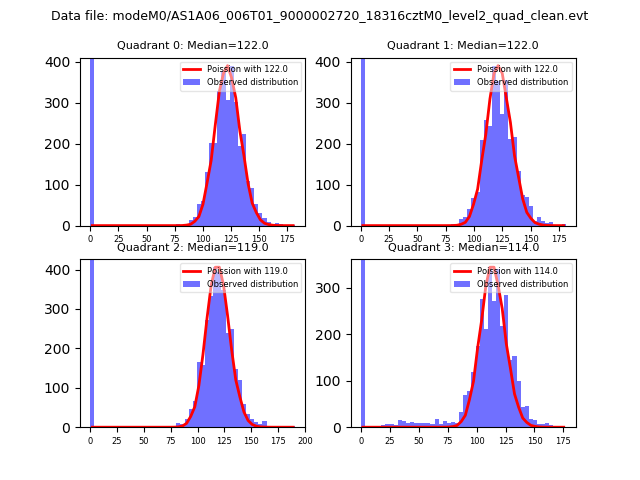 |
 |
| Quadrant-wise count rates Data is divided into 100 sec bins |
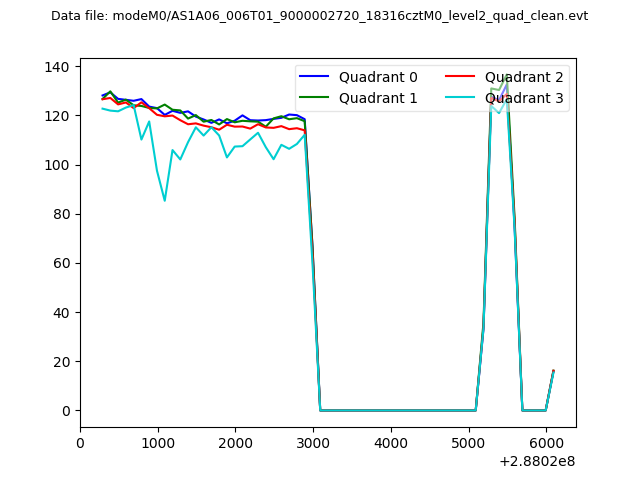 |
|
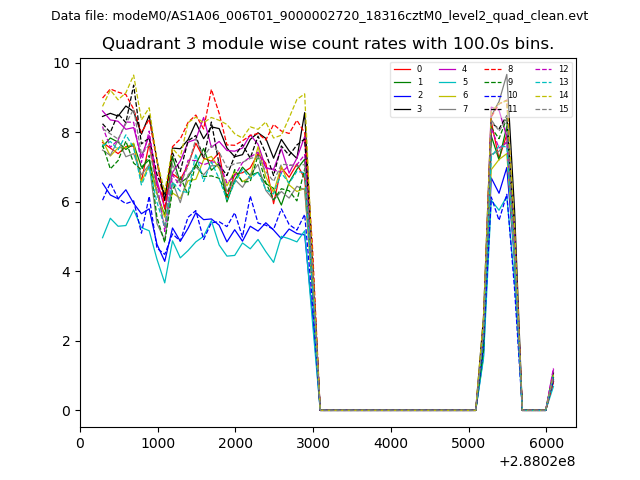
| Module-wise count rates for Quadrant A Data is divided into 100 sec bins |
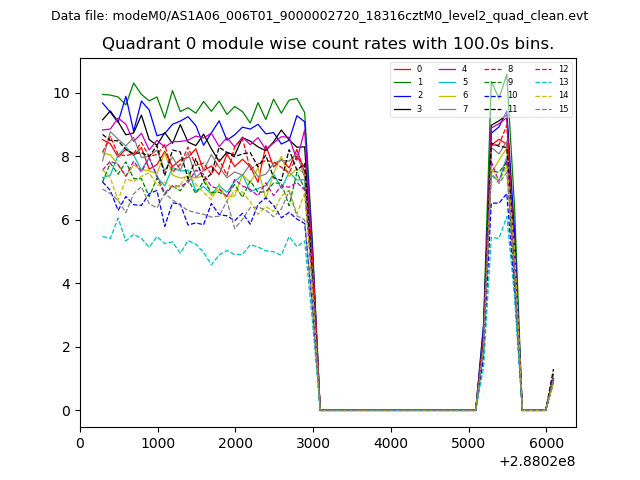 |
 |
| Module-wise count rates for Quadrant B Data is divided into 100 sec bins |
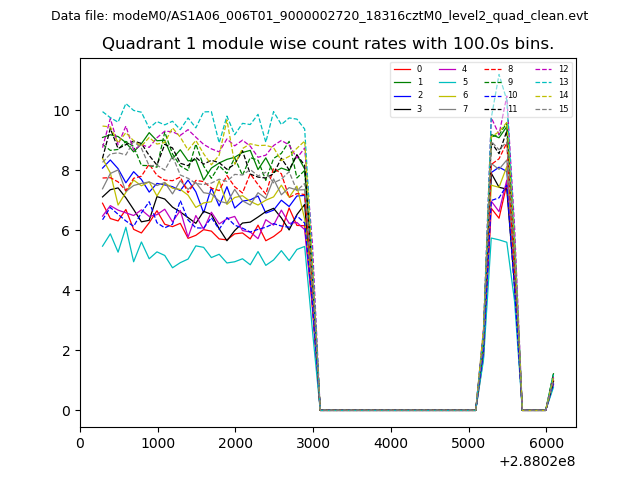 |
 |
| Module-wise count rates for Quadrant C Data is divided into 100 sec bins |
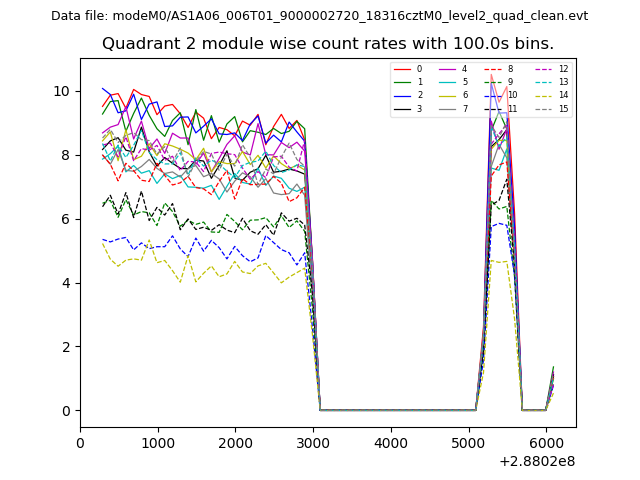 |
 |
| Module-wise count rates for Quadrant D Data is divided into 100 sec bins |
 |
 |
| Parameter | Plot |
|---|---|
| CZT HV Monitor | 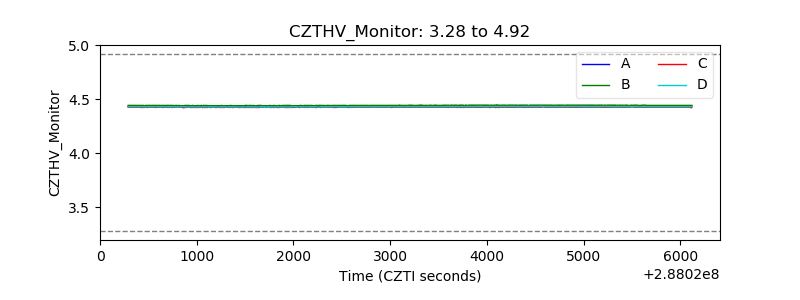 |
| D_VDD | 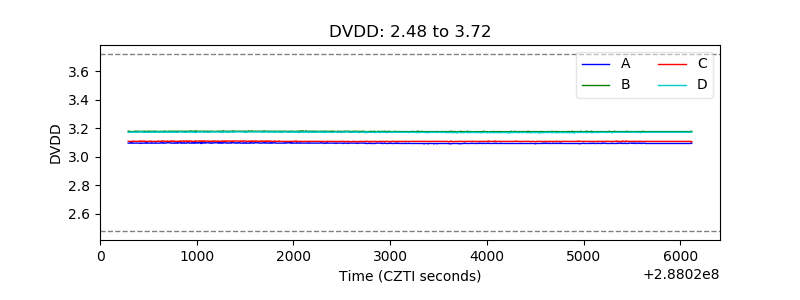 |
| Temperature 1 | 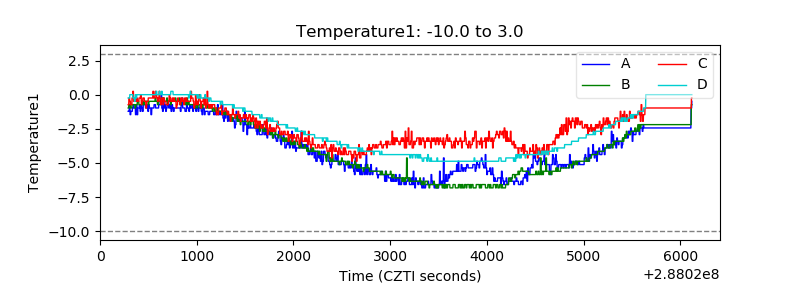 |
| Veto HV Monitor | 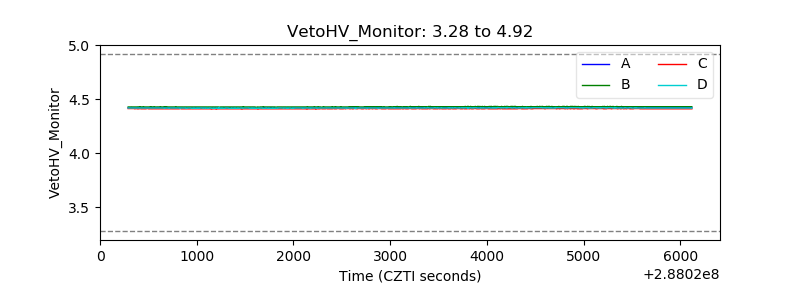 |
| Veto LLD | 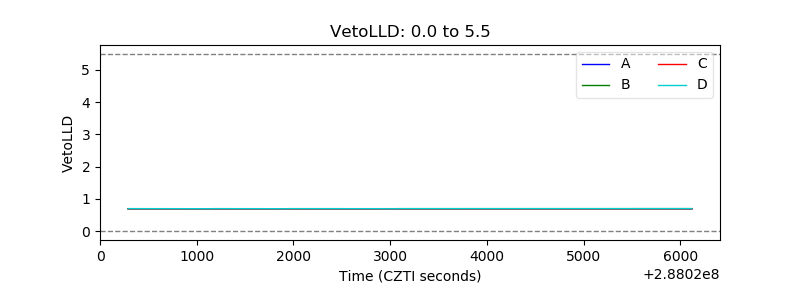 |
| Alpha Counter | 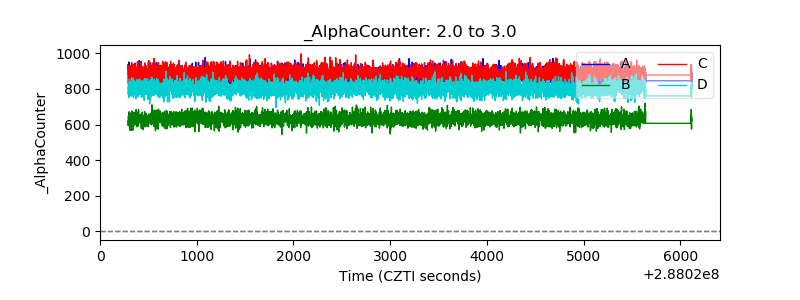 |
| _CPM_Rate | 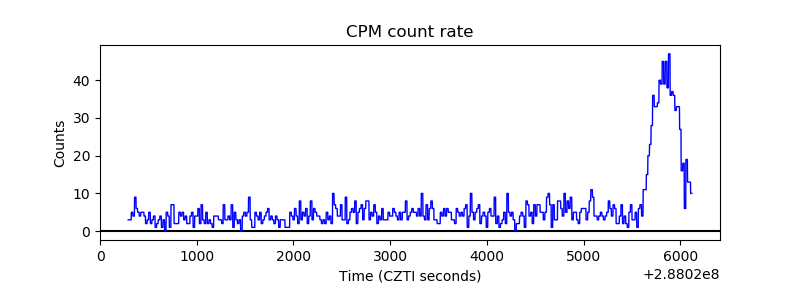 |
| CZT Counter |  |
| +2.5 Volts monitor |  |
| +5 Volts monitor |  |
| _ROLL_ROT | 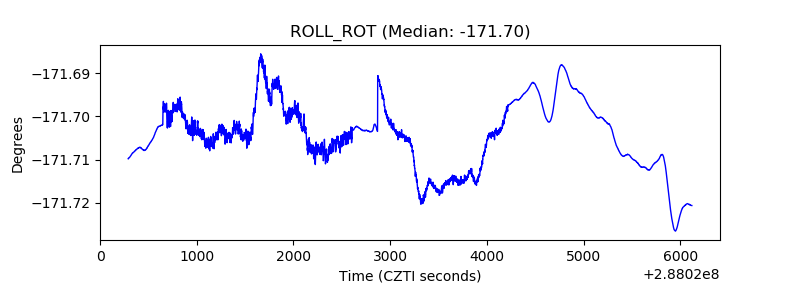 |
| _Roll_DEC | 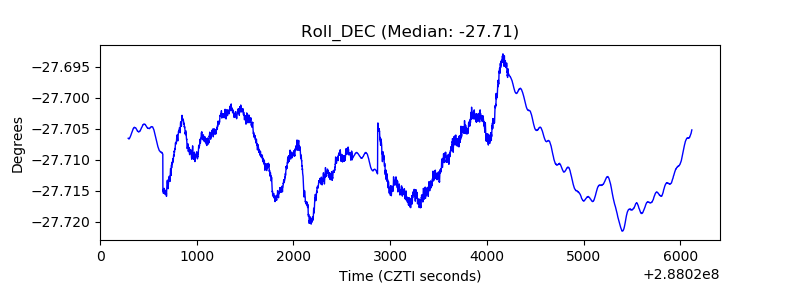 |
| _Roll_RA |  |
| Veto Counter | 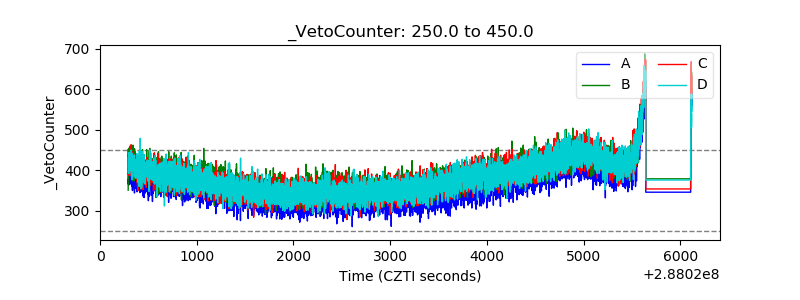 |