| Param | Original file | Final file |
|---|---|---|
| Filename | modeM0/AS1A06_006T01_9000002720_18318cztM0_level2.evt | modeM0/AS1A06_006T01_9000002720_18318cztM0_level2_quad_clean.evt |
| Size (bytes) | 935,873,280 | 162,587,520 |
| Size | 892.5 MB | 155.1 MB |
| Events in quadrant A | 5,878,574 | 1,036,584 |
| Events in quadrant B | 6,399,047 | 1,035,335 |
| Events in quadrant C | 5,959,691 | 1,013,825 |
| Events in quadrant D | 9,245,126 | 958,906 |
| Mode SS | |||
|---|---|---|---|
| Quadrant | BADHDUFLAG | Total packets | Discarded packets |
| A | 0 | 256 | 0 |
| B | 0 | 256 | 0 |
| C | 0 | 256 | 0 |
| D | 0 | 256 | 0 |
| Mode M9 | |||
|---|---|---|---|
| Quadrant | BADHDUFLAG | Total packets | Discarded packets |
| A | 0 | 15 | 0 |
| B | 0 | 16 | 0 |
| C | 0 | 16 | 0 |
| D | 0 | 16 | 0 |
| Mode M0 | |||
|---|---|---|---|
| Quadrant | BADHDUFLAG | Total packets | Discarded packets |
| A | 0 | 26046 | 3 |
| B | 0 | 27298 | 3 |
| C | 0 | 26110 | 3 |
| D | 0 | 35845 | 3 |
| Quadrant | Total seconds | Saturated seconds | Saturation percentage |
|---|---|---|---|
| A | 12731 | 51 | 0.400597% |
| B | 12731 | 108 | 0.848323% |
| C | 12731 | 91 | 0.714791% |
| D | 12731 | 602 | 4.728615% |
Noise dominated data is calculated using 1-second bins in cleaned event files. If a bin has >2000 counts, and if more than 50% of those come from <1% of pixels, then it is considered to be noise-dominated and hence unusable.
| Quadrant | # 1 sec bins | Bins with >0 counts | Bins with >2000 counts | High rate bins dominated by noise | Noise dominated (total time) | Noise dominated (detector-on time) | Marked lightcurve |
|---|---|---|---|---|---|---|---|
| A | 14066 | 12733 | 0 | 0 | 0.00% | 0.00% | 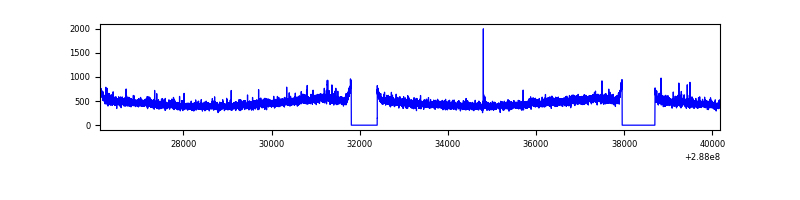 |
| B | 14066 | 12733 | 16 | 16 | 0.11% | 0.13% | 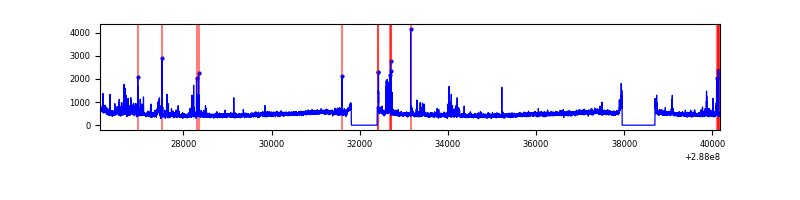 |
| C | 14066 | 12733 | 3 | 3 | 0.02% | 0.02% | 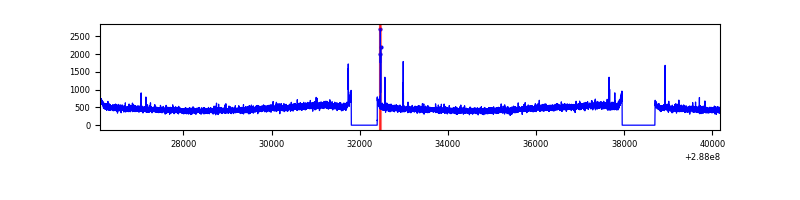 |
| D | 14066 | 12733 | 578 | 578 | 4.11% | 4.54% | 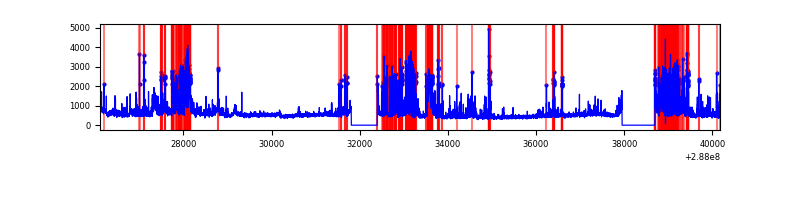 |
Top three noisy pixels from each quadrant. If the there are fewer than three noisy pixels in the level2.evt file, extra rows are filled as -1
| Pixel properties | Quadrant properties | ||||||
|---|---|---|---|---|---|---|---|
| Quadrant | DetID | PixID | Counts | Sigma | Mean | Median | Sigma |
| A | 15 | 174 | 30686 | 94.12 | 1521 | 1485 | 310.3 |
| A | 0 | 226 | 13565 | 38.93 | 1521 | 1485 | 310.3 |
| A | 12 | 194 | 11248 | 31.47 | 1521 | 1485 | 310.3 |
| B | 7 | 220 | 132845 | 451.84 | 1519 | 1481 | 290.7 |
| B | 0 | 197 | 80800 | 272.82 | 1519 | 1481 | 290.7 |
| B | 5 | 172 | 78573 | 265.16 | 1519 | 1481 | 290.7 |
| C | 14 | 238 | 222636 | 648.72 | 1454 | 1467 | 340.9 |
| C | 0 | 207 | 34000 | 95.42 | 1454 | 1467 | 340.9 |
| C | 3 | 233 | 21536 | 58.87 | 1454 | 1467 | 340.9 |
| D | 7 | 238 | 1753435 | 4946.29 | 1450 | 1410 | 354.2 |
| D | 13 | 168 | 618630 | 1742.53 | 1450 | 1410 | 354.2 |
| D | 7 | 38 | 536503 | 1510.67 | 1450 | 1410 | 354.2 |
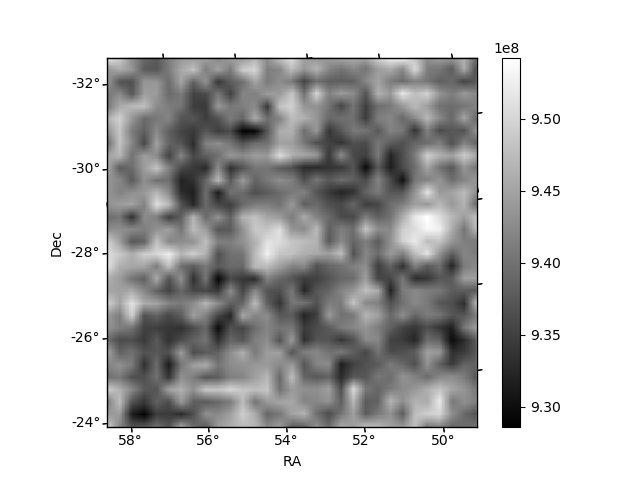
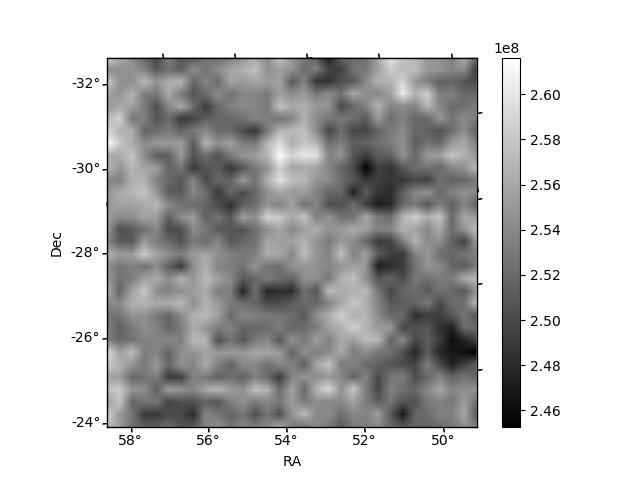
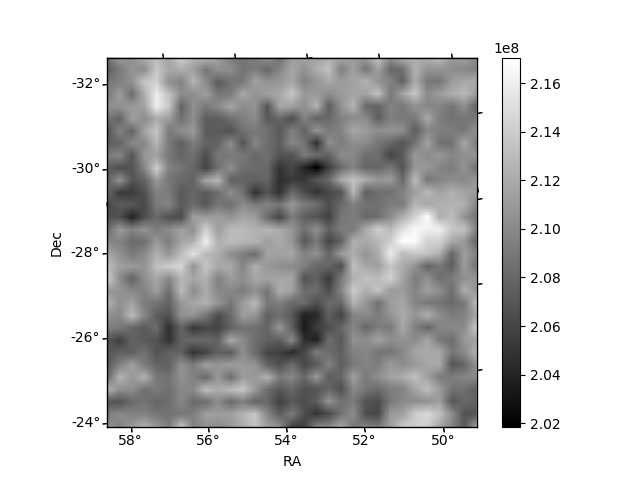
Histogram calculated using DETX and DETY for each event in the final _common_clean file
| Quadrant A | 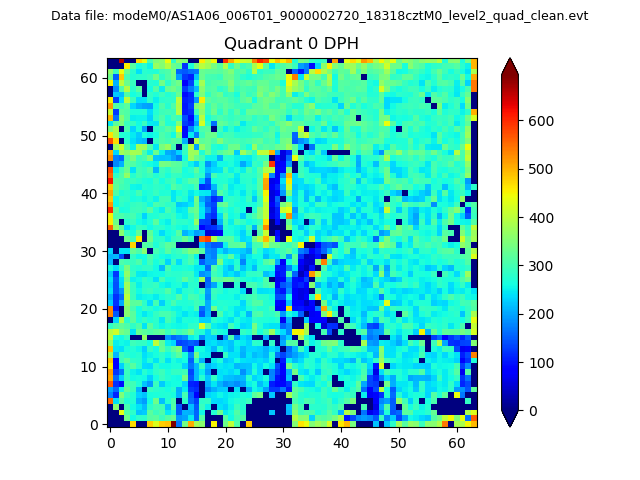 |
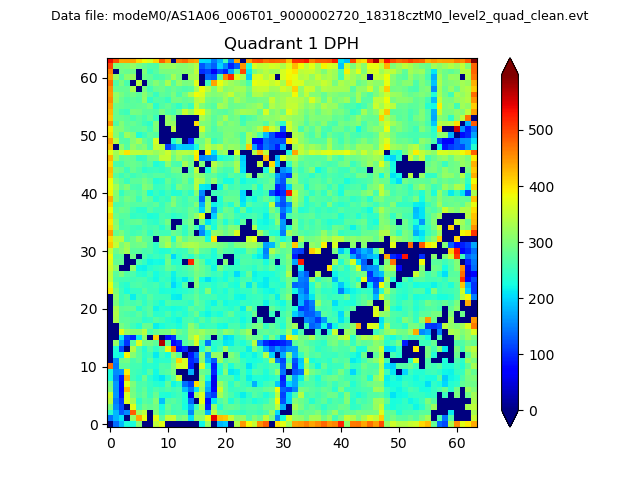 |
Quadrant B |
|---|---|---|---|
| Quadrant D |  |
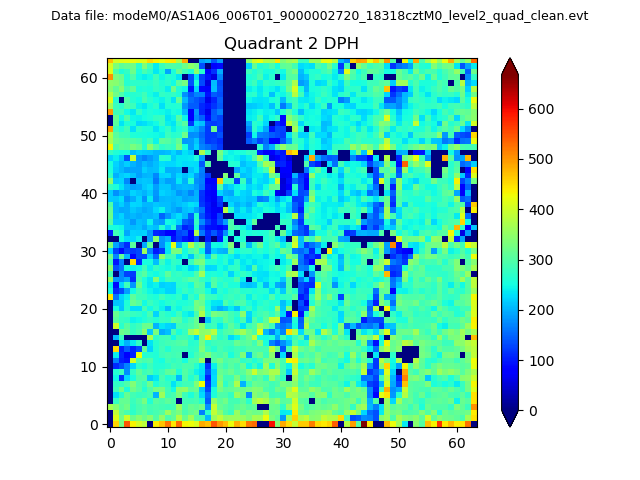 |
Quadrant C |
| Plot type | Count rate plots | Images |
|---|---|---|
| Comparison with Poisson distribution Blue bars denote a histogram of data divided into 1 sec bins. Red curve is a Poisson curve with rate = median count rate of data. |
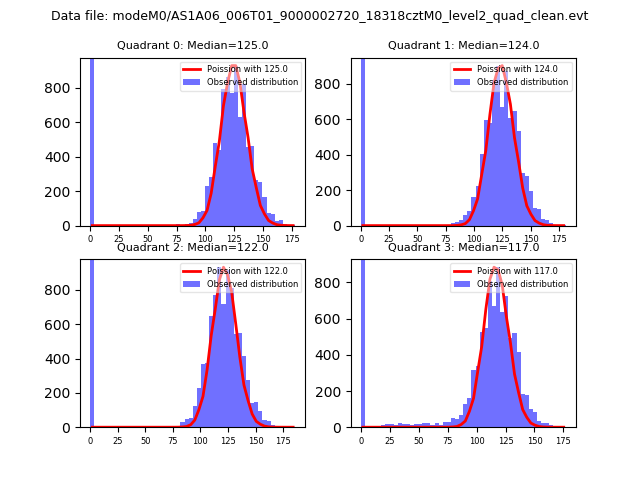 |
 |
| Quadrant-wise count rates Data is divided into 100 sec bins |
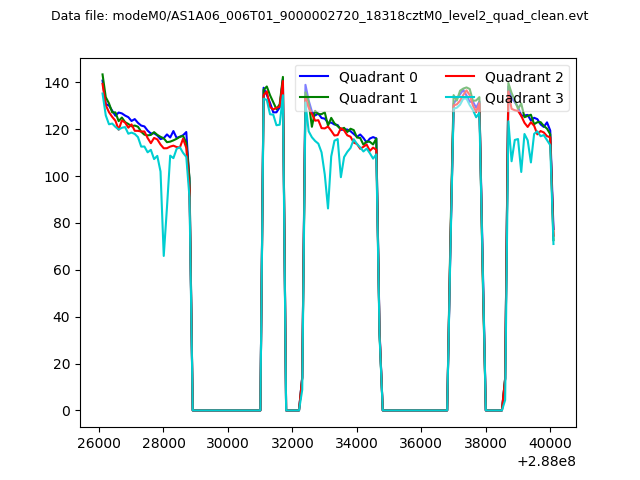 |
|
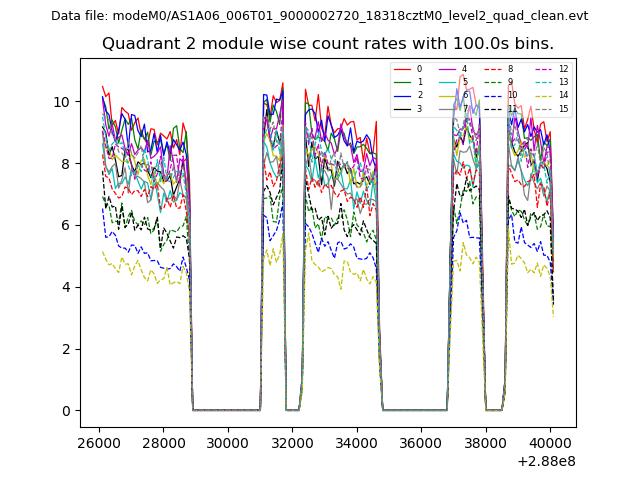
| Module-wise count rates for Quadrant A Data is divided into 100 sec bins |
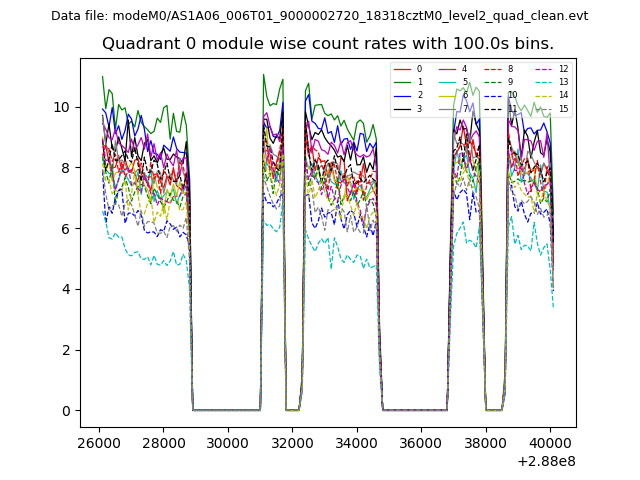 |
 |
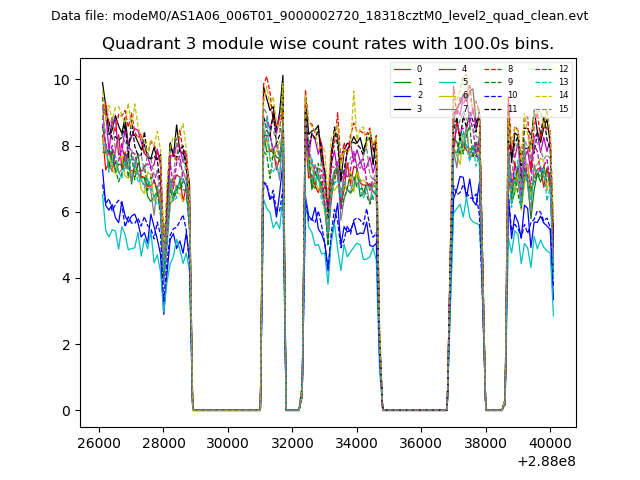
| Module-wise count rates for Quadrant B Data is divided into 100 sec bins |
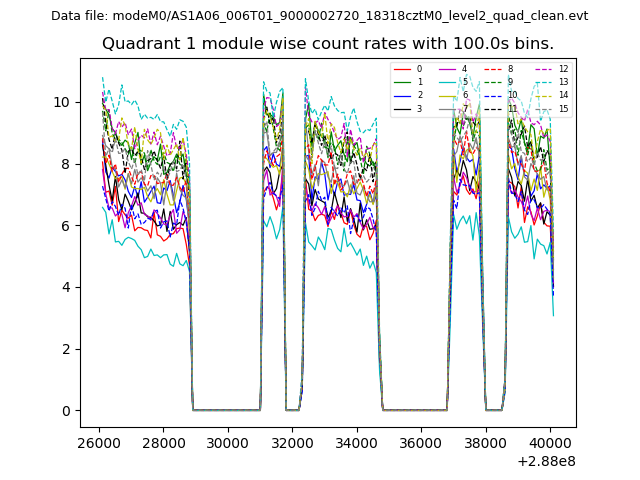 |
 |
| Module-wise count rates for Quadrant C Data is divided into 100 sec bins |
 |
 |
| Module-wise count rates for Quadrant D Data is divided into 100 sec bins |
 |
 |
| Parameter | Plot |
|---|---|
| CZT HV Monitor | 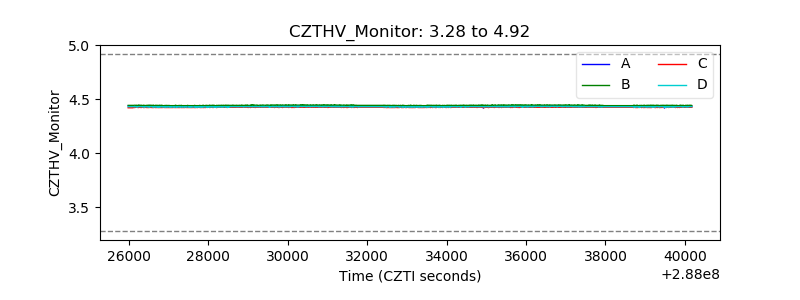 |
| D_VDD | 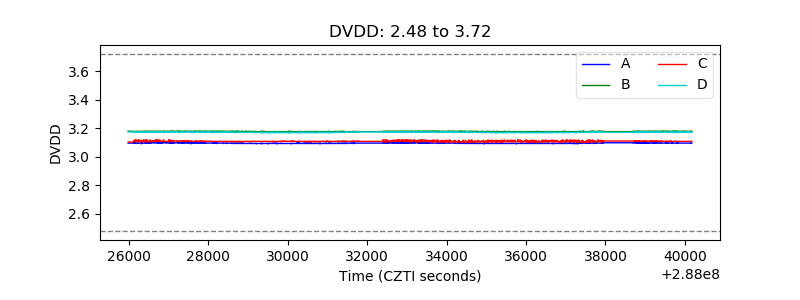 |
| Temperature 1 | 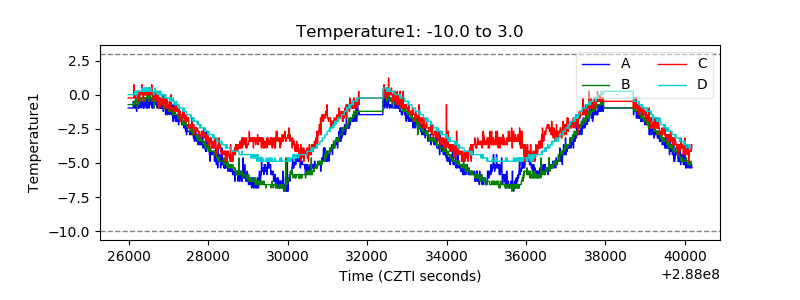 |
| Veto HV Monitor | 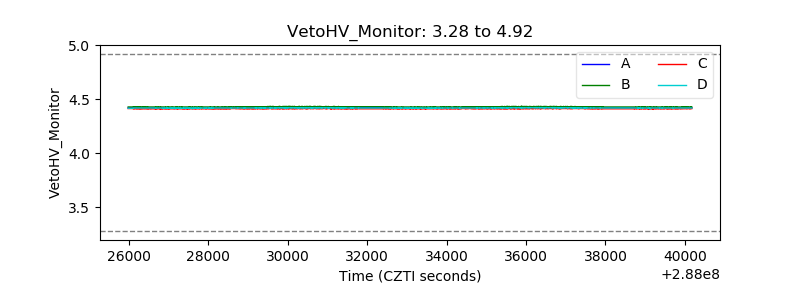 |
| Veto LLD | 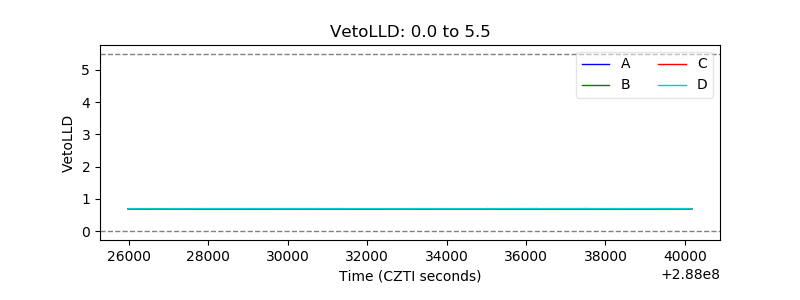 |
| Alpha Counter | 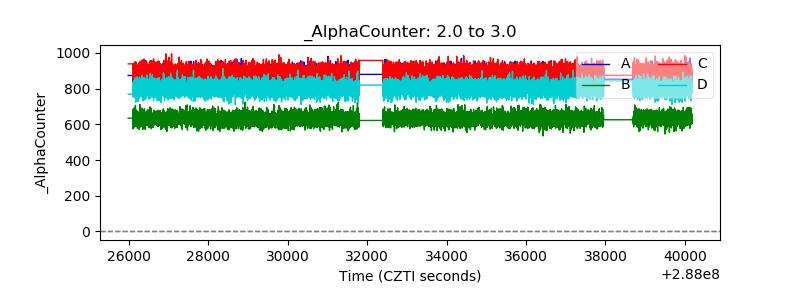 |
| _CPM_Rate | 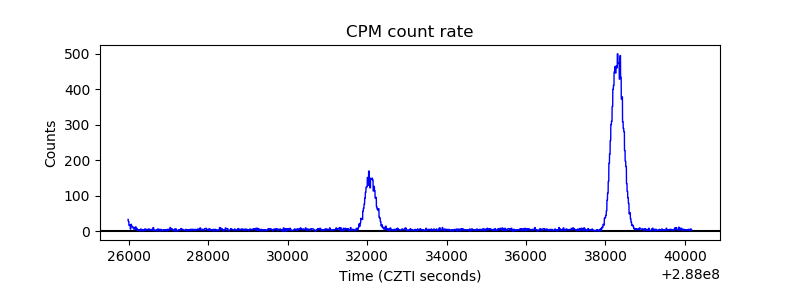 |
| CZT Counter | 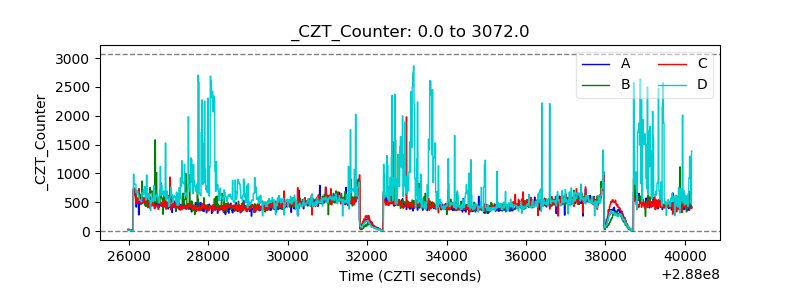 |
| +2.5 Volts monitor |  |
| +5 Volts monitor |  |
| _ROLL_ROT | 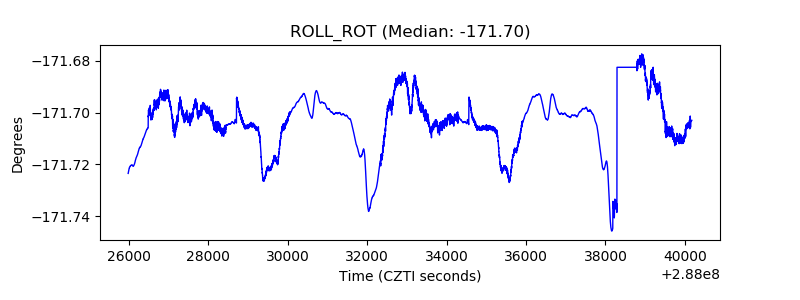 |
| _Roll_DEC | 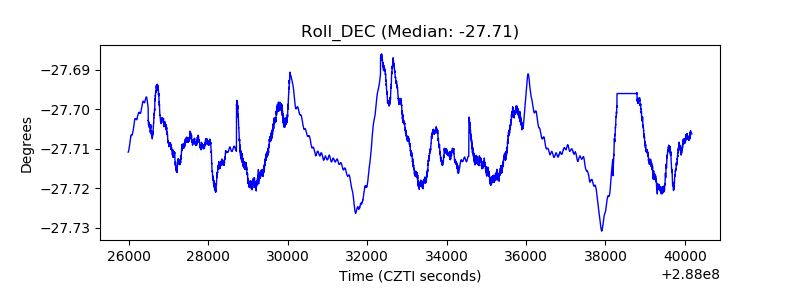 |
| _Roll_RA |  |
| Veto Counter | 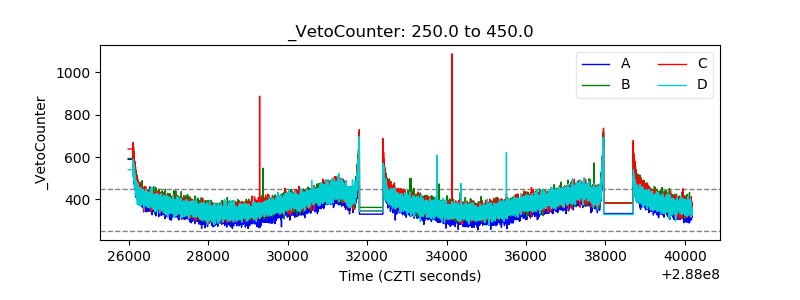 |