| Param | Original file | Final file |
|---|---|---|
| Filename | modeM0/AS1A06_006T01_9000002720_18319cztM0_level2.evt | modeM0/AS1A06_006T01_9000002720_18319cztM0_level2_quad_clean.evt |
| Size (bytes) | 475,125,120 | 90,241,920 |
| Size | 453.1 MB | 86.1 MB |
| Events in quadrant A | 3,091,839 | 577,573 |
| Events in quadrant B | 3,361,506 | 581,931 |
| Events in quadrant C | 3,121,428 | 564,783 |
| Events in quadrant D | 4,359,881 | 541,927 |
| Mode SS | |||
|---|---|---|---|
| Quadrant | BADHDUFLAG | Total packets | Discarded packets |
| A | 0 | 136 | 0 |
| B | 0 | 136 | 0 |
| C | 0 | 136 | 0 |
| D | 0 | 136 | 0 |
| Mode M9 | |||
|---|---|---|---|
| Quadrant | BADHDUFLAG | Total packets | Discarded packets |
| A | 0 | 10 | 0 |
| B | 0 | 11 | 0 |
| C | 0 | 11 | 0 |
| D | 0 | 11 | 0 |
| Mode M0 | |||
|---|---|---|---|
| Quadrant | BADHDUFLAG | Total packets | Discarded packets |
| A | 0 | 13618 | 3 |
| B | 0 | 14297 | 2 |
| C | 0 | 13604 | 2 |
| D | 0 | 17492 | 2 |
| Quadrant | Total seconds | Saturated seconds | Saturation percentage |
|---|---|---|---|
| A | 6698 | 24 | 0.358316% |
| B | 6698 | 69 | 1.030158% |
| C | 6698 | 53 | 0.791281% |
| D | 6698 | 193 | 2.881457% |
Noise dominated data is calculated using 1-second bins in cleaned event files. If a bin has >2000 counts, and if more than 50% of those come from <1% of pixels, then it is considered to be noise-dominated and hence unusable.
| Quadrant | # 1 sec bins | Bins with >0 counts | Bins with >2000 counts | High rate bins dominated by noise | Noise dominated (total time) | Noise dominated (detector-on time) | Marked lightcurve |
|---|---|---|---|---|---|---|---|
| A | 7583 | 6700 | 0 | 0 | 0.00% | 0.00% | 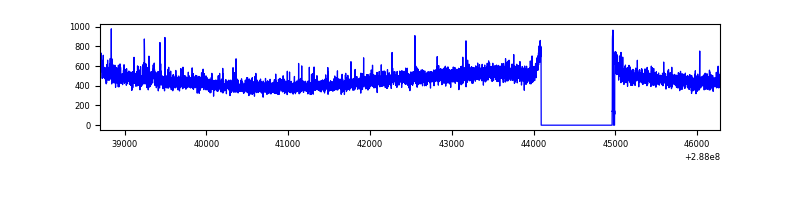 |
| B | 7583 | 6700 | 9 | 9 | 0.12% | 0.13% | 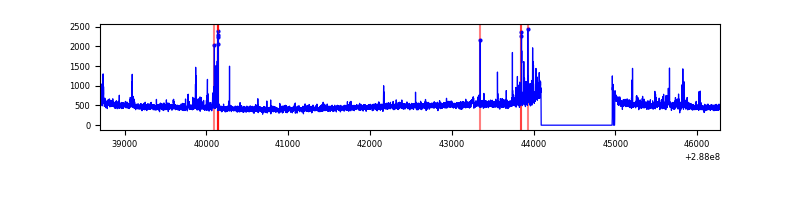 |
| C | 7583 | 6700 | 0 | 0 | 0.00% | 0.00% |  |
| D | 7583 | 6700 | 167 | 167 | 2.20% | 2.49% | 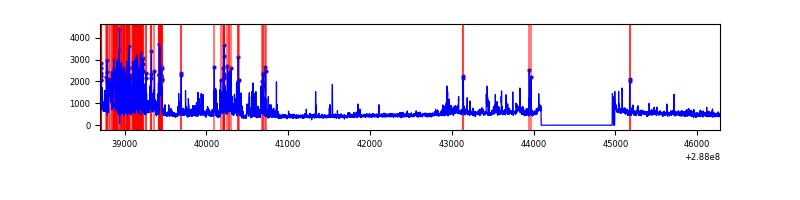 |
Top three noisy pixels from each quadrant. If the there are fewer than three noisy pixels in the level2.evt file, extra rows are filled as -1
| Pixel properties | Quadrant properties | ||||||
|---|---|---|---|---|---|---|---|
| Quadrant | DetID | PixID | Counts | Sigma | Mean | Median | Sigma |
| A | 15 | 174 | 13820 | 80.26 | 800 | 782 | 162.4 |
| A | 0 | 226 | 7043 | 38.54 | 800 | 782 | 162.4 |
| A | 3 | 137 | 5857 | 31.24 | 800 | 782 | 162.4 |
| B | 7 | 220 | 110609 | 706.77 | 805 | 784 | 155.4 |
| B | 0 | 197 | 48185 | 305.04 | 805 | 784 | 155.4 |
| B | 12 | 111 | 17375 | 106.77 | 805 | 784 | 155.4 |
| C | 14 | 238 | 117788 | 644.77 | 767 | 772 | 181.5 |
| C | 0 | 207 | 7834 | 38.91 | 767 | 772 | 181.5 |
| C | 13 | 61 | 5529 | 26.21 | 767 | 772 | 181.5 |
| D | 7 | 238 | 1038772 | 5521.06 | 768 | 746 | 188.0 |
| D | 2 | 69 | 148689 | 786.88 | 768 | 746 | 188.0 |
| D | 13 | 168 | 49661 | 260.17 | 768 | 746 | 188.0 |
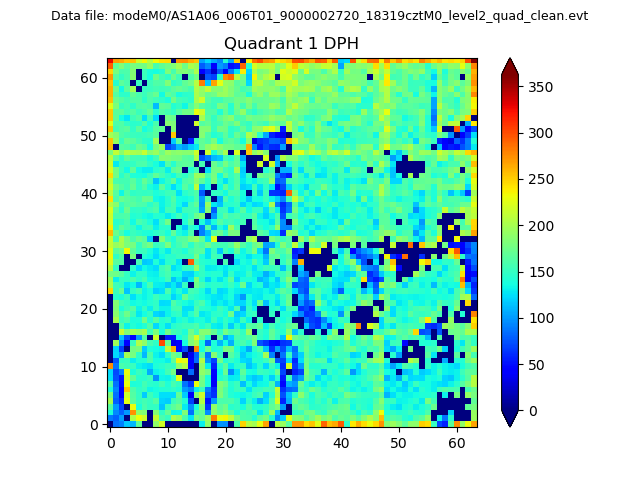
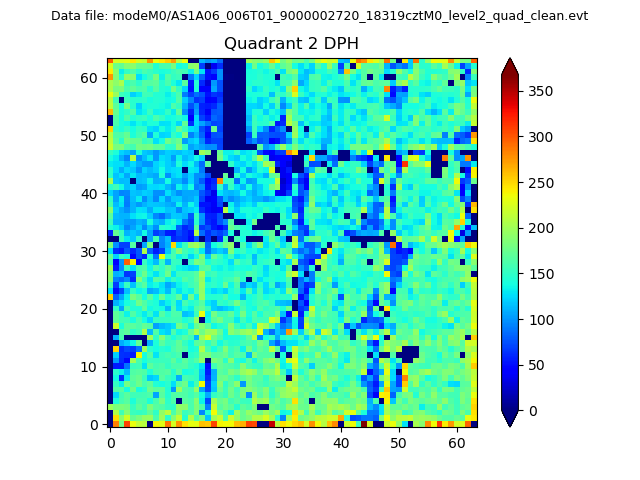
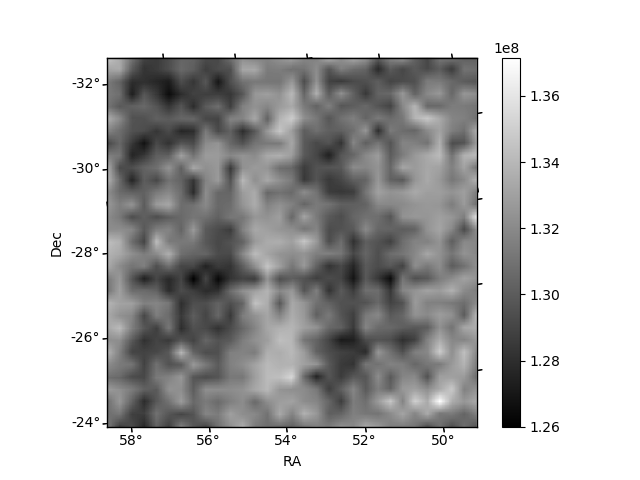
Histogram calculated using DETX and DETY for each event in the final _common_clean file
| Quadrant A |  |
 |
Quadrant B |
|---|---|---|---|
| Quadrant D | 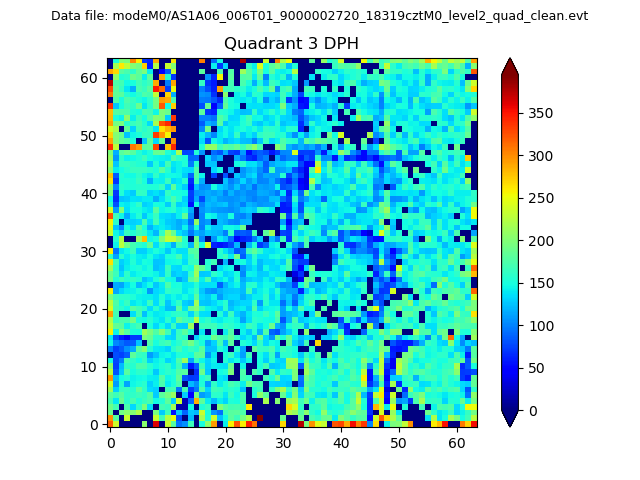 |
 |
Quadrant C |
| Plot type | Count rate plots | Images |
|---|---|---|
| Comparison with Poisson distribution Blue bars denote a histogram of data divided into 1 sec bins. Red curve is a Poisson curve with rate = median count rate of data. |
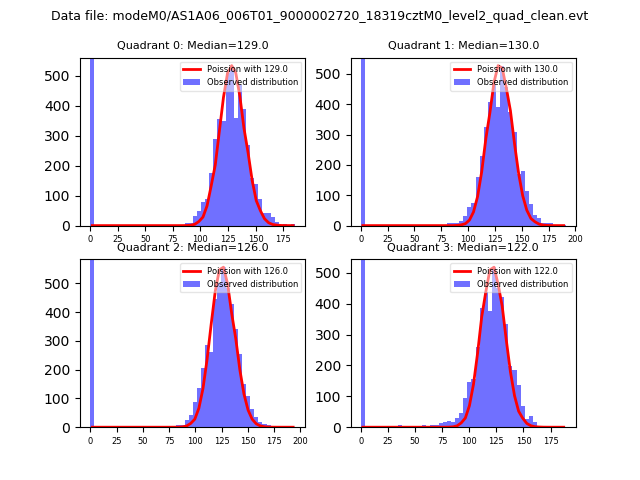 |
 |
| Quadrant-wise count rates Data is divided into 100 sec bins |
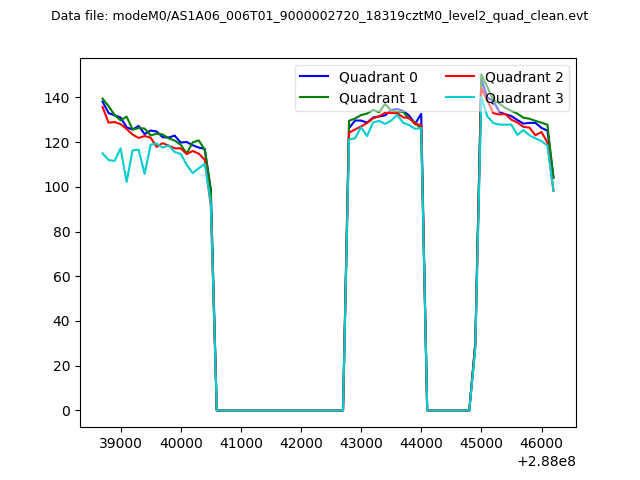 |
|
| Module-wise count rates for Quadrant A Data is divided into 100 sec bins |
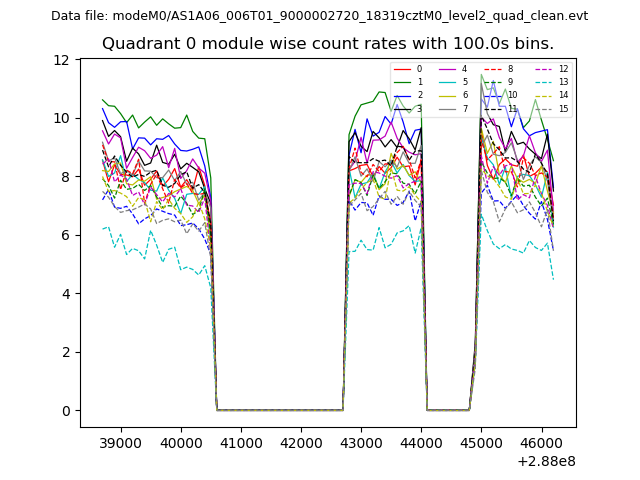 |
 |
| Module-wise count rates for Quadrant B Data is divided into 100 sec bins |
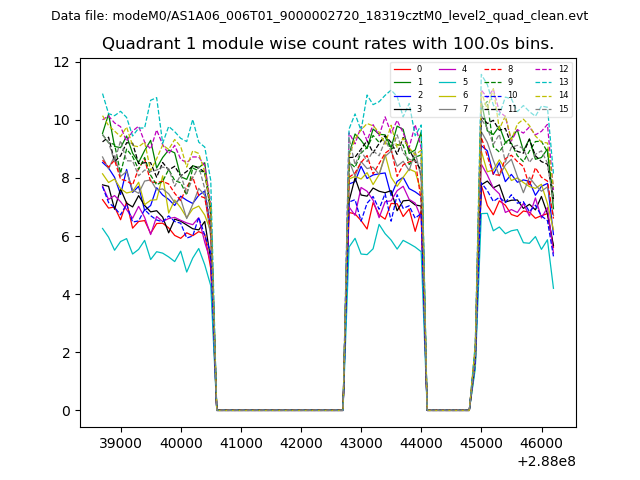 |
 |
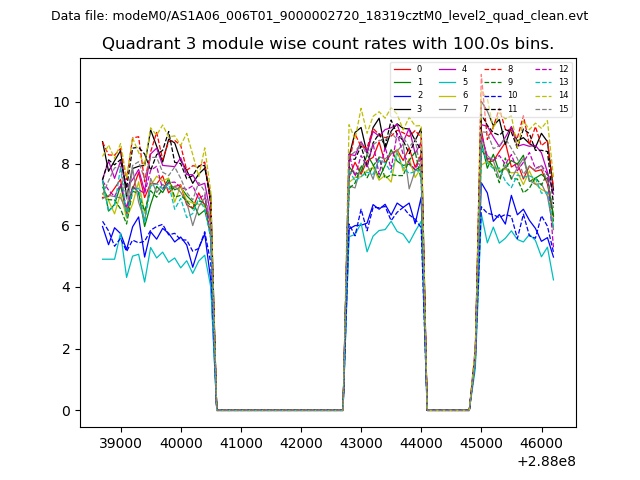
| Module-wise count rates for Quadrant C Data is divided into 100 sec bins |
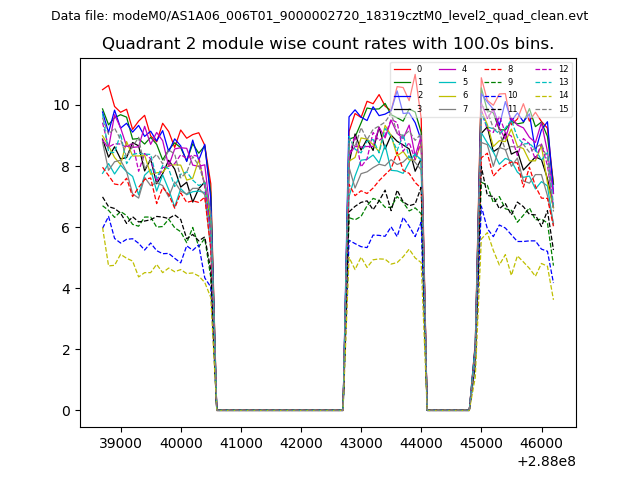 |
 |
| Module-wise count rates for Quadrant D Data is divided into 100 sec bins |
 |
 |
| Parameter | Plot |
|---|---|
| CZT HV Monitor | 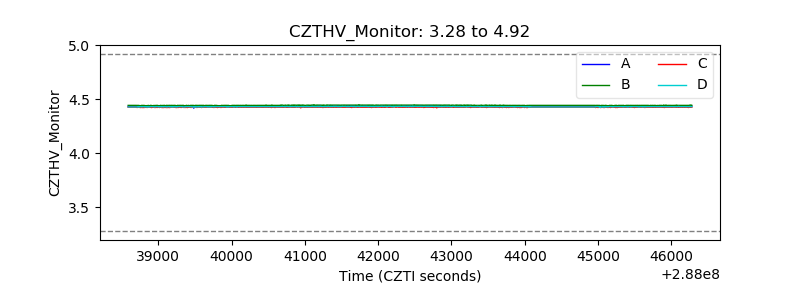 |
| D_VDD | 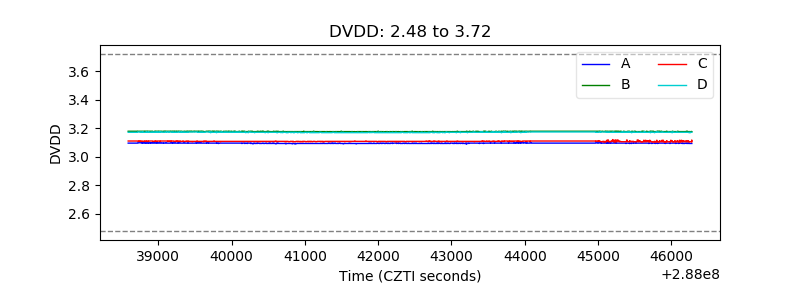 |
| Temperature 1 | 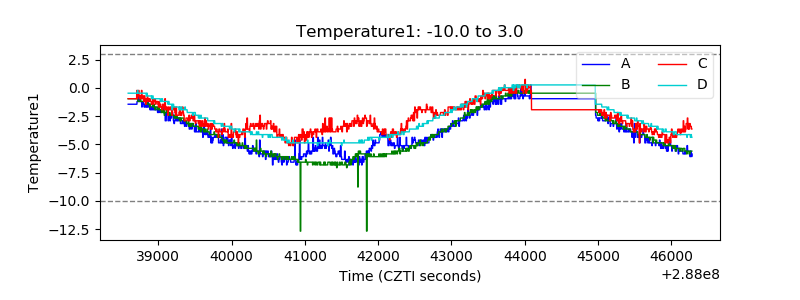 |
| Veto HV Monitor | 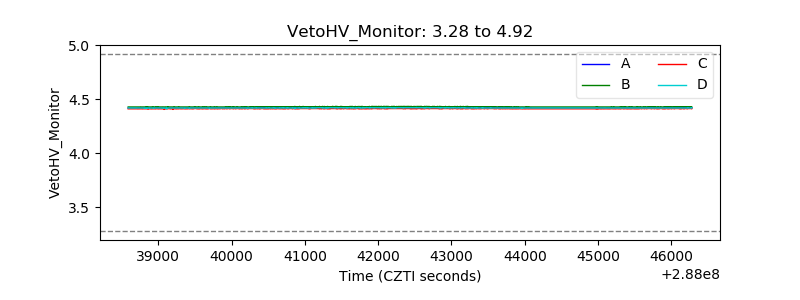 |
| Veto LLD | 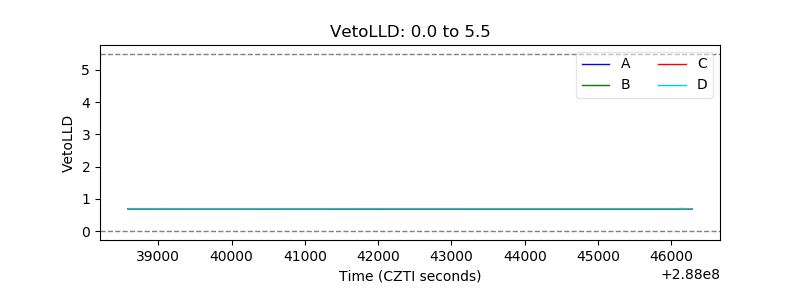 |
| Alpha Counter |  |
| _CPM_Rate | 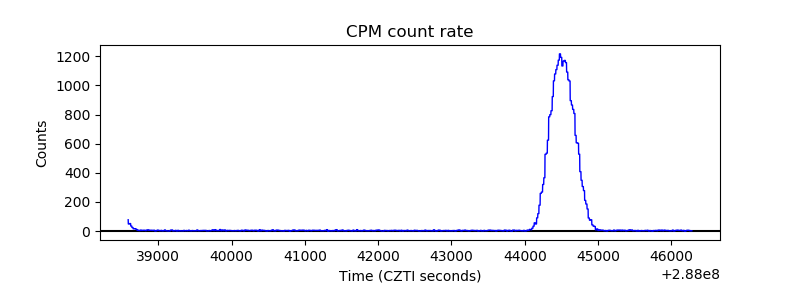 |
| CZT Counter | 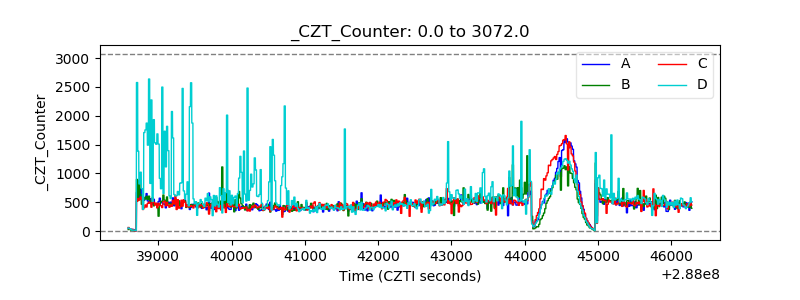 |
| +2.5 Volts monitor |  |
| +5 Volts monitor |  |
| _ROLL_ROT | 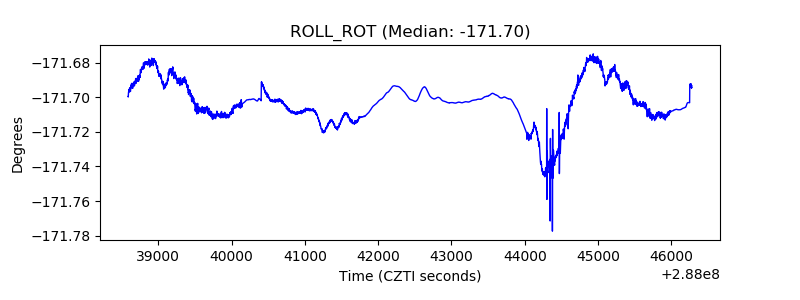 |
| _Roll_DEC | 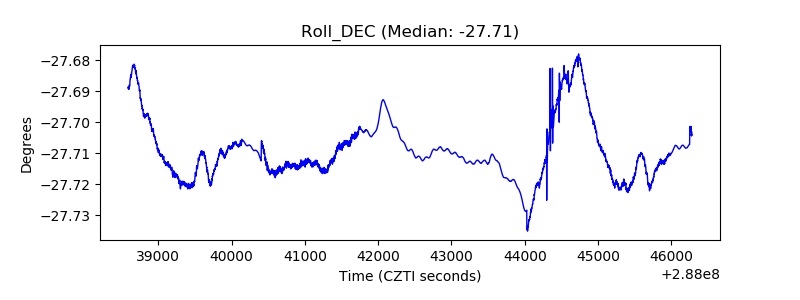 |
| _Roll_RA | 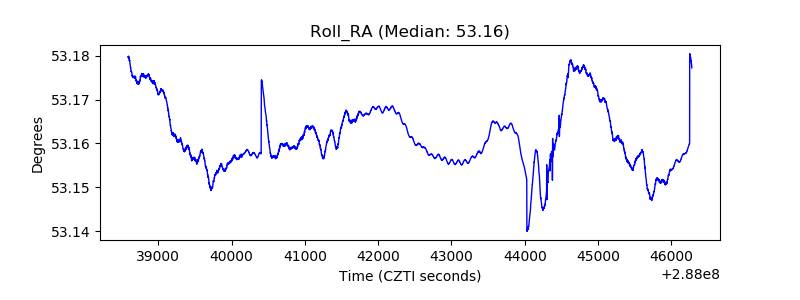 |
| Veto Counter | 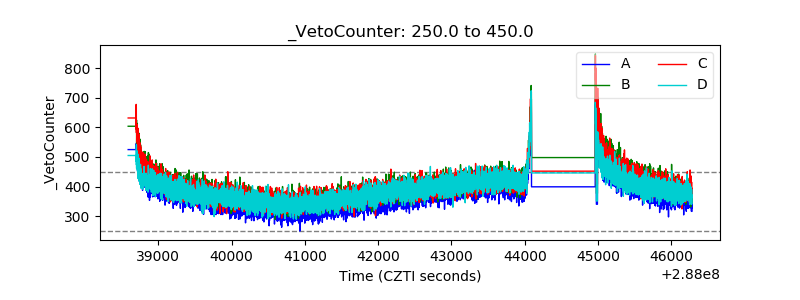 |