| Param | Original file | Final file |
|---|---|---|
| Filename | modeM0/AS1A06_006T01_9000002720_18322cztM0_level2.evt | modeM0/AS1A06_006T01_9000002720_18322cztM0_level2_quad_clean.evt |
| Size (bytes) | 571,659,840 | 79,395,840 |
| Size | 545.2 MB | 75.7 MB |
| Events in quadrant A | 3,365,343 | 495,920 |
| Events in quadrant B | 3,592,826 | 503,147 |
| Events in quadrant C | 3,342,537 | 490,049 |
| Events in quadrant D | 6,559,318 | 448,732 |
| Mode SS | |||
|---|---|---|---|
| Quadrant | BADHDUFLAG | Total packets | Discarded packets |
| A | 0 | 138 | 0 |
| B | 0 | 138 | 0 |
| C | 0 | 138 | 0 |
| D | 0 | 138 | 0 |
| Mode M9 | |||
|---|---|---|---|
| Quadrant | BADHDUFLAG | Total packets | Discarded packets |
| A | 0 | 22 | 0 |
| B | 0 | 22 | 0 |
| C | 0 | 22 | 0 |
| D | 0 | 22 | 0 |
| Mode M0 | |||
|---|---|---|---|
| Quadrant | BADHDUFLAG | Total packets | Discarded packets |
| A | 0 | 14157 | 2 |
| B | 0 | 14834 | 2 |
| C | 0 | 13875 | 2 |
| D | 0 | 24125 | 2 |
| Quadrant | Total seconds | Saturated seconds | Saturation percentage |
|---|---|---|---|
| A | 6684 | 60 | 0.897666% |
| B | 6684 | 71 | 1.062238% |
| C | 6684 | 61 | 0.912627% |
| D | 6685 | 653 | 9.768138% |
Noise dominated data is calculated using 1-second bins in cleaned event files. If a bin has >2000 counts, and if more than 50% of those come from <1% of pixels, then it is considered to be noise-dominated and hence unusable.
| Quadrant | # 1 sec bins | Bins with >0 counts | Bins with >2000 counts | High rate bins dominated by noise | Noise dominated (total time) | Noise dominated (detector-on time) | Marked lightcurve |
|---|---|---|---|---|---|---|---|
| A | 8919 | 6686 | 25 | 25 | 0.28% | 0.37% | 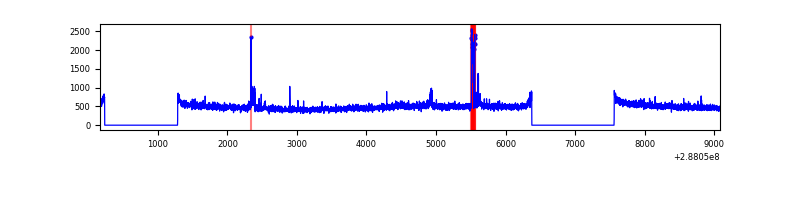 |
| B | 8919 | 6686 | 11 | 11 | 0.12% | 0.16% | 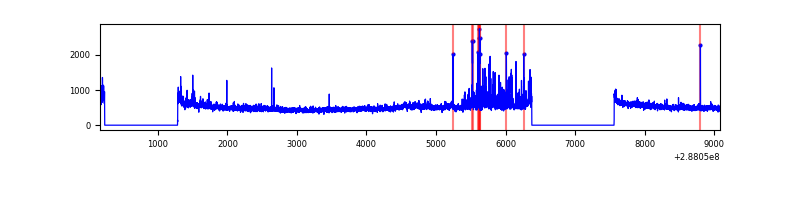 |
| C | 8919 | 6686 | 1 | 1 | 0.01% | 0.01% | 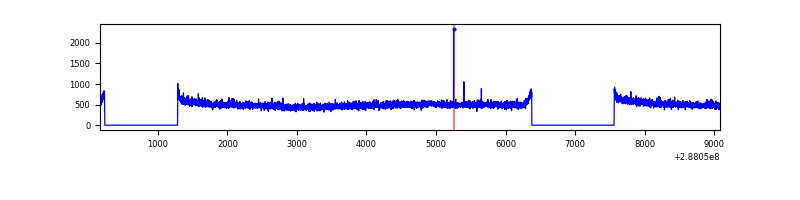 |
| D | 8920 | 6687 | 572 | 572 | 6.41% | 8.55% | 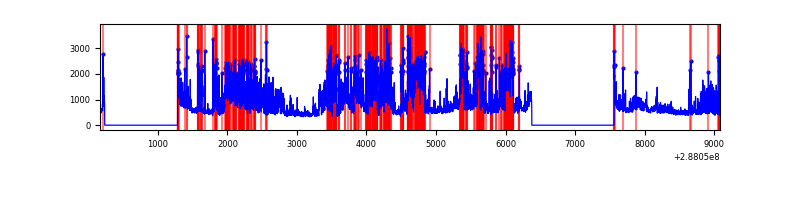 |
Top three noisy pixels from each quadrant. If the there are fewer than three noisy pixels in the level2.evt file, extra rows are filled as -1
| Pixel properties | Quadrant properties | ||||||
|---|---|---|---|---|---|---|---|
| Quadrant | DetID | PixID | Counts | Sigma | Mean | Median | Sigma |
| A | 4 | 2 | 87205 | 516.04 | 838 | 822 | 167.4 |
| A | 15 | 174 | 53698 | 315.88 | 838 | 822 | 167.4 |
| A | 0 | 226 | 7242 | 38.35 | 838 | 822 | 167.4 |
| B | 7 | 220 | 191238 | 1190.88 | 846 | 826 | 159.9 |
| B | 0 | 198 | 24456 | 147.79 | 846 | 826 | 159.9 |
| B | 0 | 197 | 21053 | 126.5 | 846 | 826 | 159.9 |
| C | 14 | 238 | 125794 | 668.81 | 810 | 817 | 186.9 |
| C | 3 | 233 | 51880 | 273.26 | 810 | 817 | 186.9 |
| C | 13 | 61 | 5870 | 27.04 | 810 | 817 | 186.9 |
| D | 7 | 238 | 2937596 | 15035.98 | 793 | 770 | 195.3 |
| D | 1 | 52 | 320865 | 1638.82 | 793 | 770 | 195.3 |
| D | 2 | 69 | 170808 | 870.56 | 793 | 770 | 195.3 |
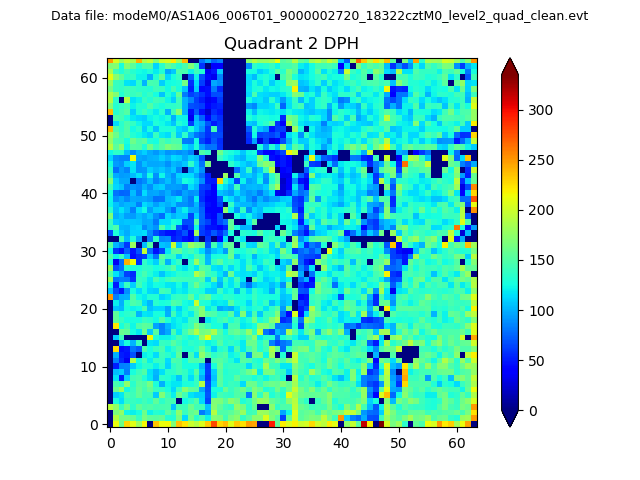
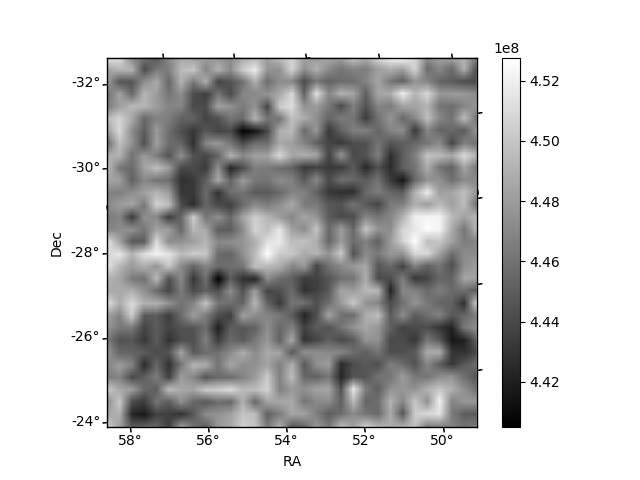
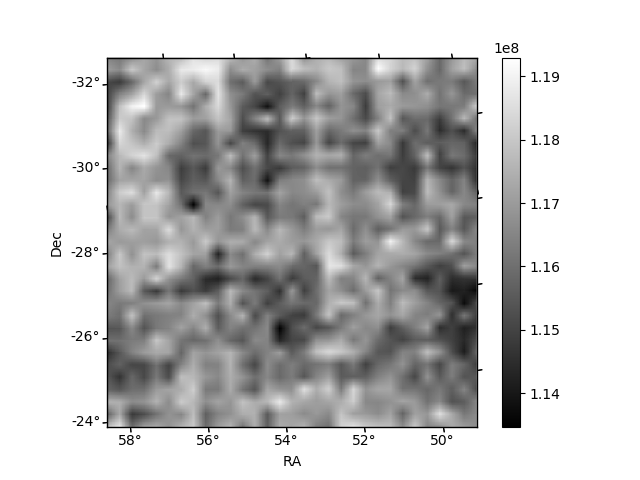
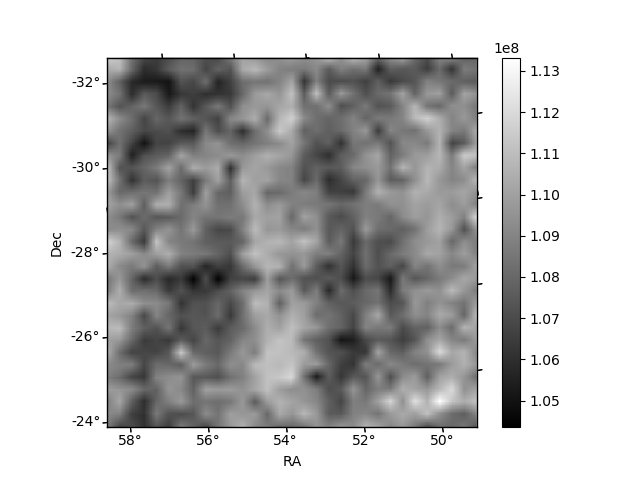
Histogram calculated using DETX and DETY for each event in the final _common_clean file
| Quadrant A | 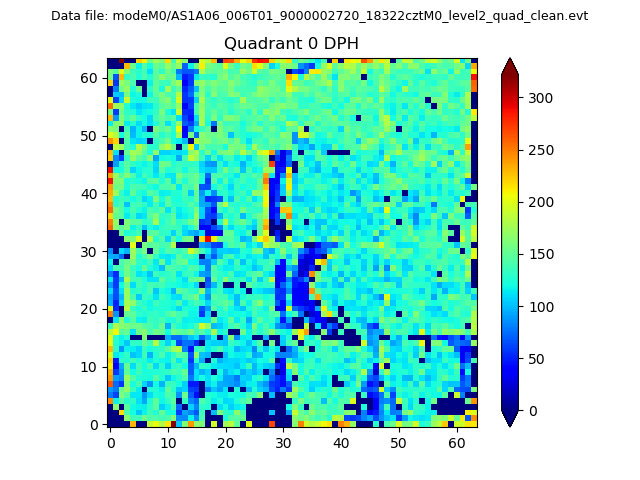 |
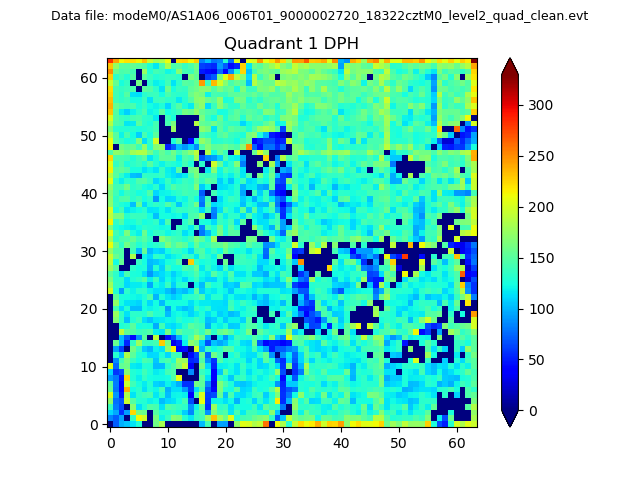 |
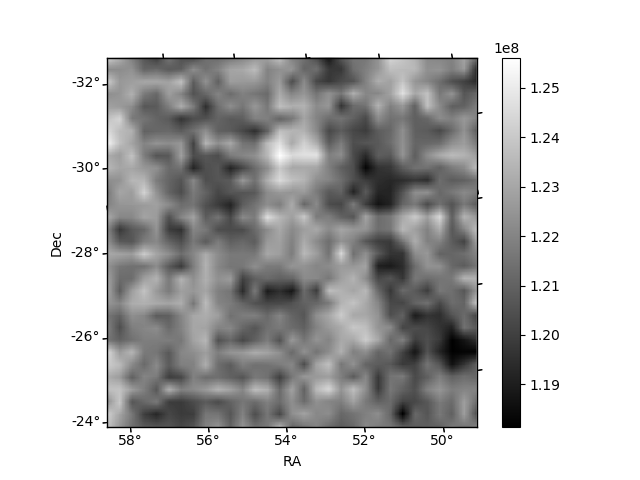
Quadrant B |
|---|---|---|---|
| Quadrant D | 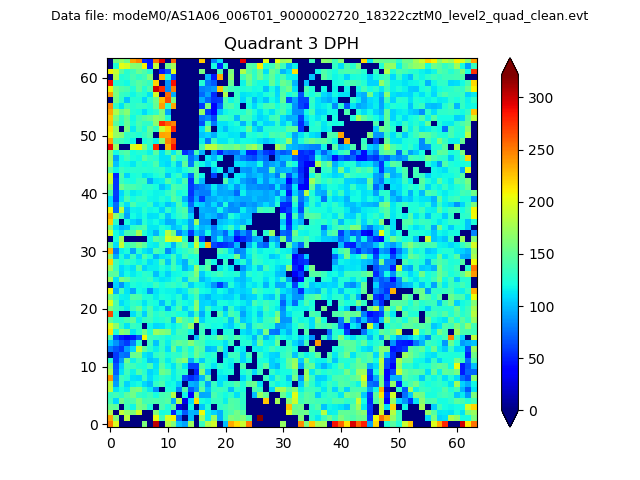 |
 |
Quadrant C |
| Plot type | Count rate plots | Images |
|---|---|---|
| Comparison with Poisson distribution Blue bars denote a histogram of data divided into 1 sec bins. Red curve is a Poisson curve with rate = median count rate of data. |
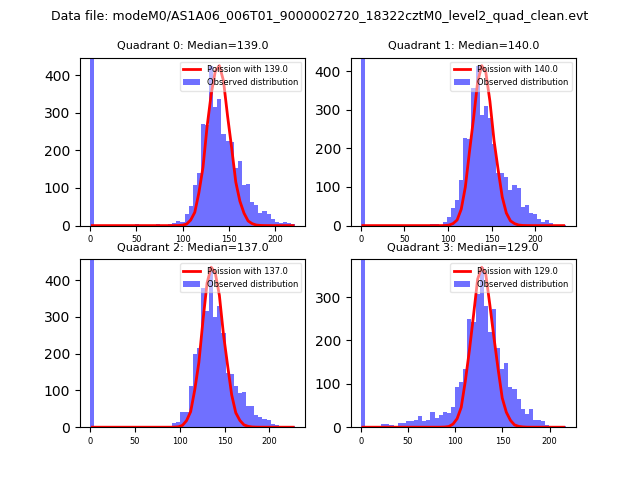 |
 |
| Quadrant-wise count rates Data is divided into 100 sec bins |
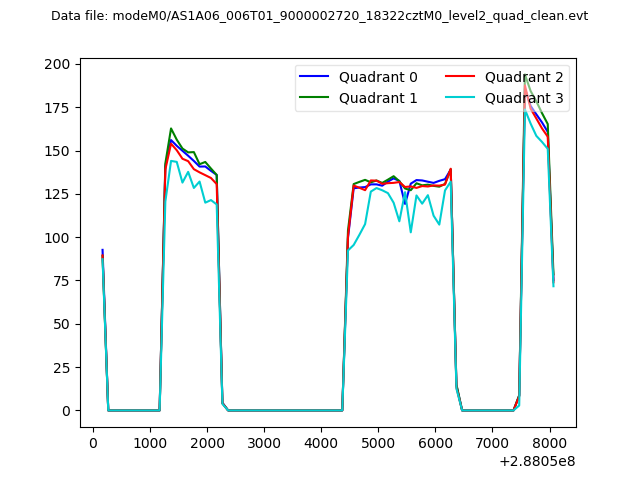 |
|
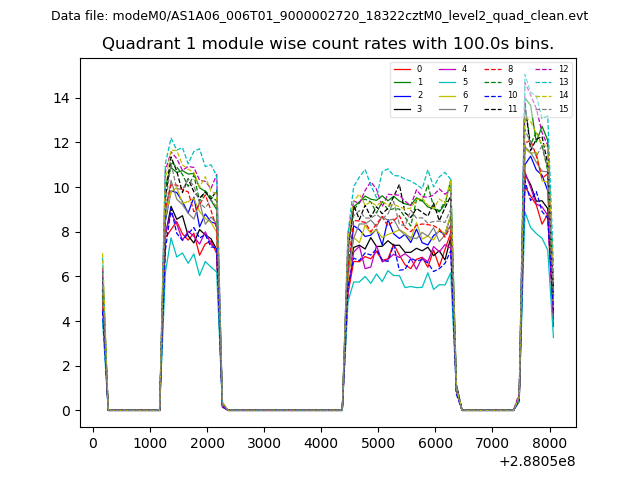
| Module-wise count rates for Quadrant A Data is divided into 100 sec bins |
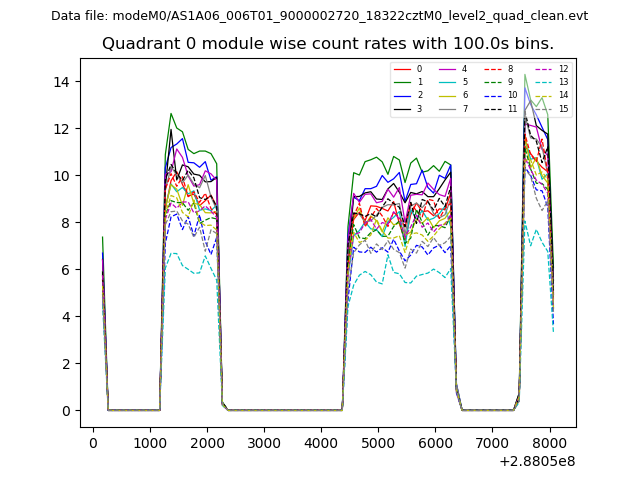 |
 |
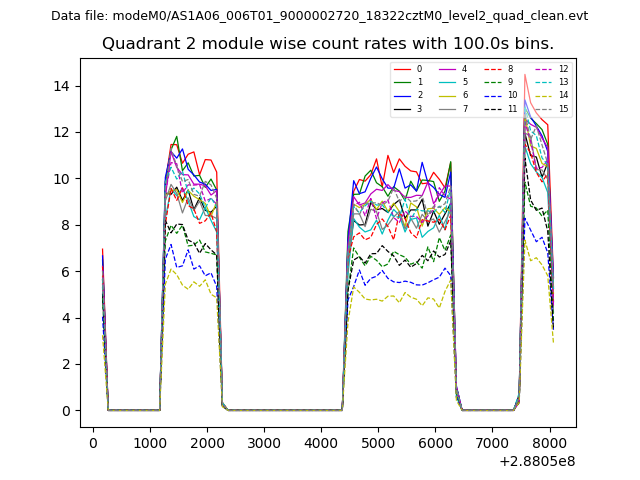
| Module-wise count rates for Quadrant B Data is divided into 100 sec bins |
 |
 |
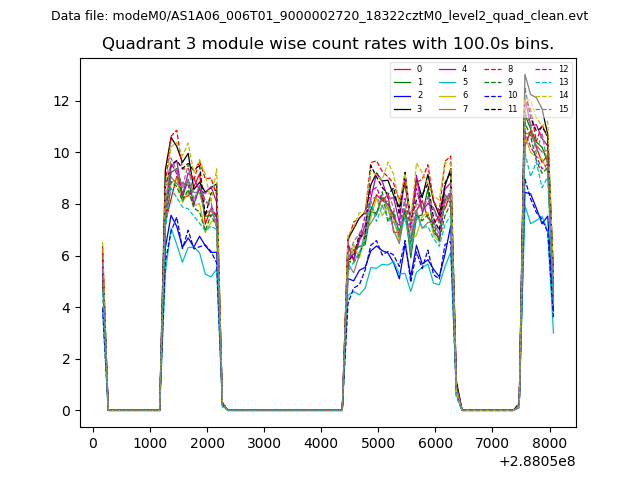
| Module-wise count rates for Quadrant C Data is divided into 100 sec bins |
 |
 |
| Module-wise count rates for Quadrant D Data is divided into 100 sec bins |
 |
 |
| Parameter | Plot |
|---|---|
| CZT HV Monitor |  |
| D_VDD | 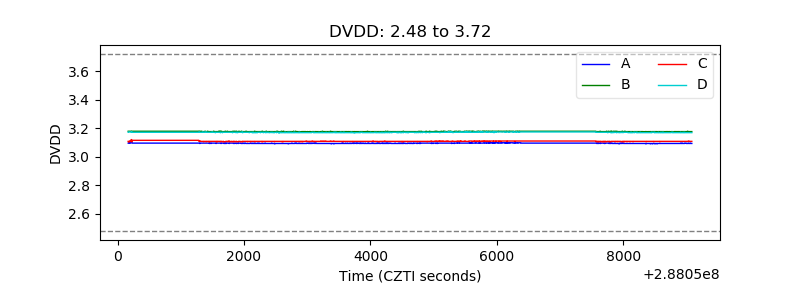 |
| Temperature 1 | 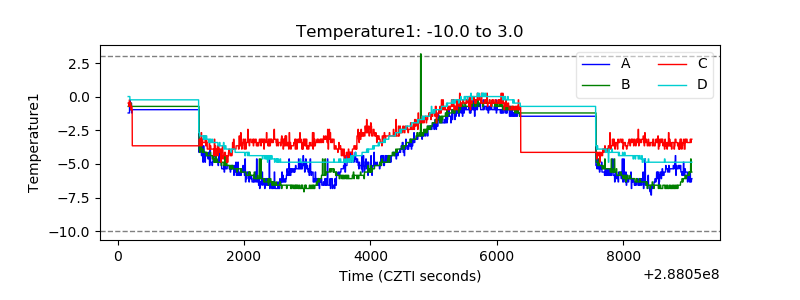 |
| Veto HV Monitor | 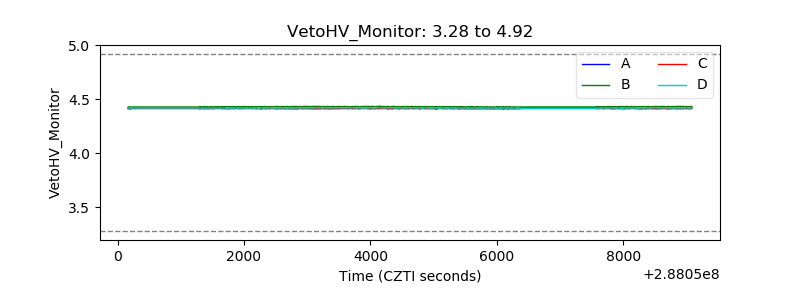 |
| Veto LLD | 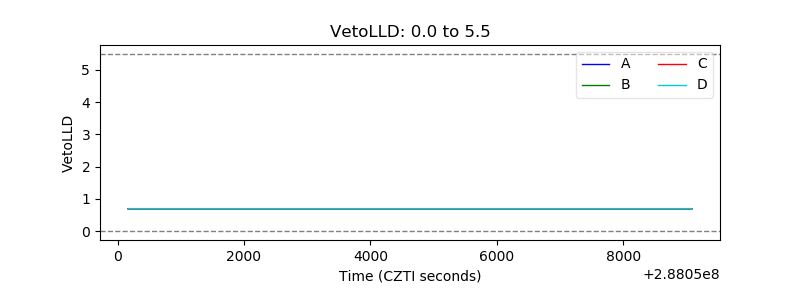 |
| Alpha Counter | 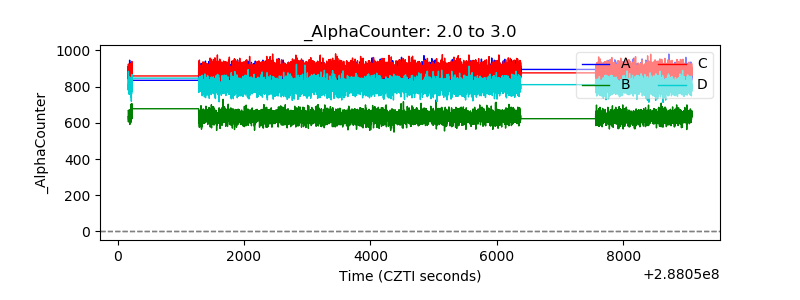 |
| _CPM_Rate | 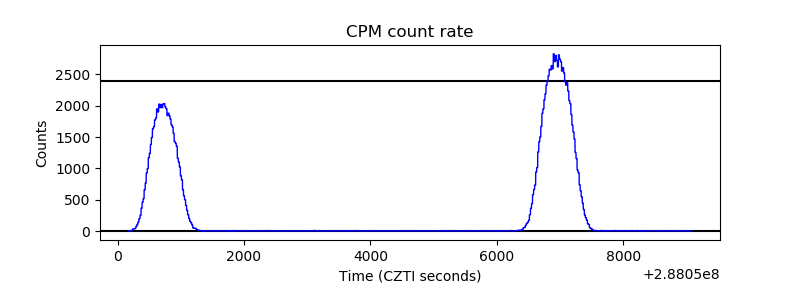 |
| CZT Counter | 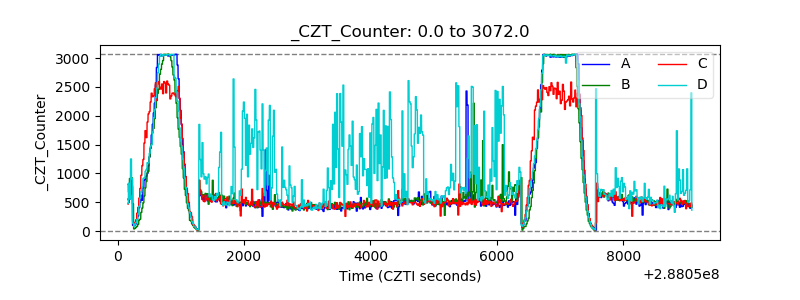 |
| +2.5 Volts monitor | 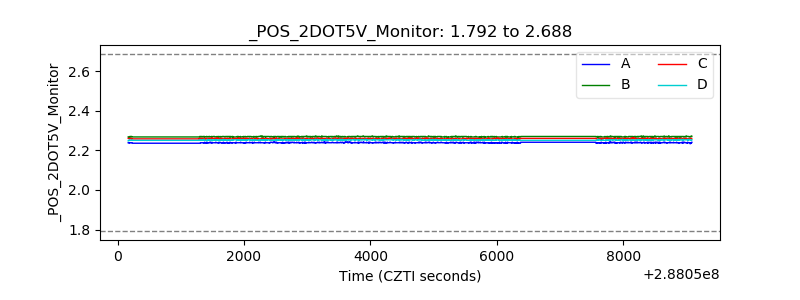 |
| +5 Volts monitor | 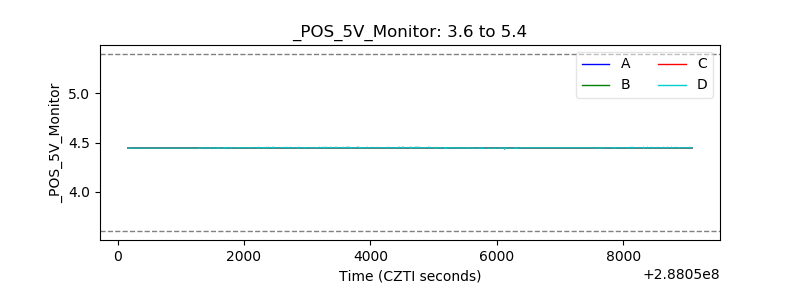 |
| _ROLL_ROT | 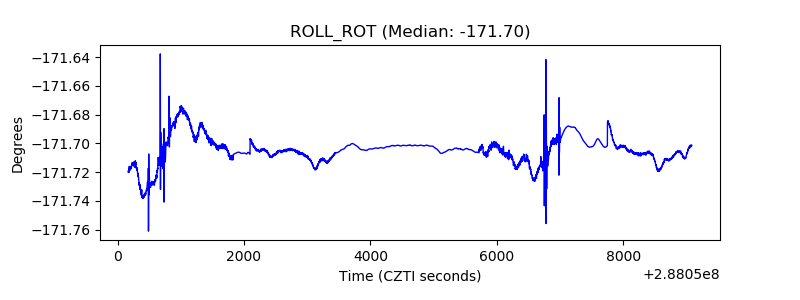 |
| _Roll_DEC | 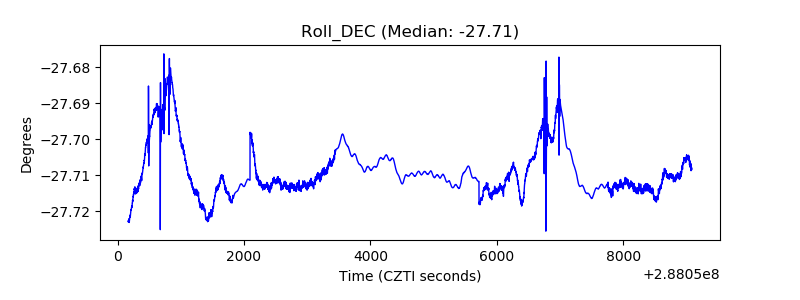 |
| _Roll_RA | 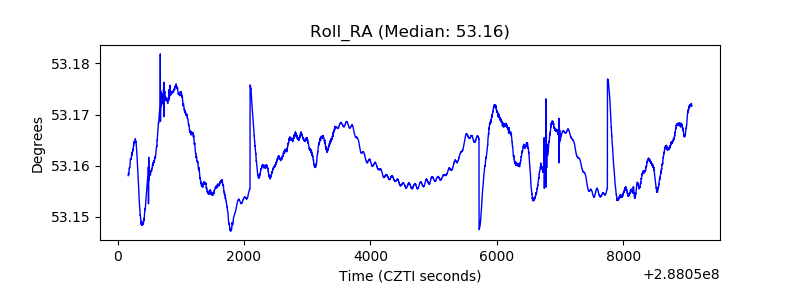 |
| Veto Counter | 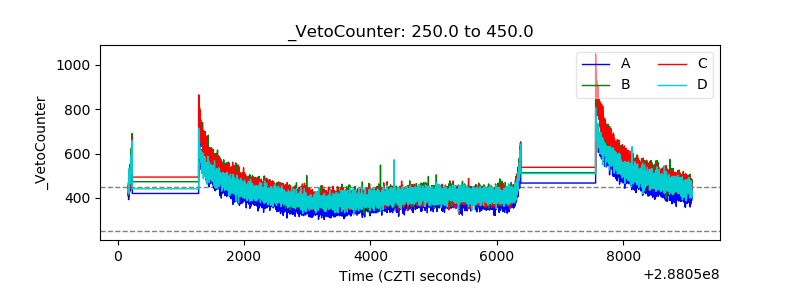 |