| Param | Original file | Final file |
|---|---|---|
| Filename | modeM0/AS1A06_006T01_9000002720_18323cztM0_level2.evt | modeM0/AS1A06_006T01_9000002720_18323cztM0_level2_quad_clean.evt |
| Size (bytes) | 699,713,280 | 67,993,920 |
| Size | 667.3 MB | 64.8 MB |
| Events in quadrant A | 3,249,693 | 429,848 |
| Events in quadrant B | 3,623,837 | 434,338 |
| Events in quadrant C | 3,333,117 | 424,869 |
| Events in quadrant D | 10,552,364 | 323,590 |
| Mode SS | |||
|---|---|---|---|
| Quadrant | BADHDUFLAG | Total packets | Discarded packets |
| A | 0 | 130 | 0 |
| B | 0 | 130 | 0 |
| C | 0 | 130 | 0 |
| D | 0 | 130 | 0 |
| Mode M9 | |||
|---|---|---|---|
| Quadrant | BADHDUFLAG | Total packets | Discarded packets |
| A | 0 | 18 | 0 |
| B | 0 | 19 | 0 |
| C | 0 | 19 | 0 |
| D | 0 | 19 | 0 |
| Mode M0 | |||
|---|---|---|---|
| Quadrant | BADHDUFLAG | Total packets | Discarded packets |
| A | 0 | 13414 | 1 |
| B | 0 | 14615 | 1 |
| C | 0 | 13611 | 1 |
| D | 0 | 35761 | 1 |
| Quadrant | Total seconds | Saturated seconds | Saturation percentage |
|---|---|---|---|
| A | 6383 | 38 | 0.595331% |
| B | 6383 | 96 | 1.503995% |
| C | 6383 | 82 | 1.284662% |
| D | 6383 | 2716 | 42.550525% |
Noise dominated data is calculated using 1-second bins in cleaned event files. If a bin has >2000 counts, and if more than 50% of those come from <1% of pixels, then it is considered to be noise-dominated and hence unusable.
| Quadrant | # 1 sec bins | Bins with >0 counts | Bins with >2000 counts | High rate bins dominated by noise | Noise dominated (total time) | Noise dominated (detector-on time) | Marked lightcurve |
|---|---|---|---|---|---|---|---|
| A | 7633 | 6384 | 0 | 0 | 0.00% | 0.00% | 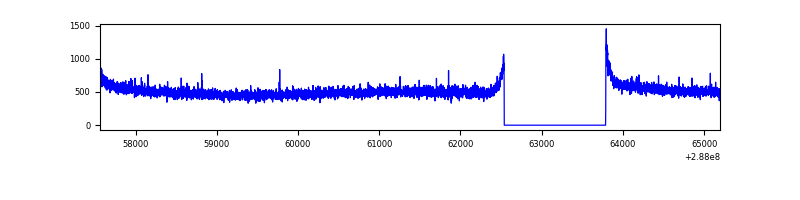 |
| B | 7633 | 6384 | 33 | 33 | 0.43% | 0.52% | 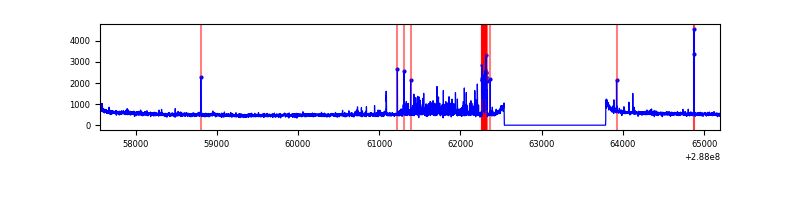 |
| C | 7633 | 6384 | 0 | 0 | 0.00% | 0.00% | 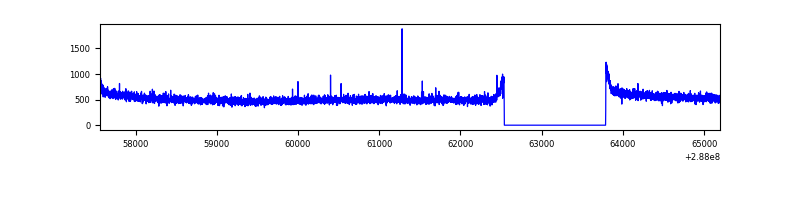 |
| D | 7633 | 6384 | 2590 | 2590 | 33.93% | 40.57% | 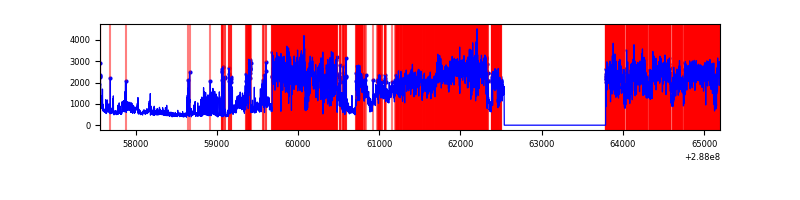 |
Top three noisy pixels from each quadrant. If the there are fewer than three noisy pixels in the level2.evt file, extra rows are filled as -1
| Pixel properties | Quadrant properties | ||||||
|---|---|---|---|---|---|---|---|
| Quadrant | DetID | PixID | Counts | Sigma | Mean | Median | Sigma |
| A | 0 | 226 | 7397 | 39.28 | 841 | 828 | 167.2 |
| A | 8 | 32 | 7132 | 37.7 | 841 | 828 | 167.2 |
| A | 12 | 194 | 6164 | 31.91 | 841 | 828 | 167.2 |
| B | 7 | 220 | 243623 | 1523.4 | 848 | 831 | 159.4 |
| B | 12 | 111 | 17582 | 105.1 | 848 | 831 | 159.4 |
| B | 0 | 189 | 16017 | 95.28 | 848 | 831 | 159.4 |
| C | 14 | 238 | 128443 | 681.0 | 816 | 826 | 187.4 |
| C | 3 | 233 | 17868 | 90.94 | 816 | 826 | 187.4 |
| C | 0 | 207 | 6573 | 30.67 | 816 | 826 | 187.4 |
| D | 7 | 238 | 7152768 | 43197.41 | 683 | 663 | 165.6 |
| D | 1 | 52 | 423015 | 2550.93 | 683 | 663 | 165.6 |
| D | 2 | 69 | 308651 | 1860.19 | 683 | 663 | 165.6 |
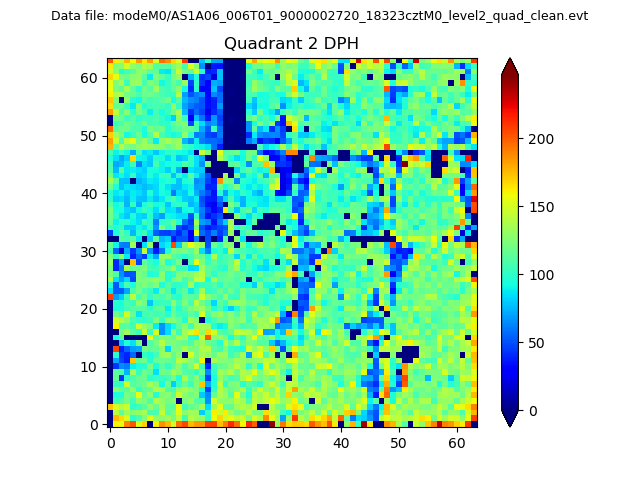
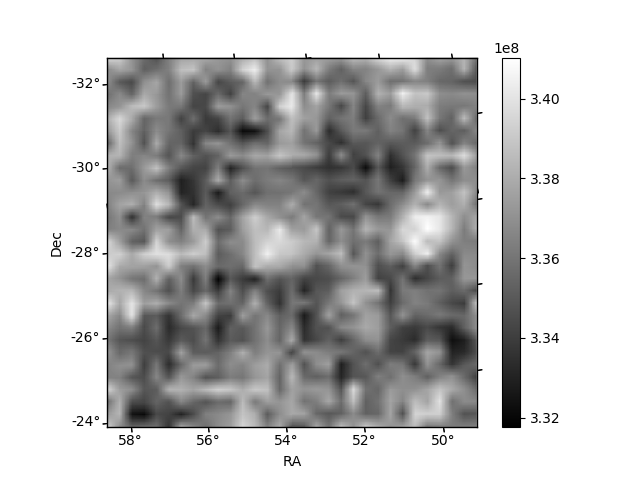
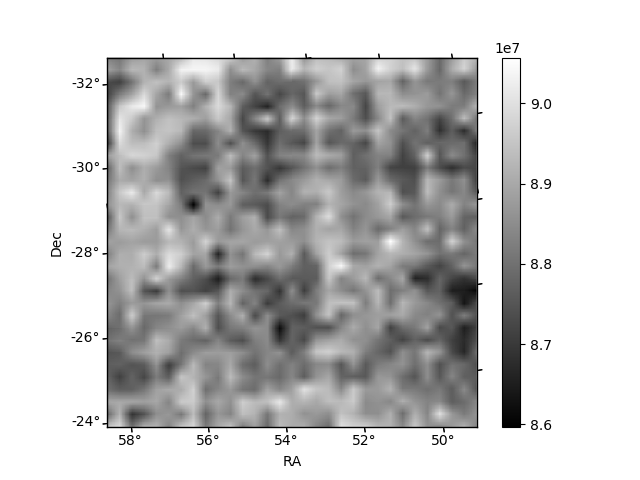
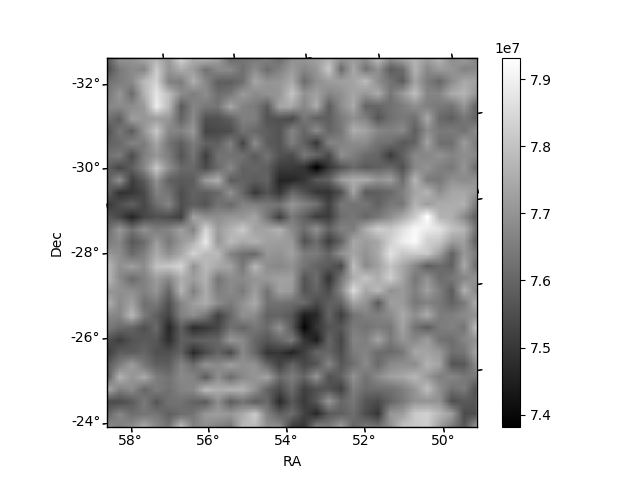
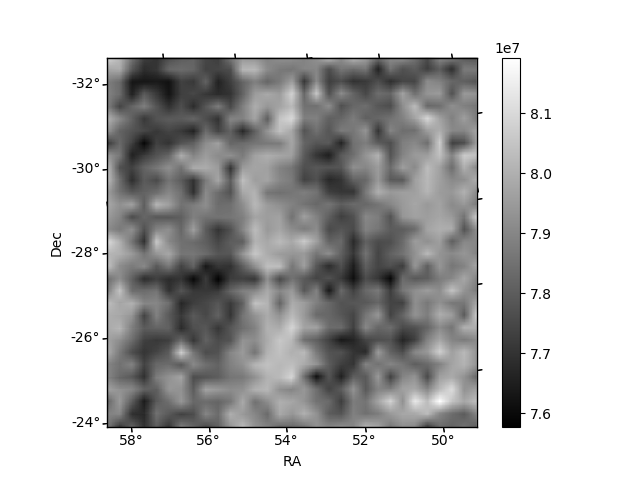
Histogram calculated using DETX and DETY for each event in the final _common_clean file
| Quadrant A | 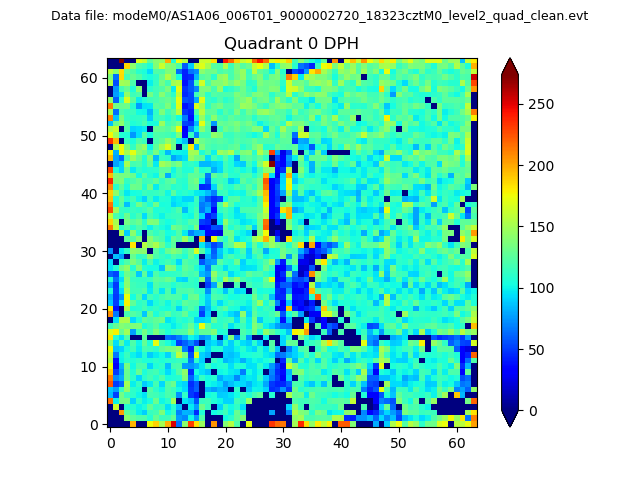 |
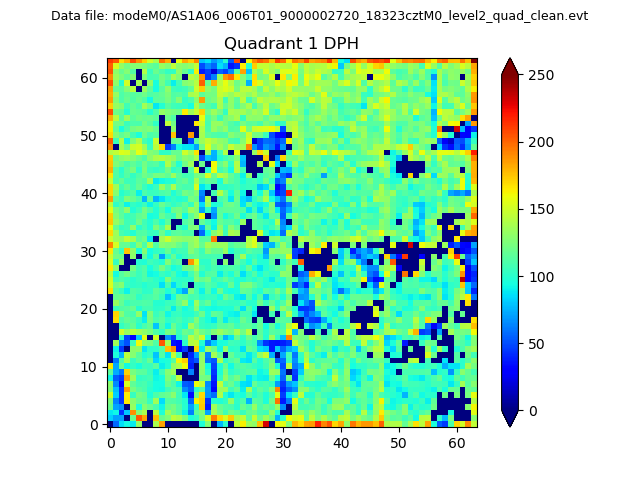 |
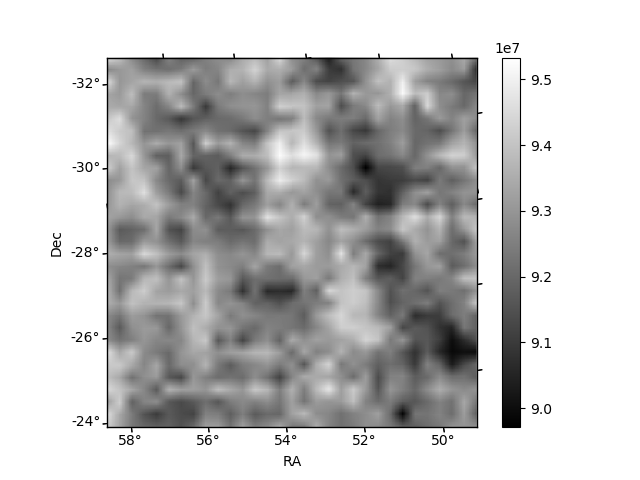
Quadrant B |
|---|---|---|---|
| Quadrant D | 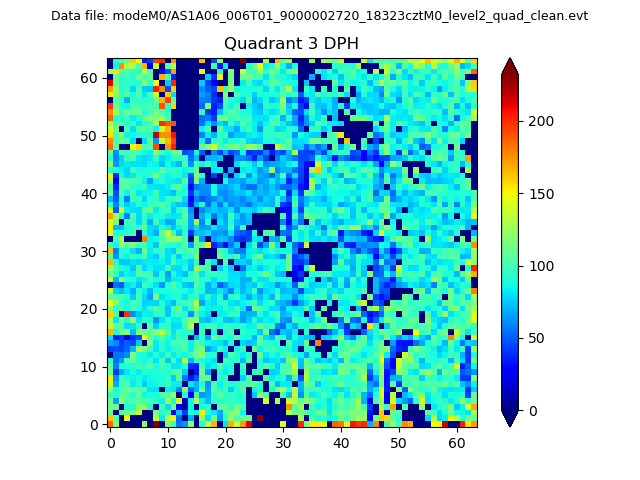 |
 |
Quadrant C |
| Plot type | Count rate plots | Images |
|---|---|---|
| Comparison with Poisson distribution Blue bars denote a histogram of data divided into 1 sec bins. Red curve is a Poisson curve with rate = median count rate of data. |
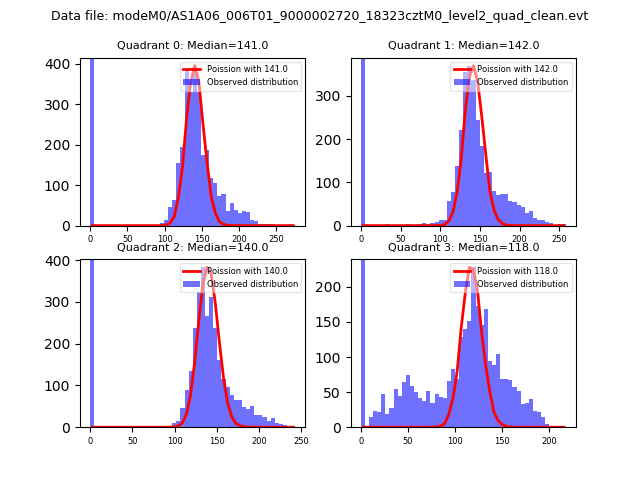 |
 |
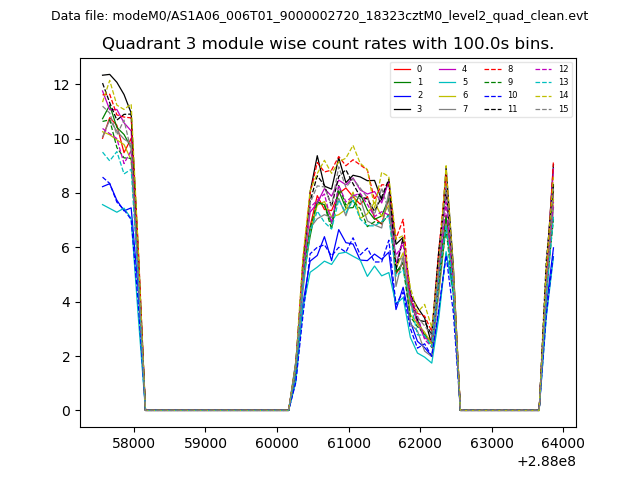
| Quadrant-wise count rates Data is divided into 100 sec bins |
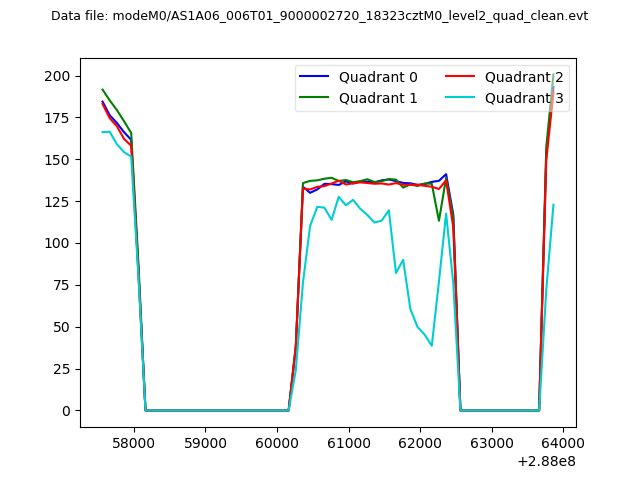 |
|
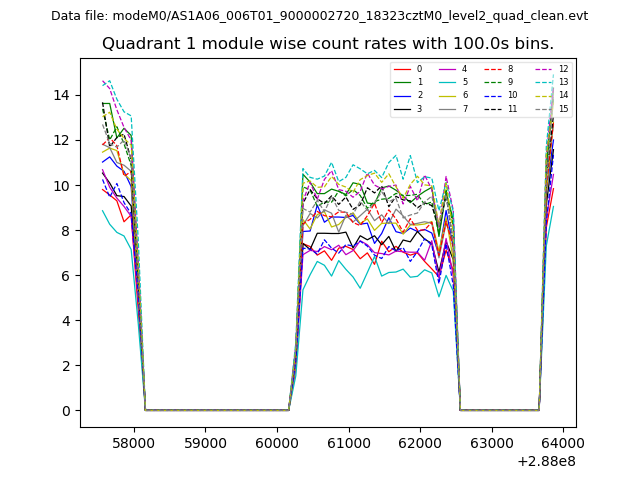
| Module-wise count rates for Quadrant A Data is divided into 100 sec bins |
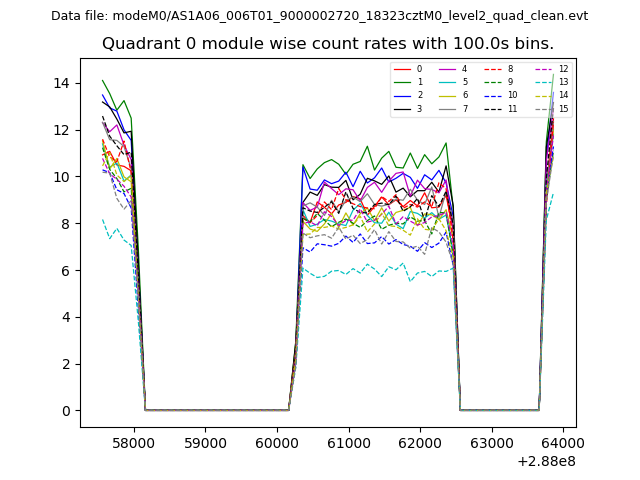 |
 |
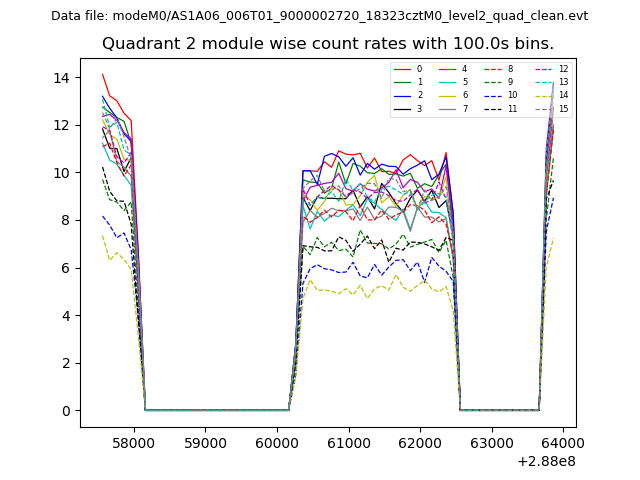
| Module-wise count rates for Quadrant B Data is divided into 100 sec bins |
 |
 |
| Module-wise count rates for Quadrant C Data is divided into 100 sec bins |
 |
 |
| Module-wise count rates for Quadrant D Data is divided into 100 sec bins |
 |
 |
| Parameter | Plot |
|---|---|
| CZT HV Monitor | 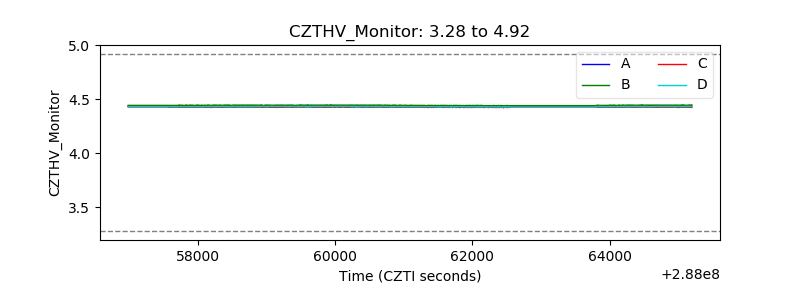 |
| D_VDD | 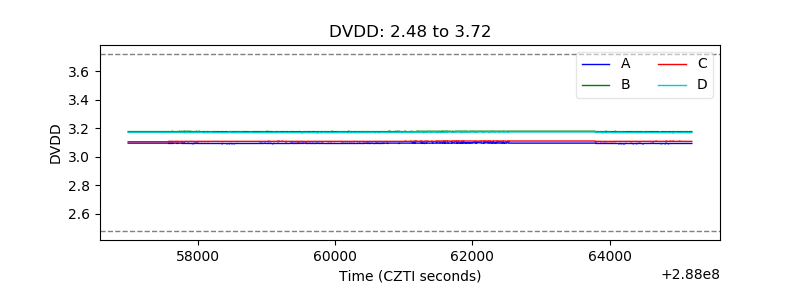 |
| Temperature 1 | 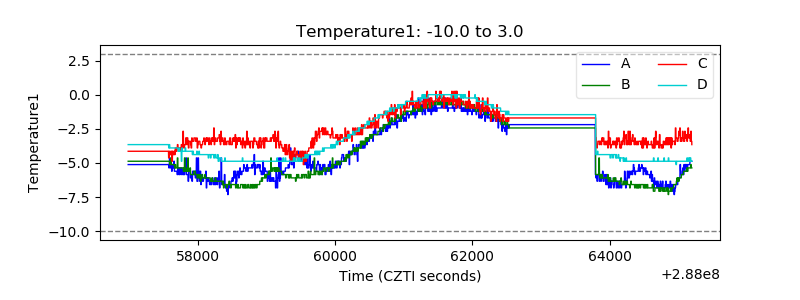 |
| Veto HV Monitor | 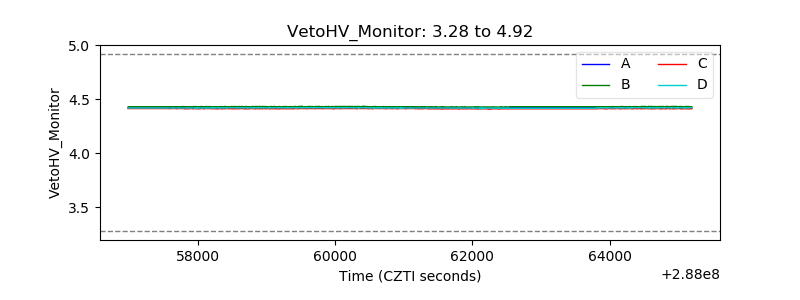 |
| Veto LLD | 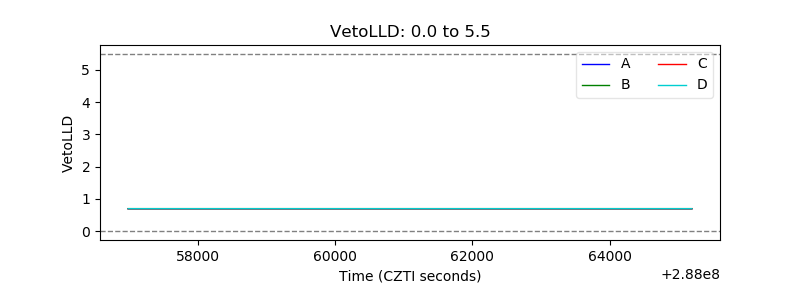 |
| Alpha Counter | 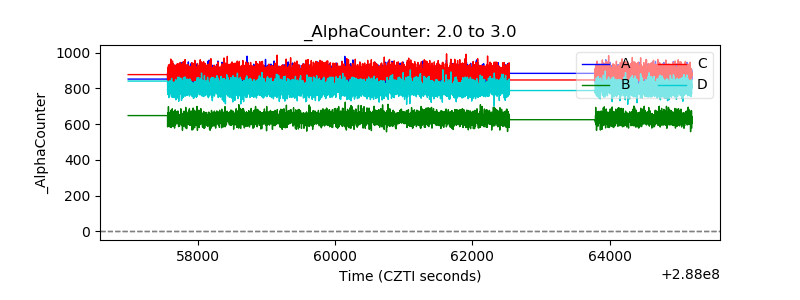 |
| _CPM_Rate | 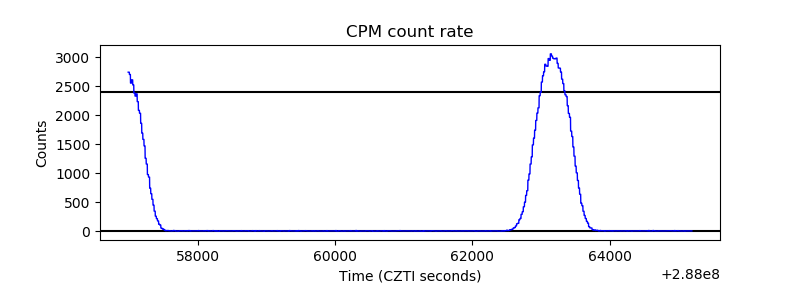 |
| CZT Counter | 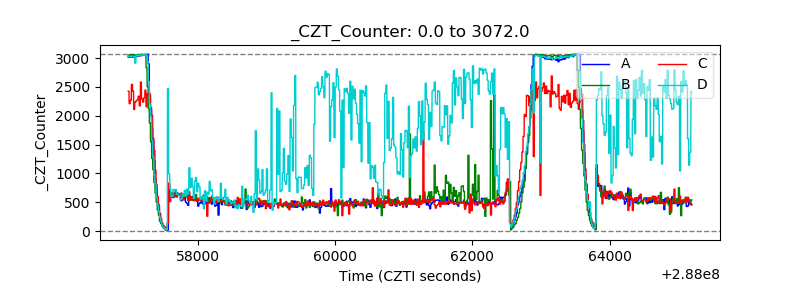 |
| +2.5 Volts monitor |  |
| +5 Volts monitor |  |
| _ROLL_ROT | 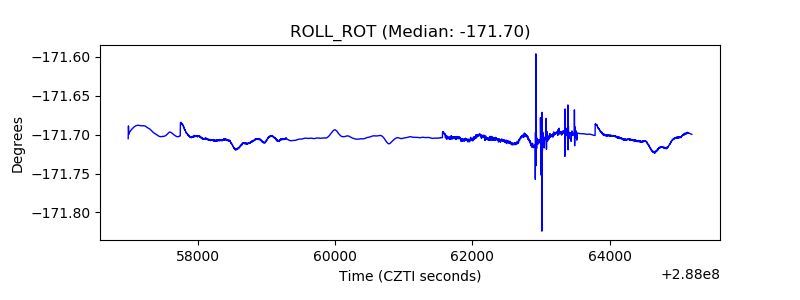 |
| _Roll_DEC | 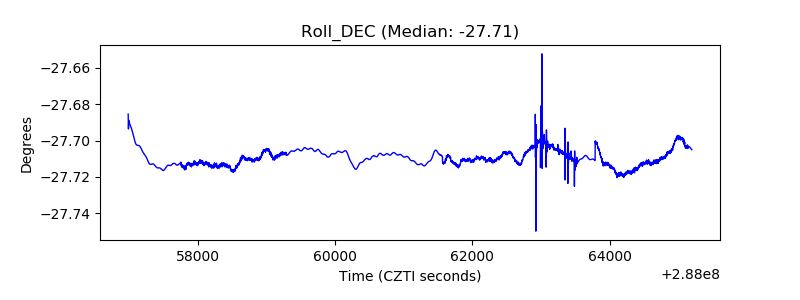 |
| _Roll_RA | 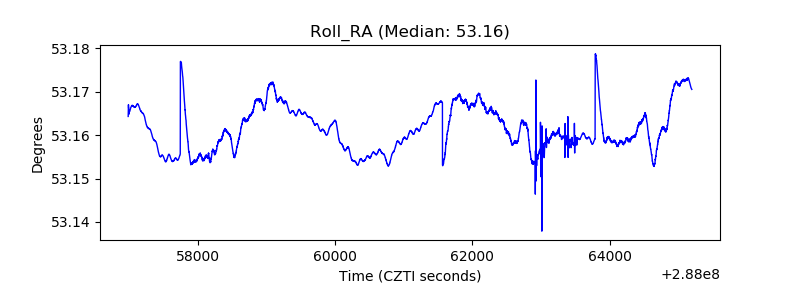 |
| Veto Counter | 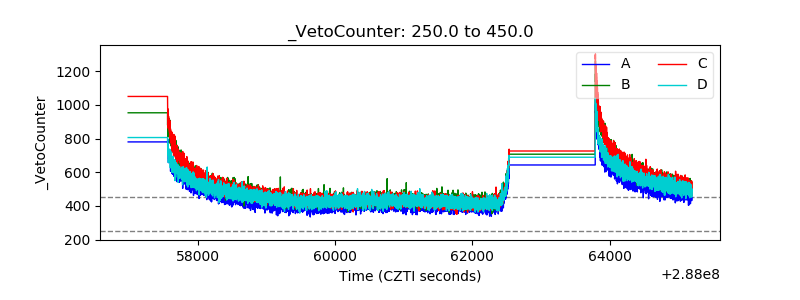 |