| Param | Original file | Final file |
|---|---|---|
| Filename | modeM0/AS1A06_006T01_9000002720_18325cztM0_level2.evt | modeM0/AS1A06_006T01_9000002720_18325cztM0_level2_quad_clean.evt |
| Size (bytes) | 487,802,880 | 69,301,440 |
| Size | 465.2 MB | 66.1 MB |
| Events in quadrant A | 3,257,268 | 422,761 |
| Events in quadrant B | 3,369,222 | 426,650 |
| Events in quadrant C | 4,158,345 | 410,673 |
| Events in quadrant D | 3,569,795 | 407,369 |
| Mode SS | |||
|---|---|---|---|
| Quadrant | BADHDUFLAG | Total packets | Discarded packets |
| A | 0 | 124 | 0 |
| B | 0 | 124 | 0 |
| C | 0 | 124 | 0 |
| D | 0 | 124 | 0 |
| Mode M9 | |||
|---|---|---|---|
| Quadrant | BADHDUFLAG | Total packets | Discarded packets |
| A | 0 | 16 | 0 |
| B | 0 | 17 | 0 |
| C | 0 | 17 | 0 |
| D | 0 | 17 | 0 |
| Mode M0 | |||
|---|---|---|---|
| Quadrant | BADHDUFLAG | Total packets | Discarded packets |
| A | 0 | 13150 | 2 |
| B | 0 | 13519 | 2 |
| C | 0 | 16520 | 2 |
| D | 0 | 14150 | 2 |
| Quadrant | Total seconds | Saturated seconds | Saturation percentage |
|---|---|---|---|
| A | 6170 | 76 | 1.231767% |
| B | 6170 | 107 | 1.734198% |
| C | 6170 | 163 | 2.641815% |
| D | 6170 | 82 | 1.329011% |
Noise dominated data is calculated using 1-second bins in cleaned event files. If a bin has >2000 counts, and if more than 50% of those come from <1% of pixels, then it is considered to be noise-dominated and hence unusable.
| Quadrant | # 1 sec bins | Bins with >0 counts | Bins with >2000 counts | High rate bins dominated by noise | Noise dominated (total time) | Noise dominated (detector-on time) | Marked lightcurve |
|---|---|---|---|---|---|---|---|
| A | 7495 | 6171 | 1 | 1 | 0.01% | 0.02% | 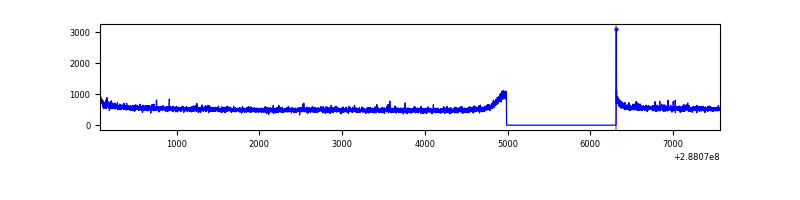 |
| B | 7495 | 6171 | 1 | 1 | 0.01% | 0.02% | 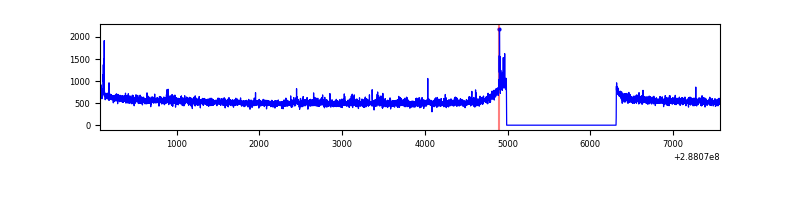 |
| C | 7495 | 6171 | 7 | 7 | 0.09% | 0.11% | 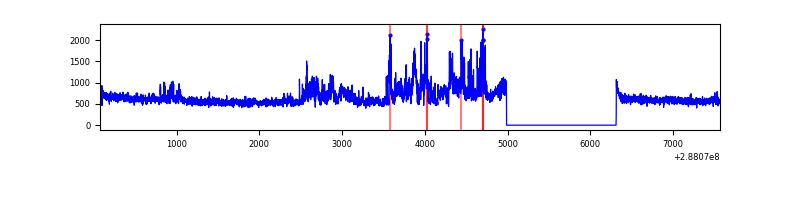 |
| D | 7495 | 6171 | 12 | 12 | 0.16% | 0.19% | 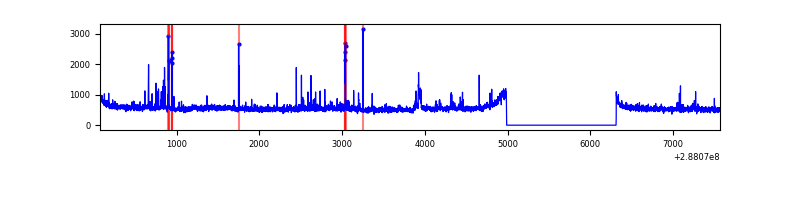 |
Top three noisy pixels from each quadrant. If the there are fewer than three noisy pixels in the level2.evt file, extra rows are filled as -1
| Pixel properties | Quadrant properties | ||||||
|---|---|---|---|---|---|---|---|
| Quadrant | DetID | PixID | Counts | Sigma | Mean | Median | Sigma |
| A | 0 | 226 | 7508 | 39.64 | 846 | 830 | 168.5 |
| A | 4 | 2 | 6456 | 33.4 | 846 | 830 | 168.5 |
| A | 12 | 194 | 6271 | 32.3 | 846 | 830 | 168.5 |
| B | 0 | 189 | 18257 | 110.59 | 847 | 829 | 157.6 |
| B | 12 | 111 | 17165 | 103.66 | 847 | 829 | 157.6 |
| B | 0 | 197 | 16590 | 100.01 | 847 | 829 | 157.6 |
| C | 3 | 233 | 852077 | 4546.6 | 815 | 822 | 187.2 |
| C | 14 | 238 | 127989 | 679.21 | 815 | 822 | 187.2 |
| C | 13 | 61 | 5962 | 27.45 | 815 | 822 | 187.2 |
| D | 2 | 69 | 195431 | 972.46 | 829 | 808 | 200.1 |
| D | 2 | 33 | 46544 | 228.53 | 829 | 808 | 200.1 |
| D | 13 | 168 | 42975 | 210.69 | 829 | 808 | 200.1 |
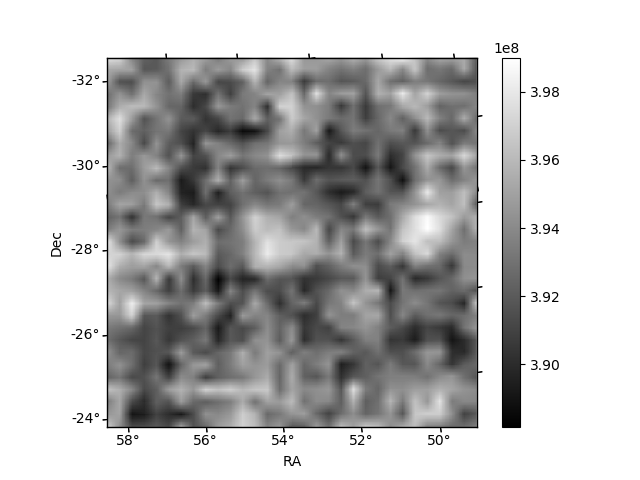
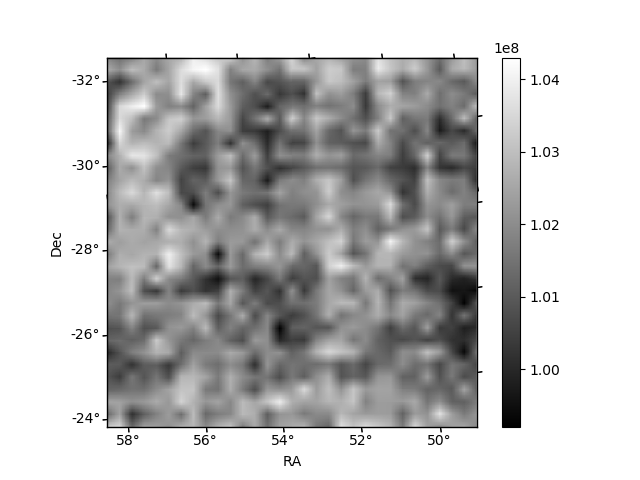
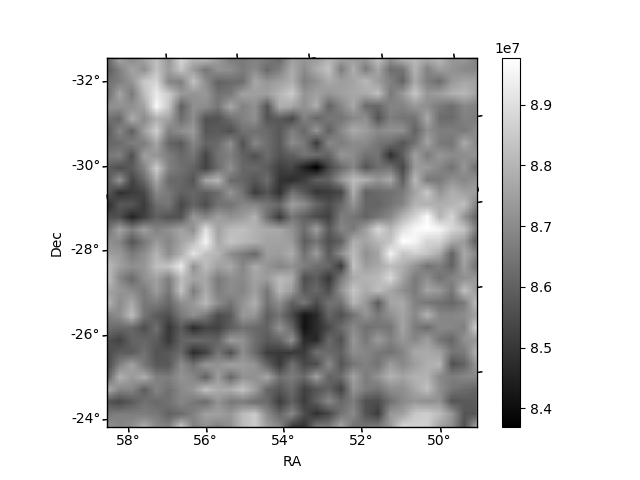
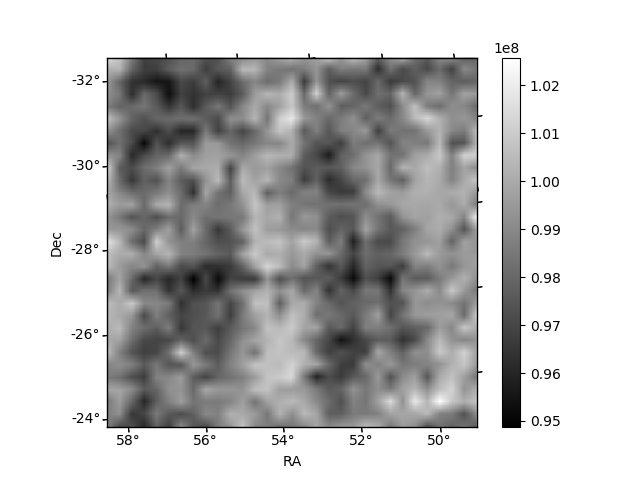
Histogram calculated using DETX and DETY for each event in the final _common_clean file
| Quadrant A | 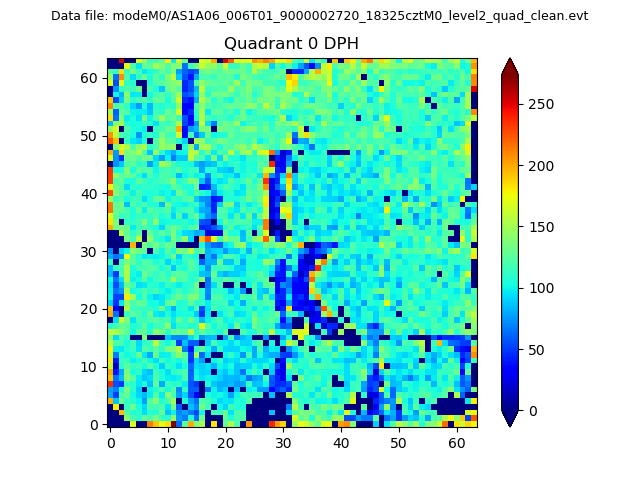 |
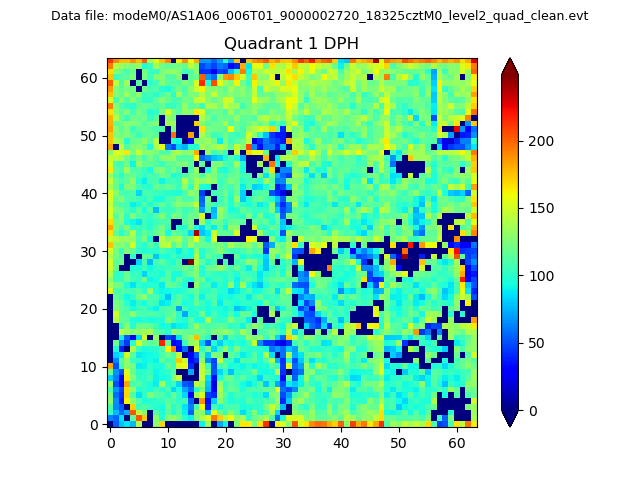 |
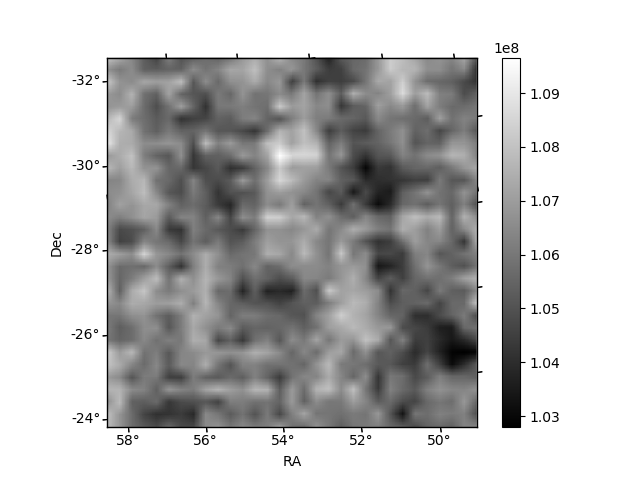
Quadrant B |
|---|---|---|---|
| Quadrant D | 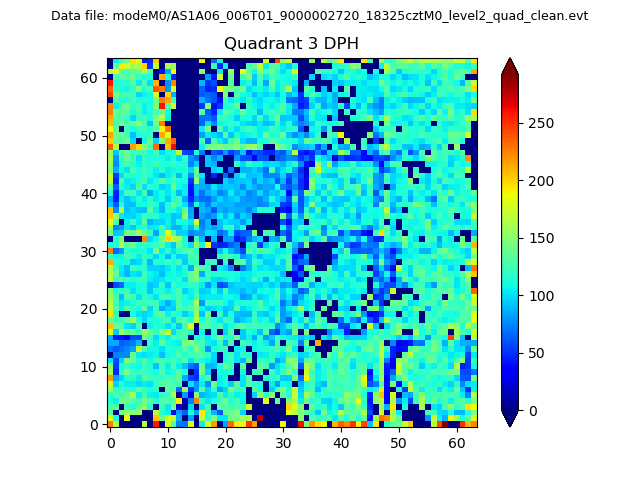 |
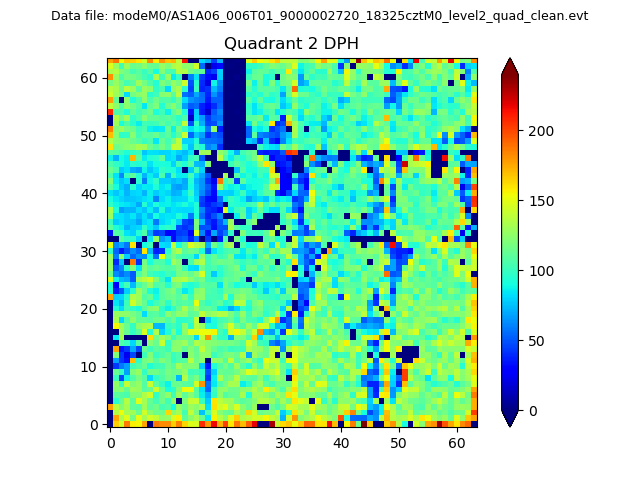 |
Quadrant C |
| Plot type | Count rate plots | Images |
|---|---|---|
| Comparison with Poisson distribution Blue bars denote a histogram of data divided into 1 sec bins. Red curve is a Poisson curve with rate = median count rate of data. |
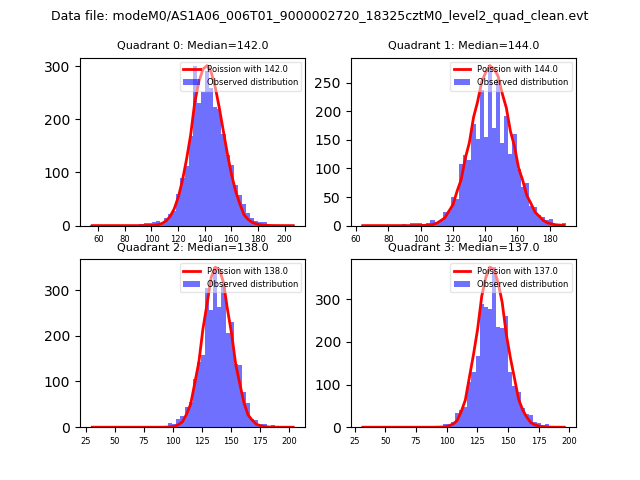 |
 |
| Quadrant-wise count rates Data is divided into 100 sec bins |
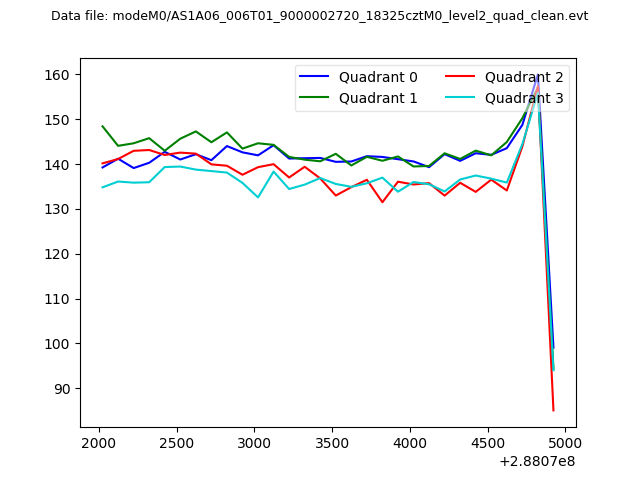 |
|
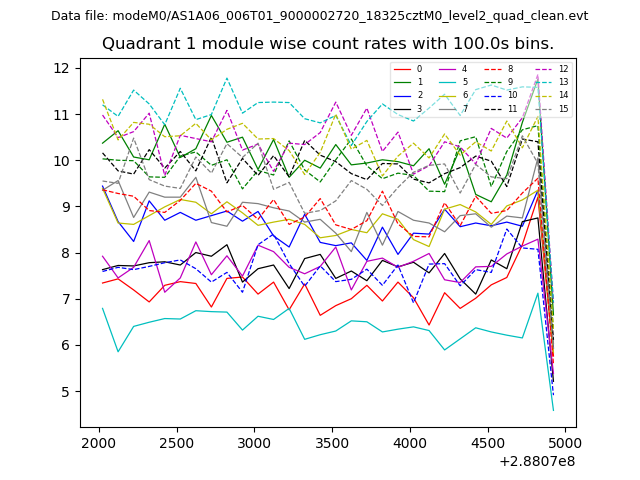
| Module-wise count rates for Quadrant A Data is divided into 100 sec bins |
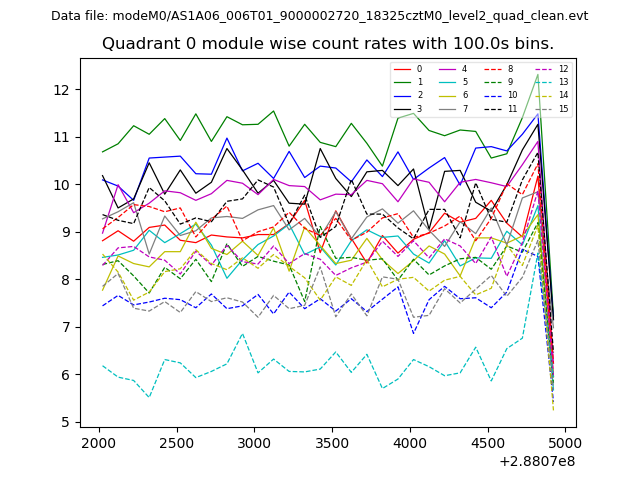 |
 |
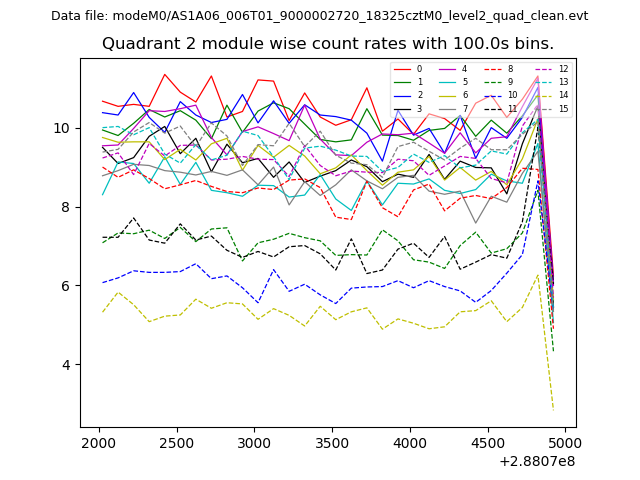
| Module-wise count rates for Quadrant B Data is divided into 100 sec bins |
 |
 |
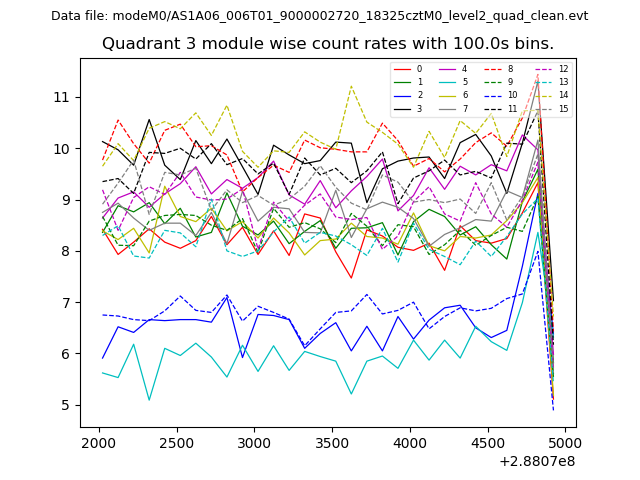
| Module-wise count rates for Quadrant C Data is divided into 100 sec bins |
 |
 |
| Module-wise count rates for Quadrant D Data is divided into 100 sec bins |
 |
 |
| Parameter | Plot |
|---|---|
| CZT HV Monitor | 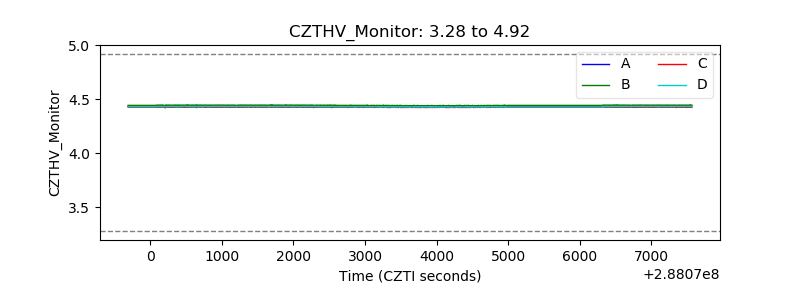 |
| D_VDD | 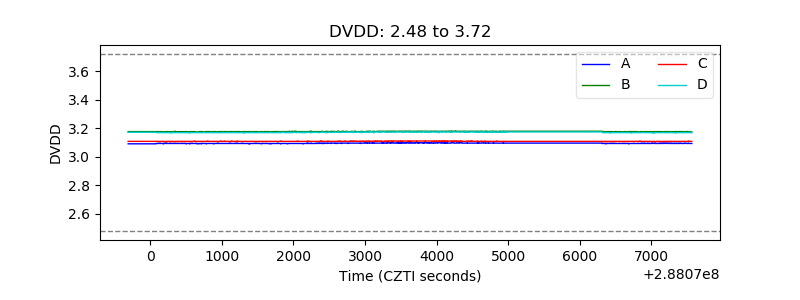 |
| Temperature 1 | 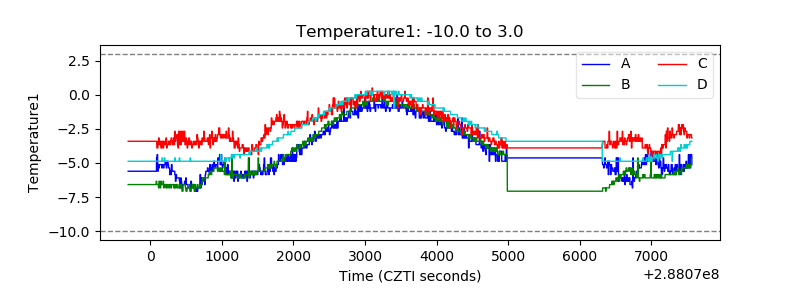 |
| Veto HV Monitor | 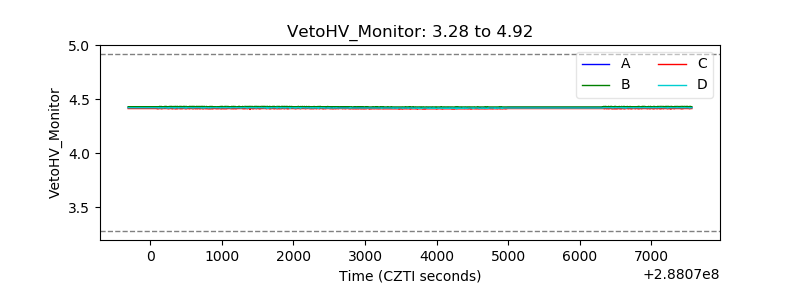 |
| Veto LLD | 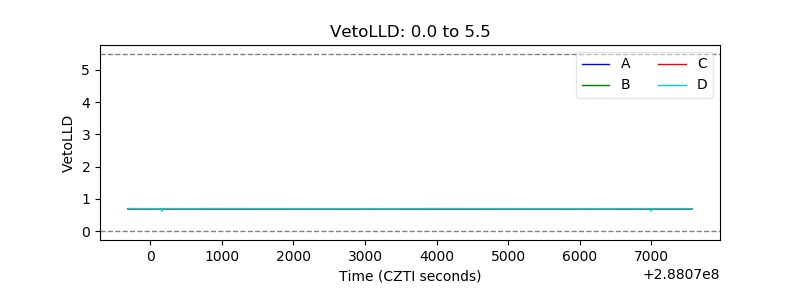 |
| Alpha Counter | 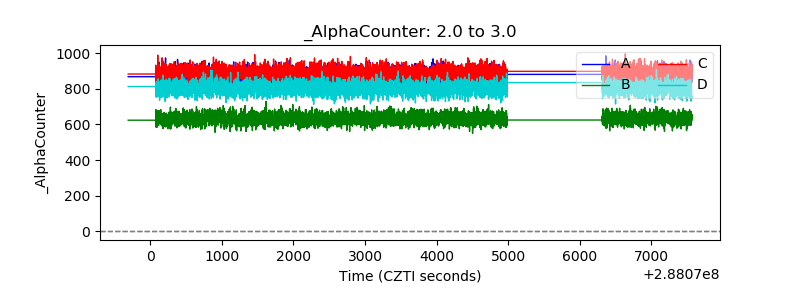 |
| _CPM_Rate | 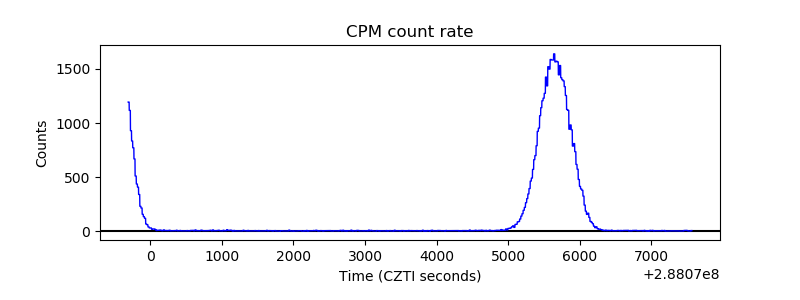 |
| CZT Counter | 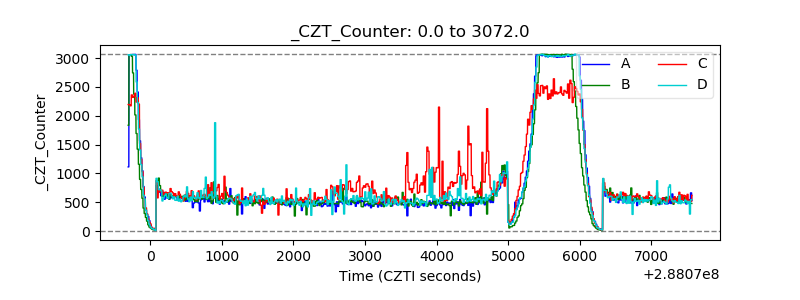 |
| +2.5 Volts monitor |  |
| +5 Volts monitor |  |
| _ROLL_ROT | 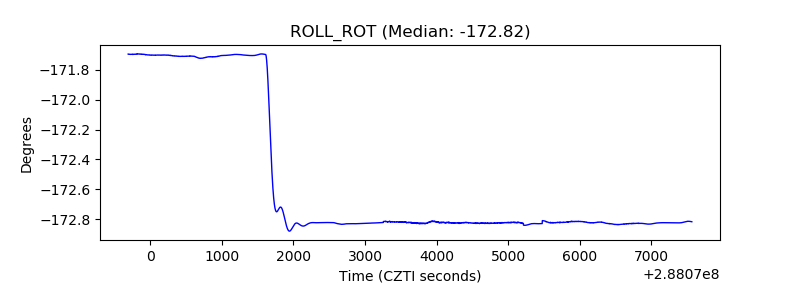 |
| _Roll_DEC | 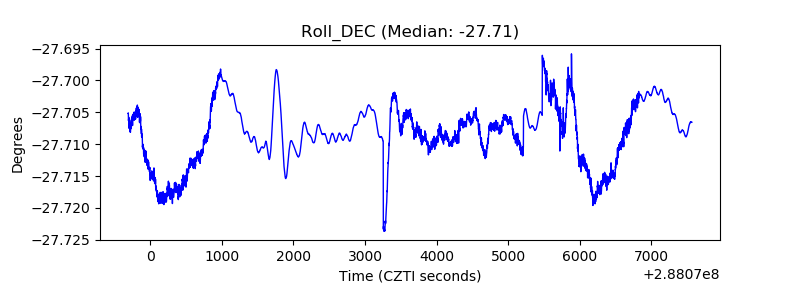 |
| _Roll_RA | 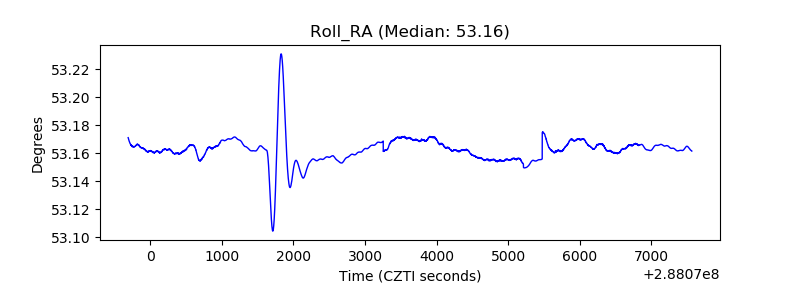 |
| Veto Counter | 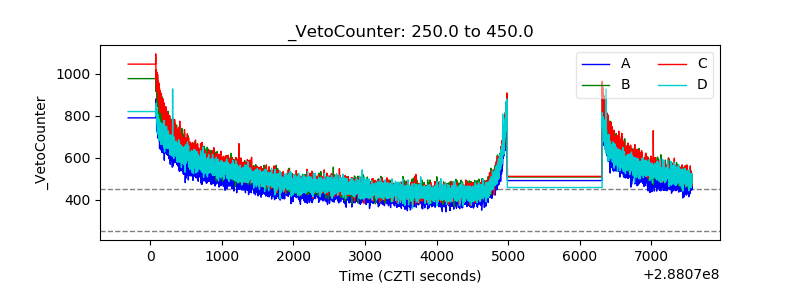 |