| Param | Original file | Final file |
|---|---|---|
| Filename | modeM0/AS1A06_006T01_9000002720_18326cztM0_level2.evt | modeM0/AS1A06_006T01_9000002720_18326cztM0_level2_quad_clean.evt |
| Size (bytes) | 501,955,200 | 80,161,920 |
| Size | 478.7 MB | 76.4 MB |
| Events in quadrant A | 3,315,270 | 503,942 |
| Events in quadrant B | 3,620,406 | 506,122 |
| Events in quadrant C | 3,644,711 | 495,914 |
| Events in quadrant D | 4,192,492 | 480,106 |
| Mode SS | |||
|---|---|---|---|
| Quadrant | BADHDUFLAG | Total packets | Discarded packets |
| A | 0 | 128 | 0 |
| B | 0 | 128 | 0 |
| C | 0 | 128 | 0 |
| D | 0 | 128 | 0 |
| Mode M9 | |||
|---|---|---|---|
| Quadrant | BADHDUFLAG | Total packets | Discarded packets |
| A | 0 | 23 | 0 |
| B | 0 | 24 | 0 |
| C | 0 | 24 | 0 |
| D | 0 | 24 | 0 |
| Mode M0 | |||
|---|---|---|---|
| Quadrant | BADHDUFLAG | Total packets | Discarded packets |
| A | 0 | 13471 | 2 |
| B | 0 | 14429 | 2 |
| C | 0 | 14551 | 2 |
| D | 0 | 16249 | 2 |
| Quadrant | Total seconds | Saturated seconds | Saturation percentage |
|---|---|---|---|
| A | 6324 | 100 | 1.581278% |
| B | 6323 | 158 | 2.498814% |
| C | 6323 | 148 | 2.340661% |
| D | 6323 | 299 | 4.728768% |
Noise dominated data is calculated using 1-second bins in cleaned event files. If a bin has >2000 counts, and if more than 50% of those come from <1% of pixels, then it is considered to be noise-dominated and hence unusable.
| Quadrant | # 1 sec bins | Bins with >0 counts | Bins with >2000 counts | High rate bins dominated by noise | Noise dominated (total time) | Noise dominated (detector-on time) | Marked lightcurve |
|---|---|---|---|---|---|---|---|
| A | 7534 | 6325 | 2 | 2 | 0.03% | 0.03% | 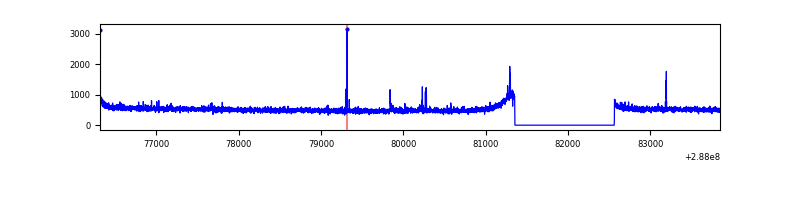 |
| B | 7533 | 6324 | 32 | 32 | 0.42% | 0.51% | 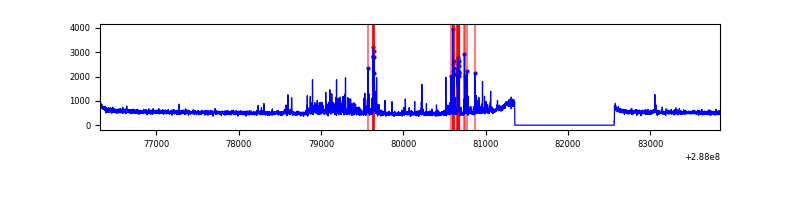 |
| C | 7533 | 6324 | 0 | 0 | 0.00% | 0.00% | 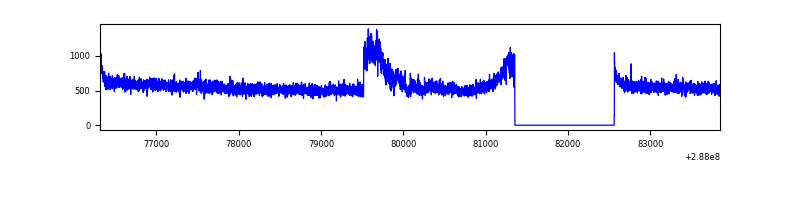 |
| D | 7533 | 6324 | 121 | 121 | 1.61% | 1.91% | 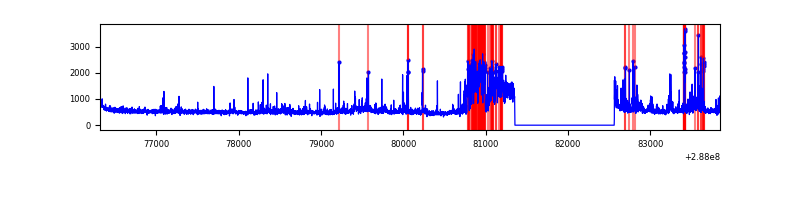 |
Top three noisy pixels from each quadrant. If the there are fewer than three noisy pixels in the level2.evt file, extra rows are filled as -1
| Pixel properties | Quadrant properties | ||||||
|---|---|---|---|---|---|---|---|
| Quadrant | DetID | PixID | Counts | Sigma | Mean | Median | Sigma |
| A | 15 | 174 | 45499 | 262.94 | 847 | 830 | 169.9 |
| A | 4 | 2 | 11605 | 63.43 | 847 | 830 | 169.9 |
| A | 0 | 226 | 7614 | 39.93 | 847 | 830 | 169.9 |
| B | 7 | 220 | 189302 | 1192.15 | 842 | 824 | 158.1 |
| B | 4 | 48 | 76271 | 477.21 | 842 | 824 | 158.1 |
| B | 0 | 197 | 35814 | 221.32 | 842 | 824 | 158.1 |
| C | 3 | 233 | 351290 | 1860.76 | 812 | 819 | 188.3 |
| C | 14 | 238 | 127049 | 670.2 | 812 | 819 | 188.3 |
| C | 13 | 61 | 5787 | 26.38 | 812 | 819 | 188.3 |
| D | 1 | 52 | 743413 | 3744.21 | 818 | 795 | 198.3 |
| D | 13 | 168 | 110708 | 554.17 | 818 | 795 | 198.3 |
| D | 7 | 238 | 101954 | 510.03 | 818 | 795 | 198.3 |
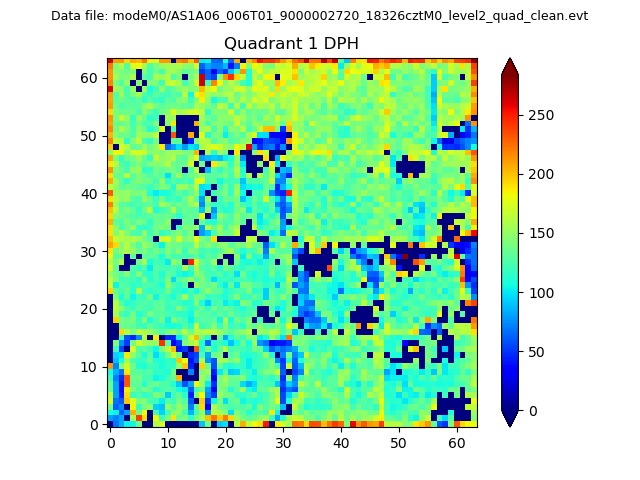
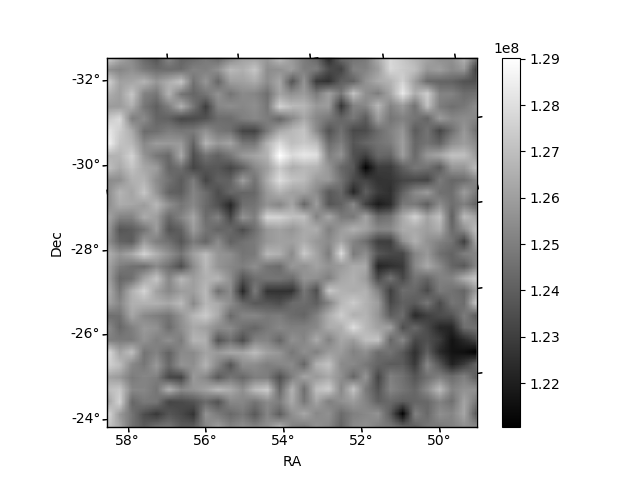
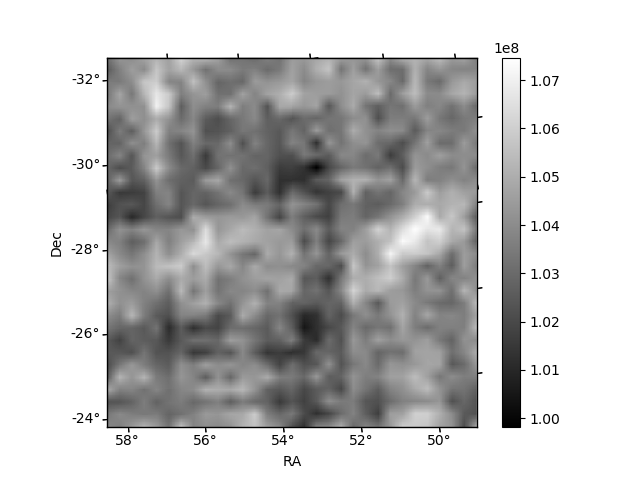
Histogram calculated using DETX and DETY for each event in the final _common_clean file
| Quadrant A |  |
 |
Quadrant B |
|---|---|---|---|
| Quadrant D | 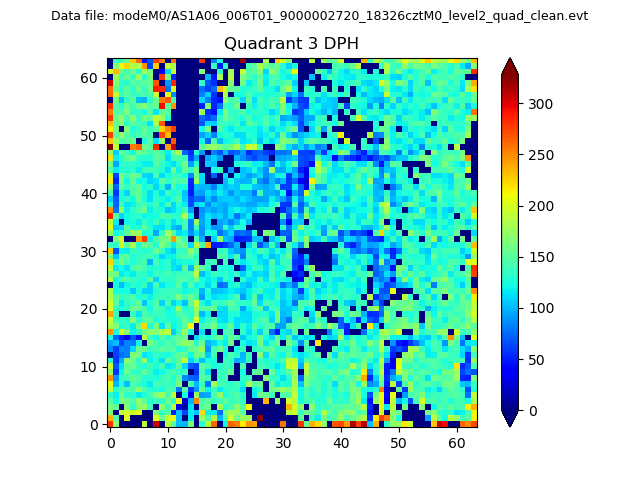 |
 |
Quadrant C |
| Plot type | Count rate plots | Images |
|---|---|---|
| Comparison with Poisson distribution Blue bars denote a histogram of data divided into 1 sec bins. Red curve is a Poisson curve with rate = median count rate of data. |
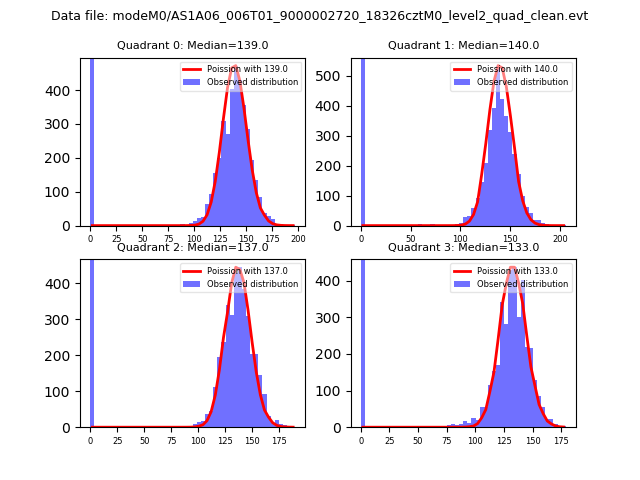 |
 |
| Quadrant-wise count rates Data is divided into 100 sec bins |
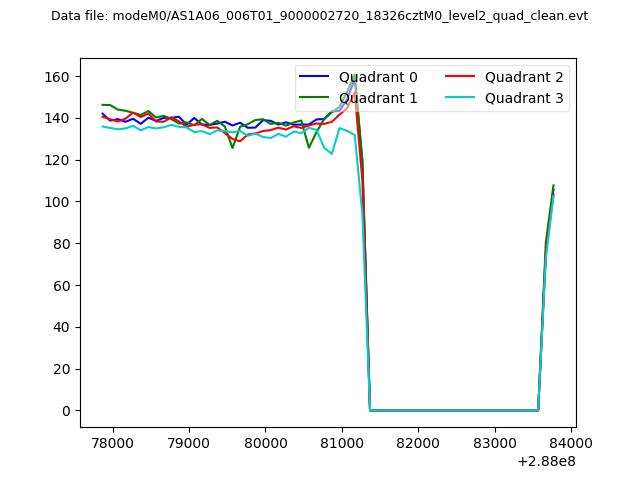 |
|
| Module-wise count rates for Quadrant A Data is divided into 100 sec bins |
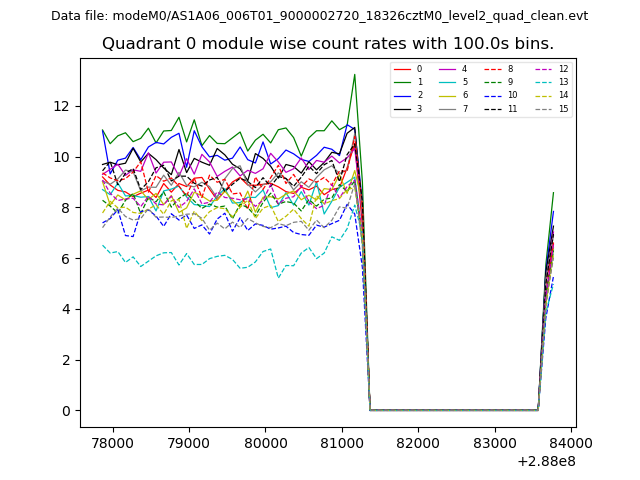 |
 |
| Module-wise count rates for Quadrant B Data is divided into 100 sec bins |
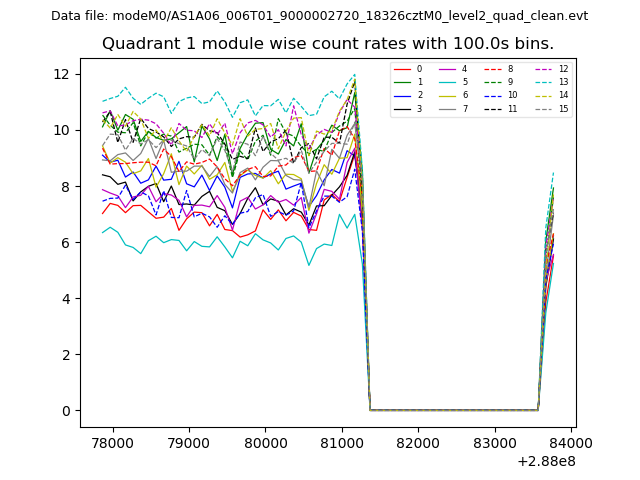 |
 |
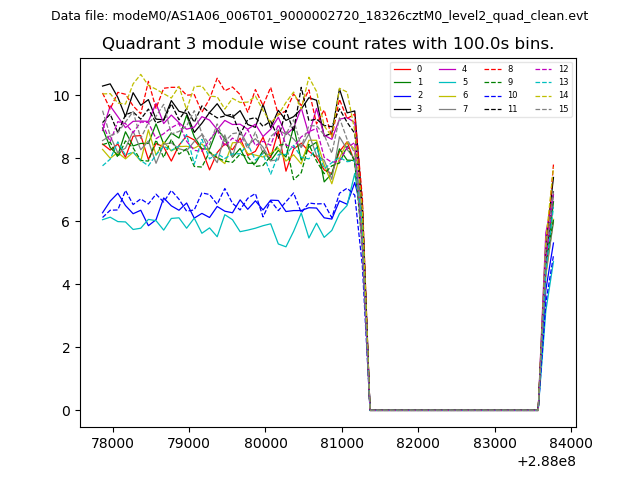
| Module-wise count rates for Quadrant C Data is divided into 100 sec bins |
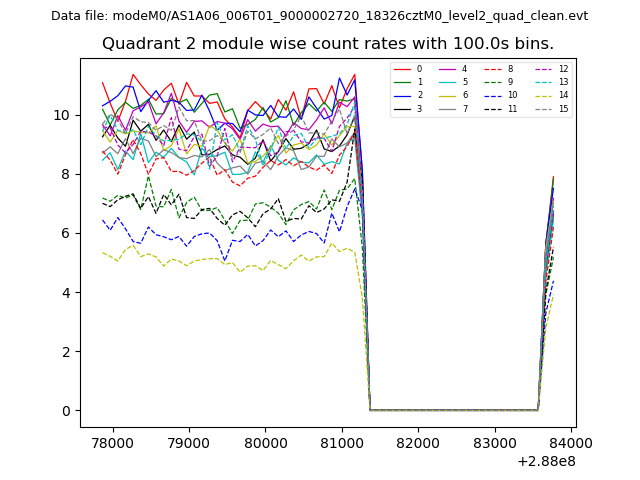 |
 |
| Module-wise count rates for Quadrant D Data is divided into 100 sec bins |
 |
 |
| Parameter | Plot |
|---|---|
| CZT HV Monitor | 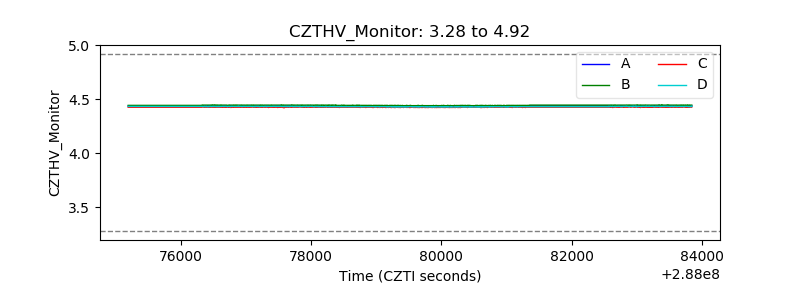 |
| D_VDD | 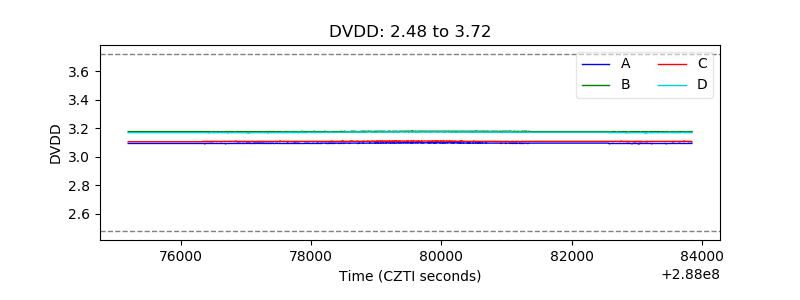 |
| Temperature 1 | 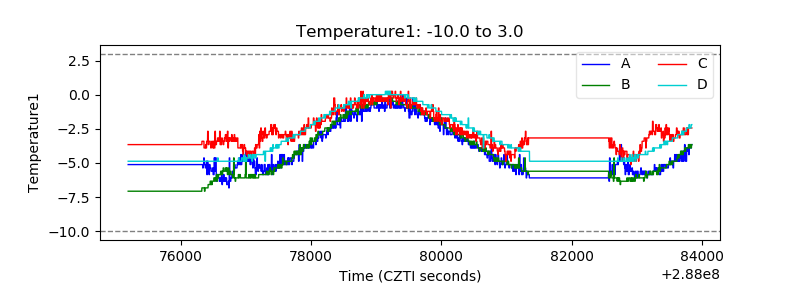 |
| Veto HV Monitor | 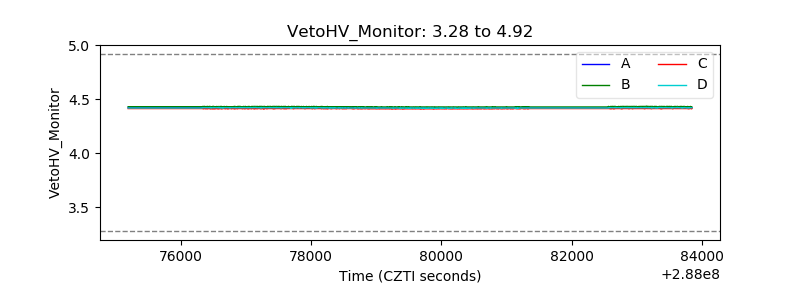 |
| Veto LLD | 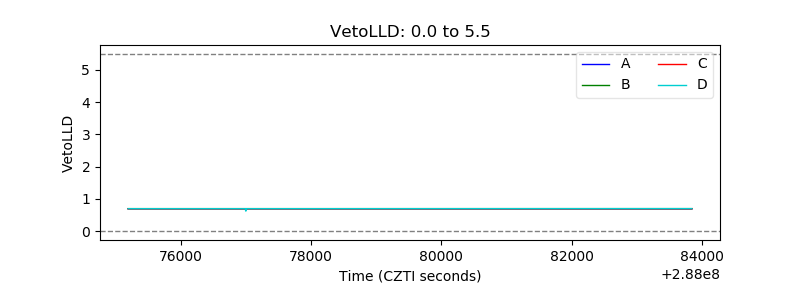 |
| Alpha Counter | 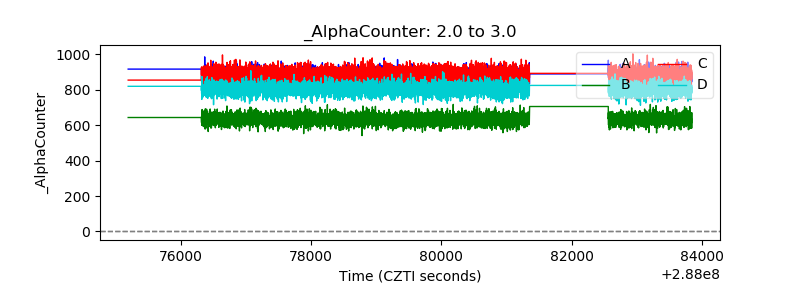 |
| _CPM_Rate | 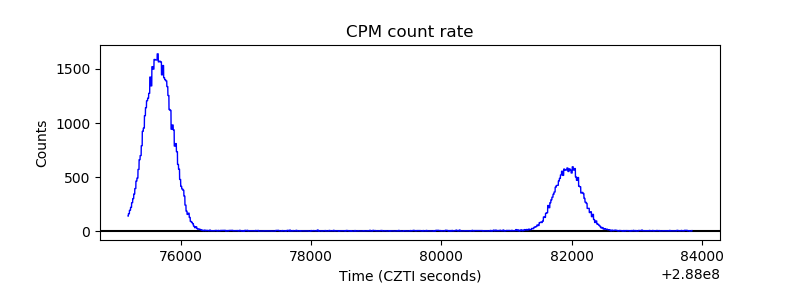 |
| CZT Counter |  |
| +2.5 Volts monitor |  |
| +5 Volts monitor |  |
| _ROLL_ROT | 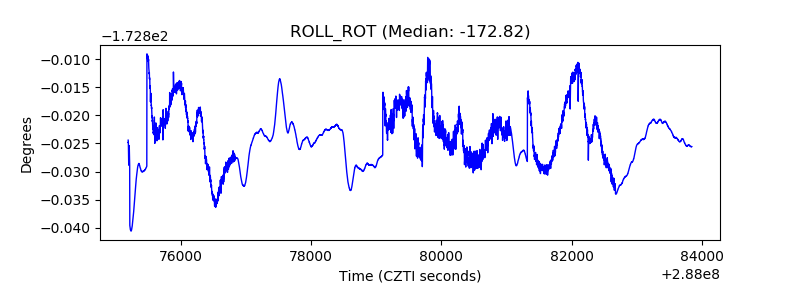 |
| _Roll_DEC | 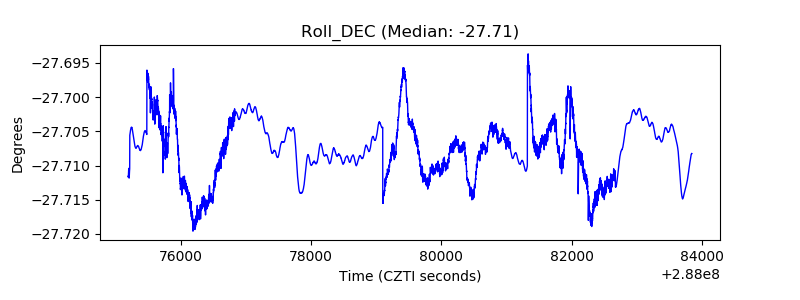 |
| _Roll_RA | 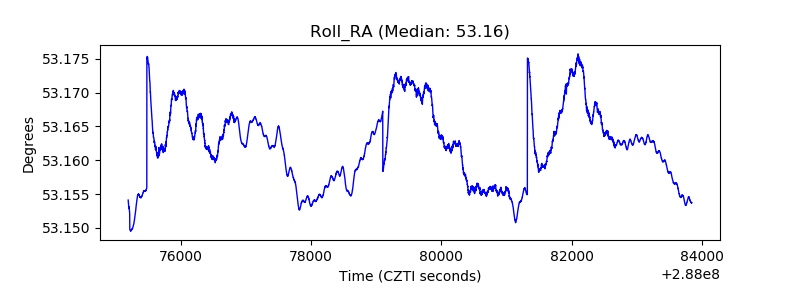 |
| Veto Counter | 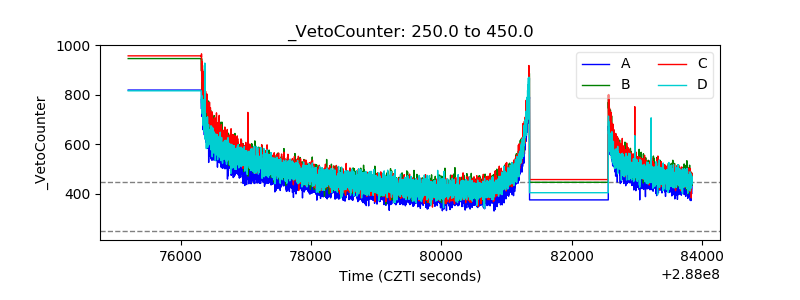 |