| Param | Original file | Final file |
|---|---|---|
| Filename | modeM0/AS1A06_006T01_9000002720_18327cztM0_level2.evt | modeM0/AS1A06_006T01_9000002720_18327cztM0_level2_quad_clean.evt |
| Size (bytes) | 512,357,760 | 89,043,840 |
| Size | 488.6 MB | 84.9 MB |
| Events in quadrant A | 3,417,352 | 563,355 |
| Events in quadrant B | 3,569,718 | 568,328 |
| Events in quadrant C | 3,534,118 | 556,213 |
| Events in quadrant D | 4,535,526 | 536,223 |
| Mode SS | |||
|---|---|---|---|
| Quadrant | BADHDUFLAG | Total packets | Discarded packets |
| A | 0 | 140 | 0 |
| B | 0 | 140 | 0 |
| C | 0 | 140 | 0 |
| D | 0 | 140 | 0 |
| Mode M9 | |||
|---|---|---|---|
| Quadrant | BADHDUFLAG | Total packets | Discarded packets |
| A | 0 | 13 | 0 |
| B | 0 | 14 | 0 |
| C | 0 | 14 | 0 |
| D | 0 | 14 | 0 |
| Mode M0 | |||
|---|---|---|---|
| Quadrant | BADHDUFLAG | Total packets | Discarded packets |
| A | 0 | 14251 | 3 |
| B | 0 | 14606 | 3 |
| C | 0 | 14303 | 3 |
| D | 0 | 17823 | 3 |
| Quadrant | Total seconds | Saturated seconds | Saturation percentage |
|---|---|---|---|
| A | 6768 | 141 | 2.083333% |
| B | 6768 | 144 | 2.127660% |
| C | 6768 | 154 | 2.275414% |
| D | 6768 | 291 | 4.299645% |
Noise dominated data is calculated using 1-second bins in cleaned event files. If a bin has >2000 counts, and if more than 50% of those come from <1% of pixels, then it is considered to be noise-dominated and hence unusable.
| Quadrant | # 1 sec bins | Bins with >0 counts | Bins with >2000 counts | High rate bins dominated by noise | Noise dominated (total time) | Noise dominated (detector-on time) | Marked lightcurve |
|---|---|---|---|---|---|---|---|
| A | 7643 | 6770 | 20 | 20 | 0.26% | 0.30% | 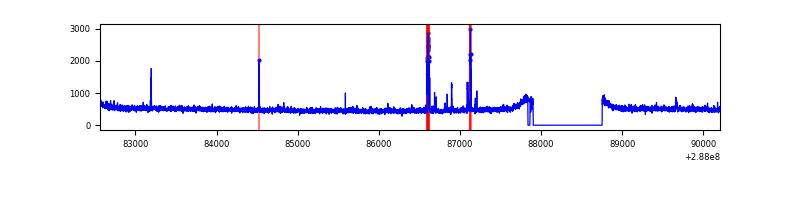 |
| B | 7643 | 6770 | 3 | 3 | 0.04% | 0.04% | 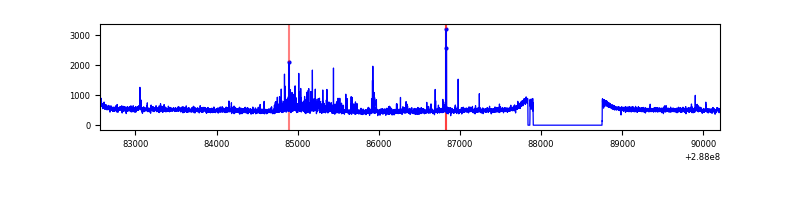 |
| C | 7643 | 6770 | 2 | 2 | 0.03% | 0.03% | 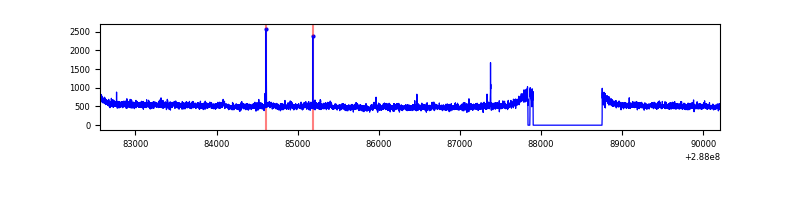 |
| D | 7643 | 6770 | 153 | 153 | 2.00% | 2.26% | 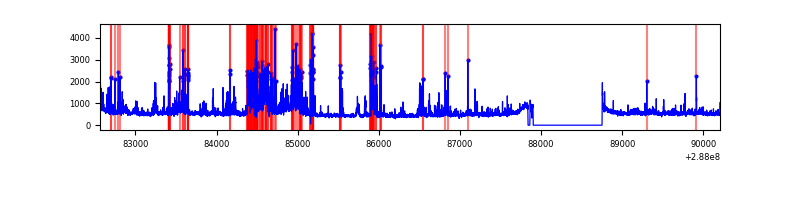 |
Top three noisy pixels from each quadrant. If the there are fewer than three noisy pixels in the level2.evt file, extra rows are filled as -1
| Pixel properties | Quadrant properties | ||||||
|---|---|---|---|---|---|---|---|
| Quadrant | DetID | PixID | Counts | Sigma | Mean | Median | Sigma |
| A | 15 | 174 | 85508 | 486.47 | 864 | 845 | 174.0 |
| A | 0 | 226 | 7630 | 38.99 | 864 | 845 | 174.0 |
| A | 4 | 2 | 6596 | 33.05 | 864 | 845 | 174.0 |
| B | 7 | 220 | 161812 | 990.43 | 860 | 840 | 162.5 |
| B | 12 | 111 | 18808 | 110.55 | 860 | 840 | 162.5 |
| B | 0 | 197 | 18417 | 108.15 | 860 | 840 | 162.5 |
| C | 3 | 233 | 166600 | 859.88 | 827 | 831 | 192.8 |
| C | 14 | 238 | 128716 | 663.37 | 827 | 831 | 192.8 |
| C | 0 | 207 | 9522 | 45.08 | 827 | 831 | 192.8 |
| D | 1 | 52 | 995849 | 4926.65 | 837 | 814 | 202.0 |
| D | 7 | 238 | 132506 | 652.04 | 837 | 814 | 202.0 |
| D | 2 | 69 | 111344 | 547.26 | 837 | 814 | 202.0 |
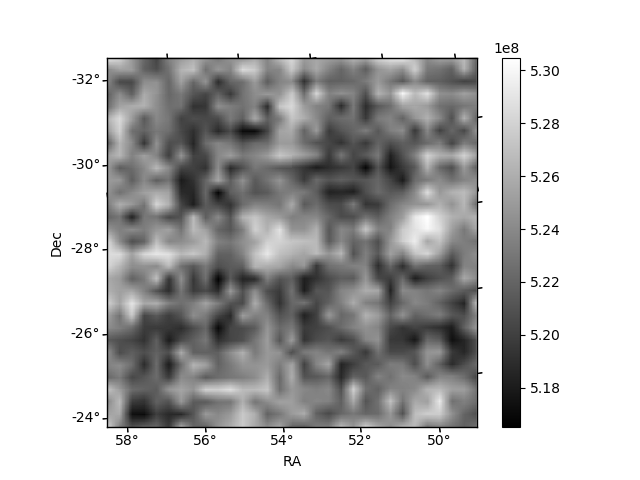
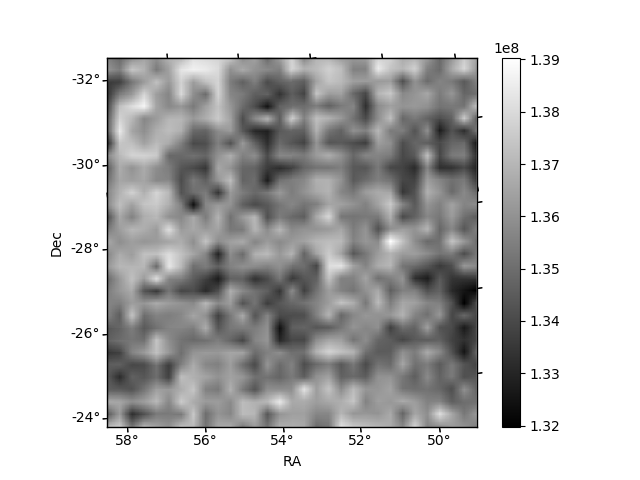
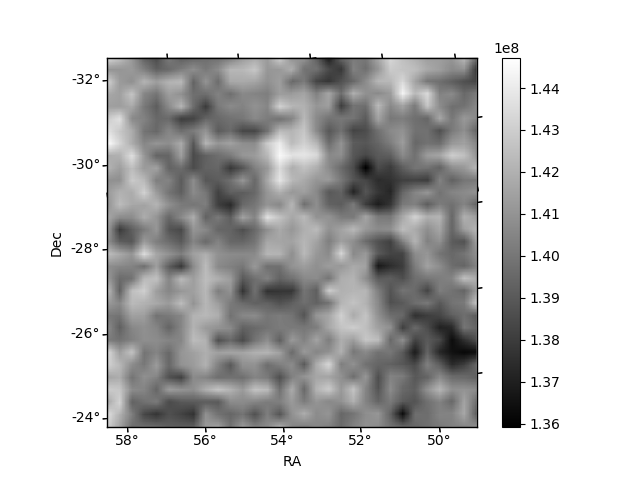
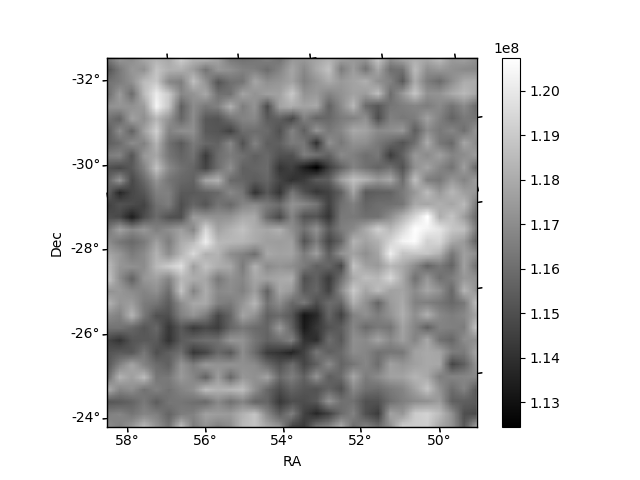
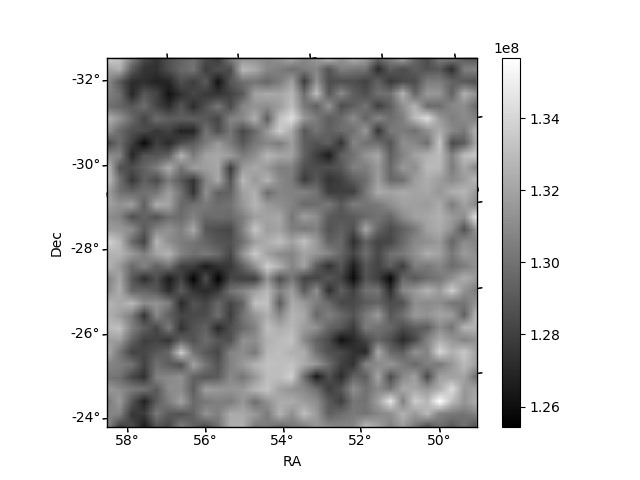
Histogram calculated using DETX and DETY for each event in the final _common_clean file
| Quadrant A | 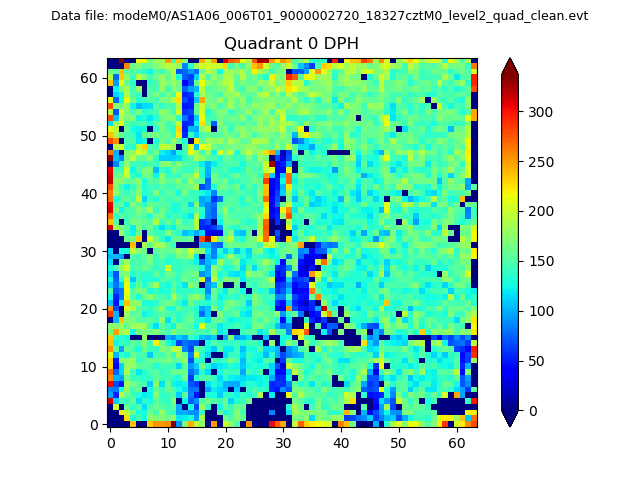 |
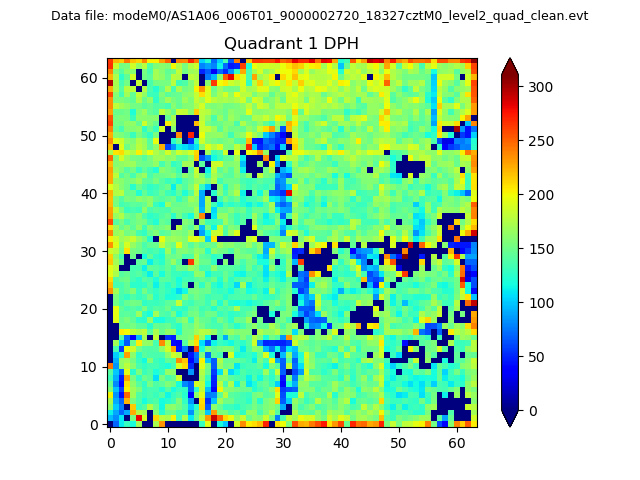 |
Quadrant B |
|---|---|---|---|
| Quadrant D | 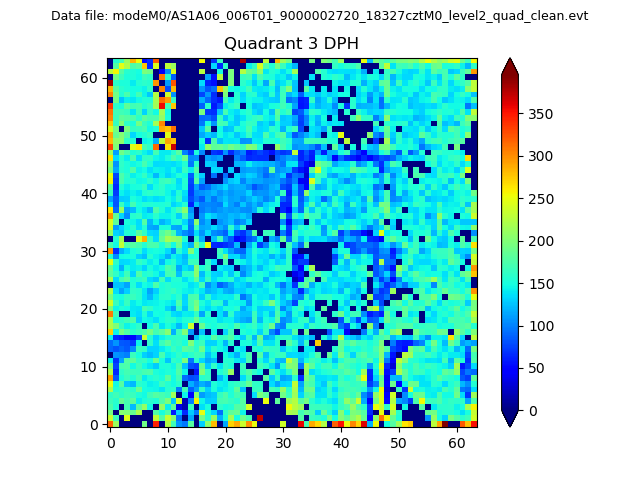 |
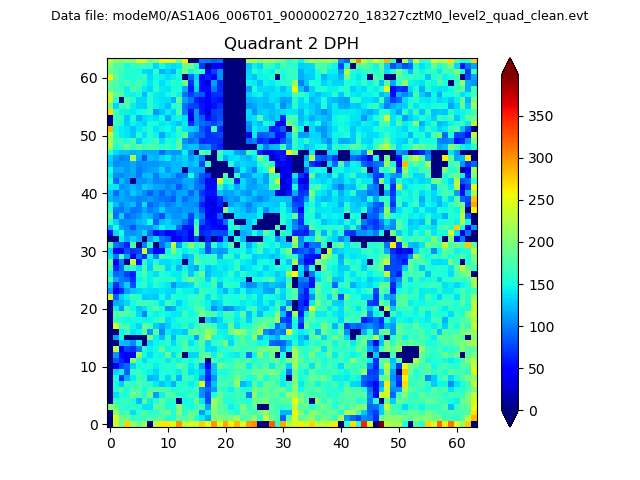 |
Quadrant C |
| Plot type | Count rate plots | Images |
|---|---|---|
| Comparison with Poisson distribution Blue bars denote a histogram of data divided into 1 sec bins. Red curve is a Poisson curve with rate = median count rate of data. |
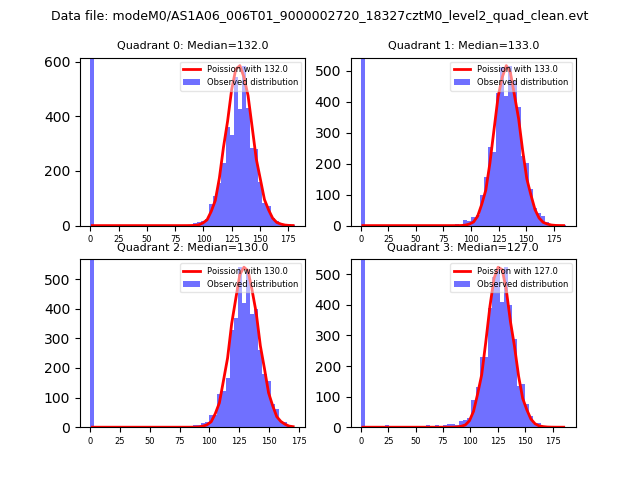 |
 |
| Quadrant-wise count rates Data is divided into 100 sec bins |
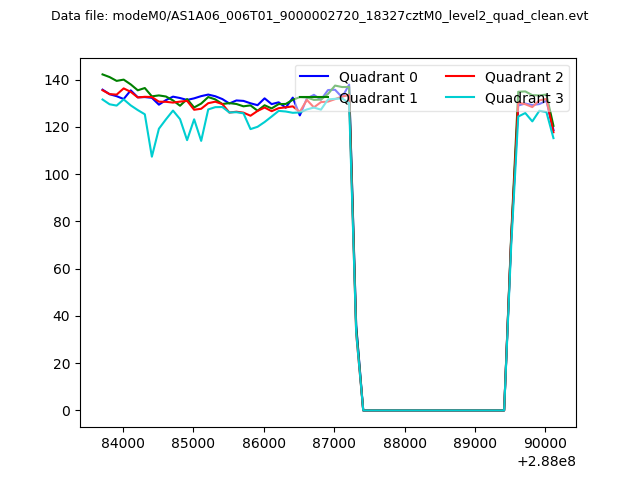 |
|
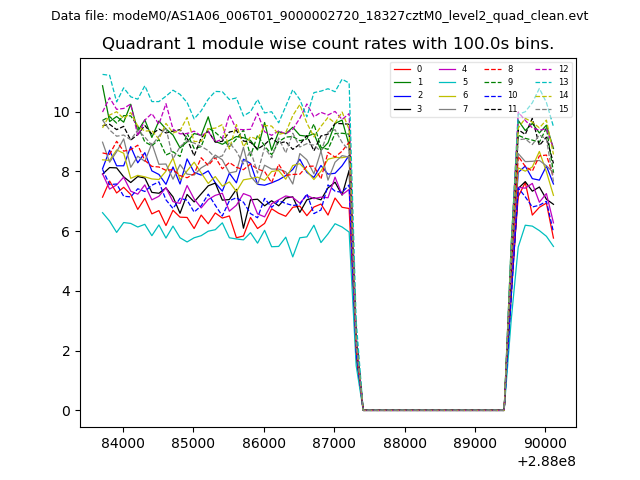
| Module-wise count rates for Quadrant A Data is divided into 100 sec bins |
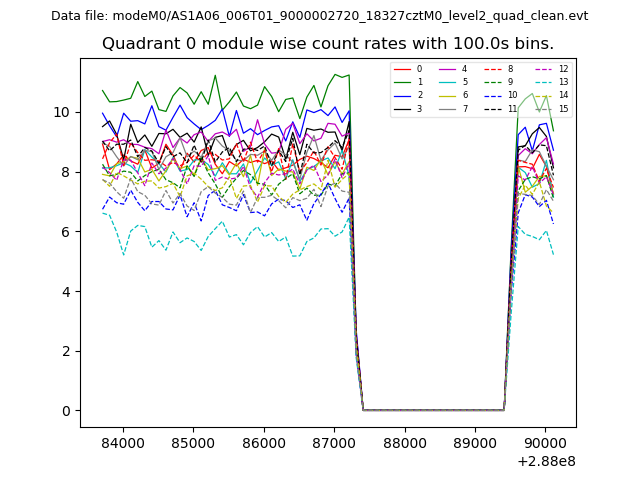 |
 |
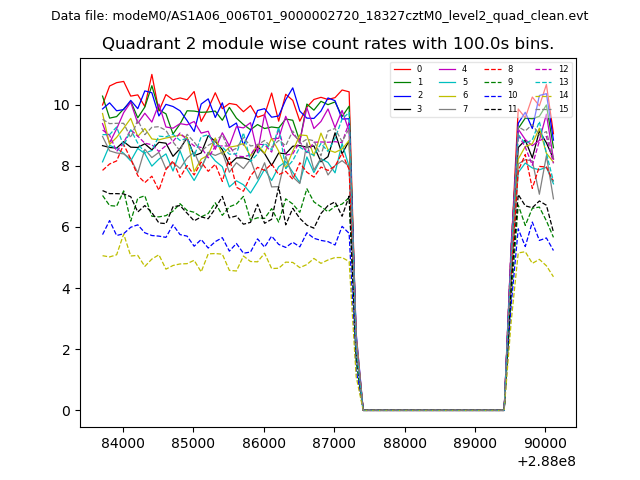
| Module-wise count rates for Quadrant B Data is divided into 100 sec bins |
 |
 |
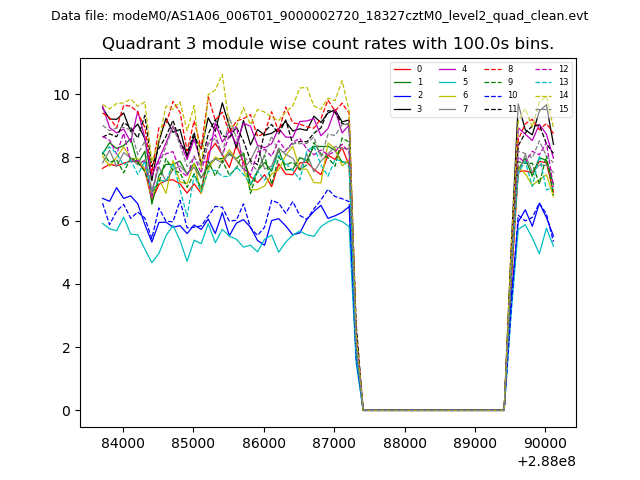
| Module-wise count rates for Quadrant C Data is divided into 100 sec bins |
 |
 |
| Module-wise count rates for Quadrant D Data is divided into 100 sec bins |
 |
 |
| Parameter | Plot |
|---|---|
| CZT HV Monitor | 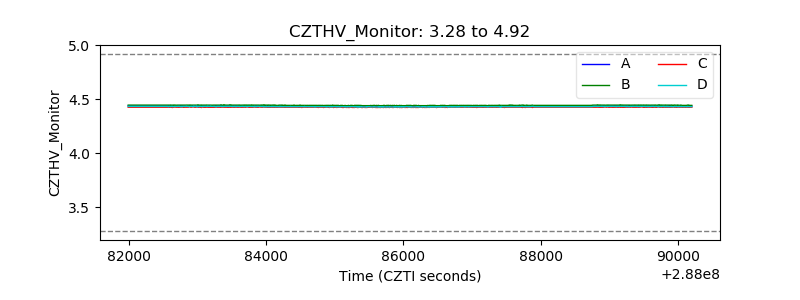 |
| D_VDD | 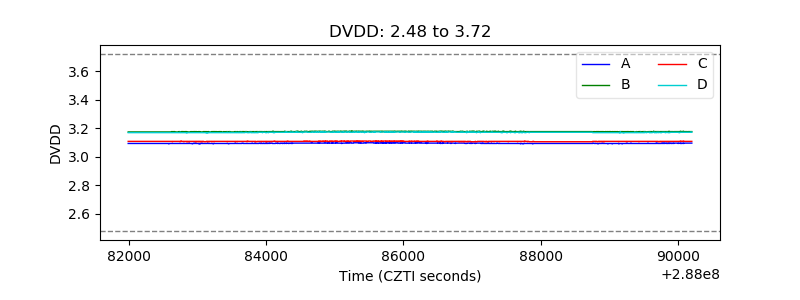 |
| Temperature 1 | 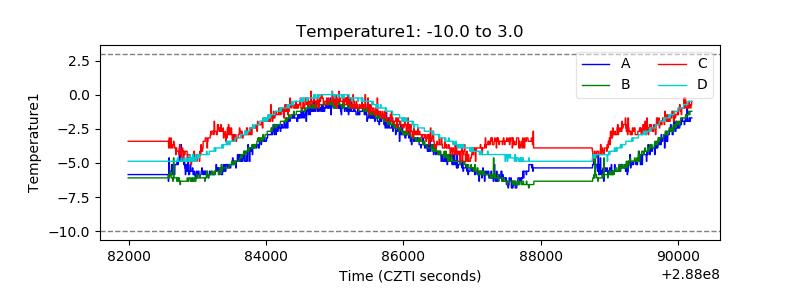 |
| Veto HV Monitor | 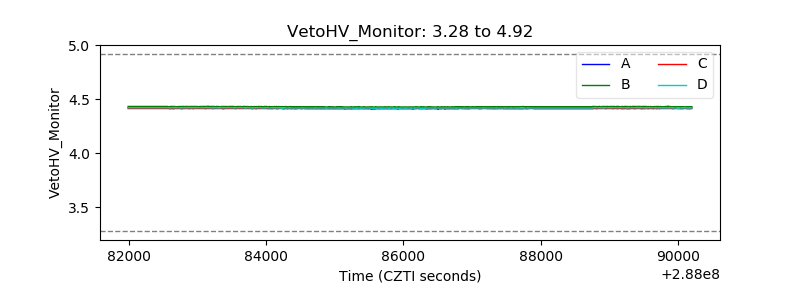 |
| Veto LLD | 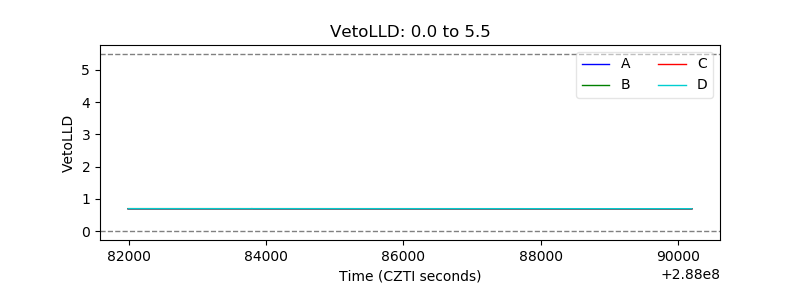 |
| Alpha Counter | 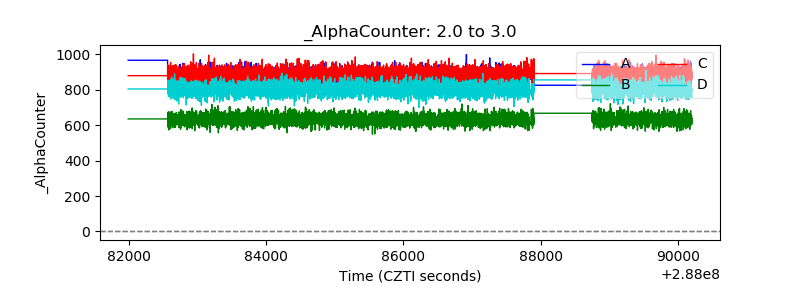 |
| _CPM_Rate | 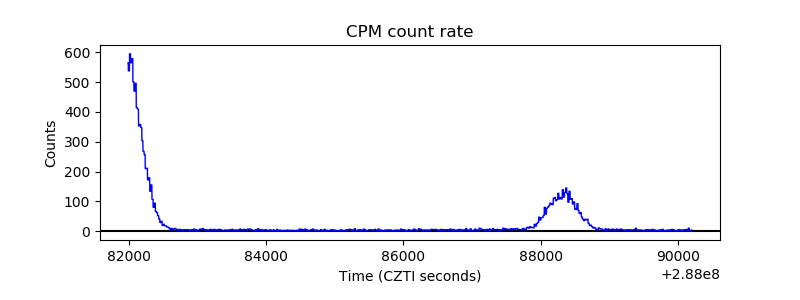 |
| CZT Counter | 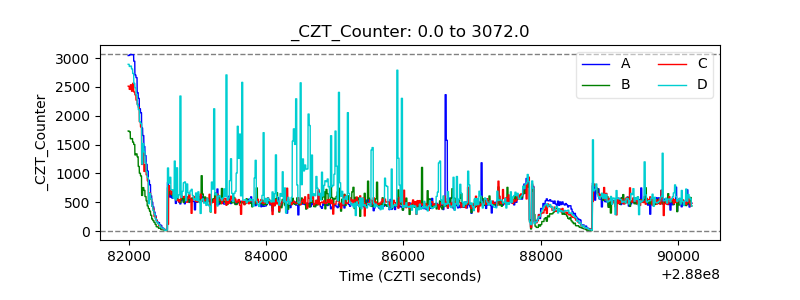 |
| +2.5 Volts monitor |  |
| +5 Volts monitor |  |
| _ROLL_ROT | 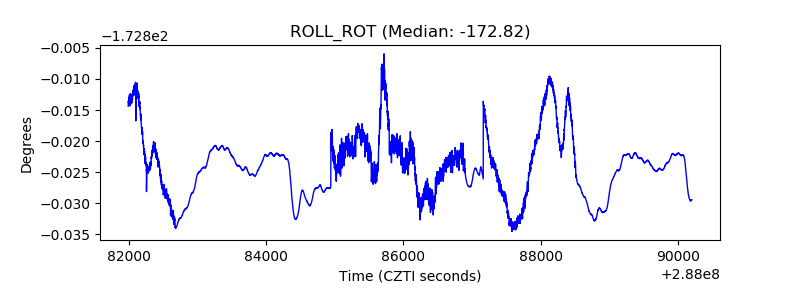 |
| _Roll_DEC | 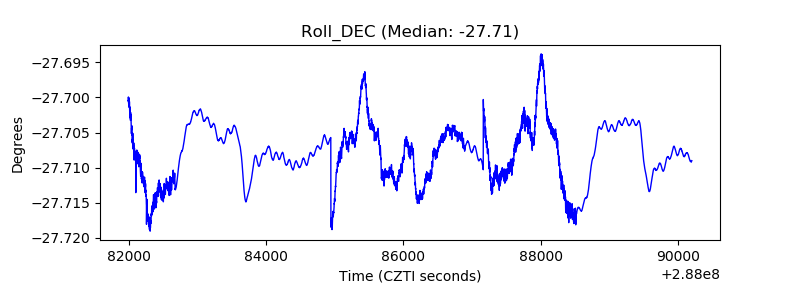 |
| _Roll_RA | 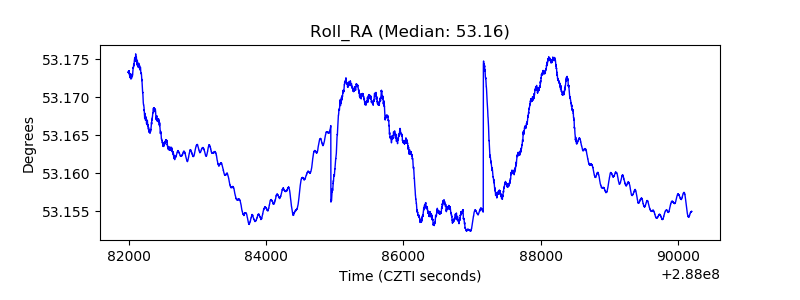 |
| Veto Counter | 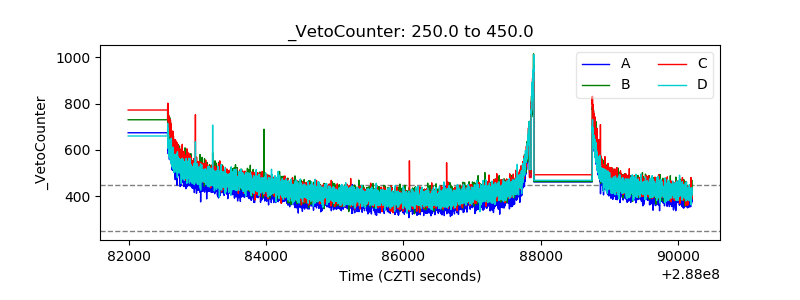 |