| Param | Original file | Final file |
|---|---|---|
| Filename | modeM0/AS1A06_006T01_9000002720_18329cztM0_level2.evt | modeM0/AS1A06_006T01_9000002720_18329cztM0_level2_quad_clean.evt |
| Size (bytes) | 612,331,200 | 100,670,400 |
| Size | 584.0 MB | 96.0 MB |
| Events in quadrant A | 3,810,932 | 644,647 |
| Events in quadrant B | 4,231,326 | 643,915 |
| Events in quadrant C | 3,861,152 | 634,592 |
| Events in quadrant D | 6,120,669 | 591,429 |
| Mode SS | |||
|---|---|---|---|
| Quadrant | BADHDUFLAG | Total packets | Discarded packets |
| A | 0 | 160 | 0 |
| B | 0 | 160 | 0 |
| C | 0 | 160 | 0 |
| D | 0 | 160 | 0 |
| Mode M9 | |||
|---|---|---|---|
| Quadrant | BADHDUFLAG | Total packets | Discarded packets |
| A | 0 | 7 | 0 |
| B | 0 | 7 | 0 |
| C | 0 | 7 | 0 |
| D | 0 | 7 | 0 |
| Mode M0 | |||
|---|---|---|---|
| Quadrant | BADHDUFLAG | Total packets | Discarded packets |
| A | 0 | 16309 | 2 |
| B | 0 | 17413 | 2 |
| C | 0 | 16196 | 2 |
| D | 0 | 23048 | 3 |
| Quadrant | Total seconds | Saturated seconds | Saturation percentage |
|---|---|---|---|
| A | 7673 | 247 | 3.219080% |
| B | 7673 | 260 | 3.388505% |
| C | 7673 | 255 | 3.323342% |
| D | 7672 | 945 | 12.317518% |
Noise dominated data is calculated using 1-second bins in cleaned event files. If a bin has >2000 counts, and if more than 50% of those come from <1% of pixels, then it is considered to be noise-dominated and hence unusable.
| Quadrant | # 1 sec bins | Bins with >0 counts | Bins with >2000 counts | High rate bins dominated by noise | Noise dominated (total time) | Noise dominated (detector-on time) | Marked lightcurve |
|---|---|---|---|---|---|---|---|
| A | 8388 | 7677 | 6 | 6 | 0.07% | 0.08% | 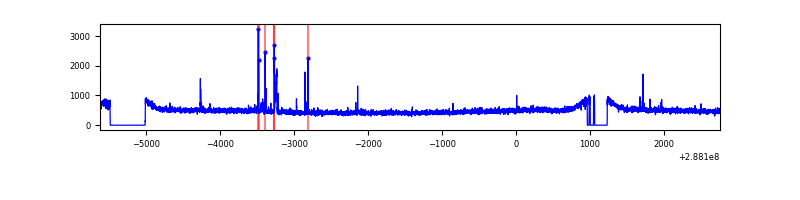 |
| B | 8388 | 7677 | 11 | 11 | 0.13% | 0.14% | 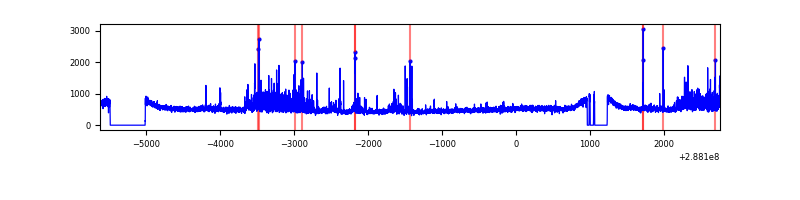 |
| C | 8388 | 7677 | 0 | 0 | 0.00% | 0.00% |  |
| D | 8387 | 7676 | 763 | 763 | 9.10% | 9.94% | 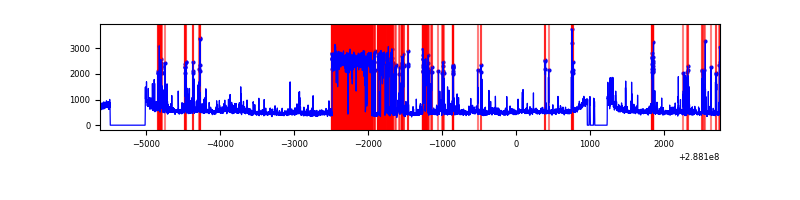 |
Top three noisy pixels from each quadrant. If the there are fewer than three noisy pixels in the level2.evt file, extra rows are filled as -1
| Pixel properties | Quadrant properties | ||||||
|---|---|---|---|---|---|---|---|
| Quadrant | DetID | PixID | Counts | Sigma | Mean | Median | Sigma |
| A | 15 | 174 | 83390 | 416.94 | 969 | 947 | 197.7 |
| A | 0 | 226 | 8596 | 38.68 | 969 | 947 | 197.7 |
| A | 12 | 194 | 7205 | 31.65 | 969 | 947 | 197.7 |
| B | 7 | 220 | 332496 | 1777.72 | 962 | 937 | 186.5 |
| B | 0 | 189 | 31977 | 166.43 | 962 | 937 | 186.5 |
| B | 4 | 216 | 30488 | 158.44 | 962 | 937 | 186.5 |
| C | 14 | 238 | 139803 | 635.72 | 924 | 928 | 218.5 |
| C | 3 | 233 | 105381 | 478.15 | 924 | 928 | 218.5 |
| C | 0 | 207 | 7563 | 30.37 | 924 | 928 | 218.5 |
| D | 13 | 168 | 1942188 | 8524.22 | 924 | 896 | 227.7 |
| D | 1 | 52 | 392952 | 1721.52 | 924 | 896 | 227.7 |
| D | 7 | 238 | 127580 | 556.27 | 924 | 896 | 227.7 |
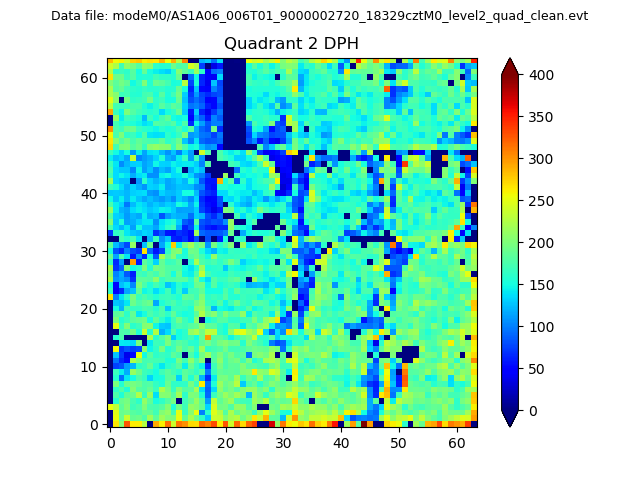
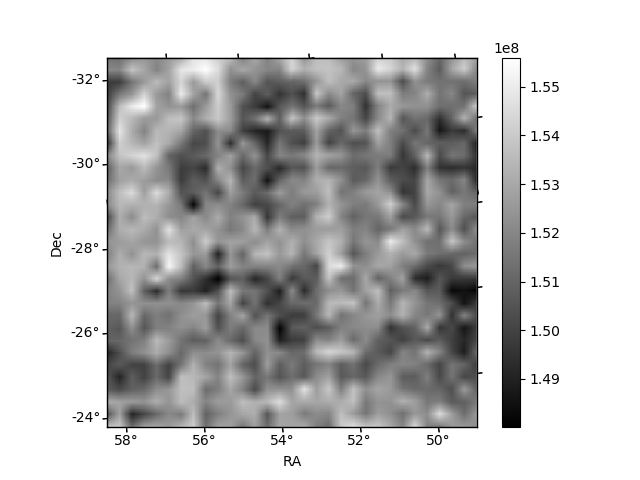
Histogram calculated using DETX and DETY for each event in the final _common_clean file
| Quadrant A |  |
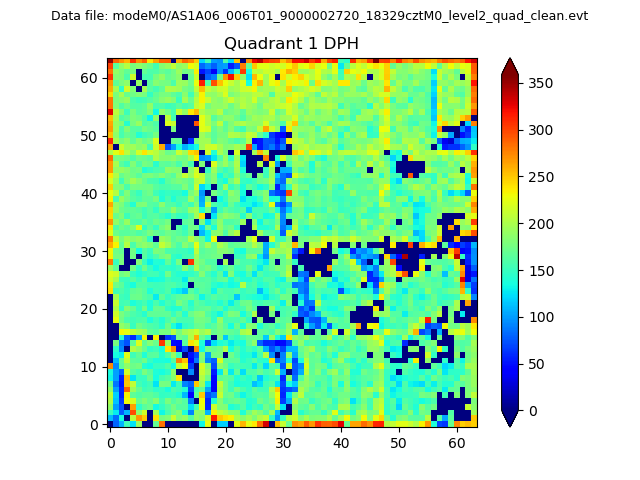 |
Quadrant B |
|---|---|---|---|
| Quadrant D | 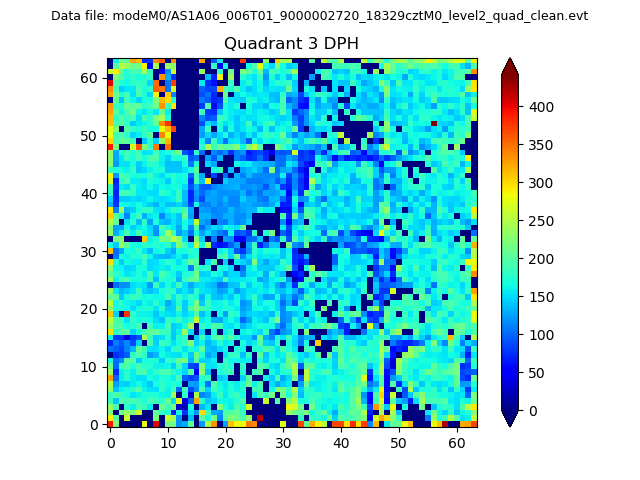 |
 |
Quadrant C |
| Plot type | Count rate plots | Images |
|---|---|---|
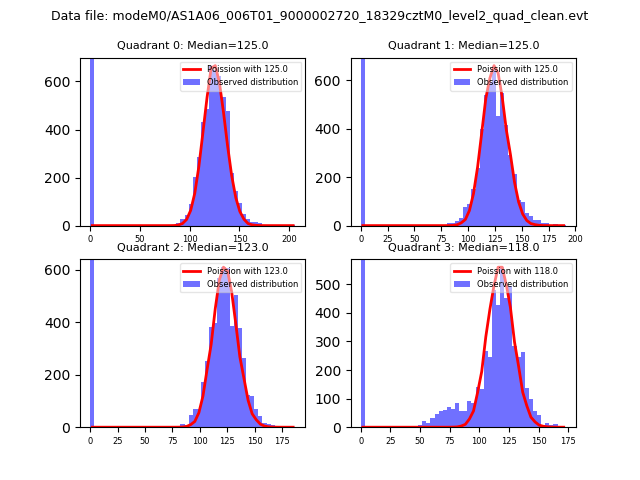
| Comparison with Poisson distribution Blue bars denote a histogram of data divided into 1 sec bins. Red curve is a Poisson curve with rate = median count rate of data. |
 |
 |
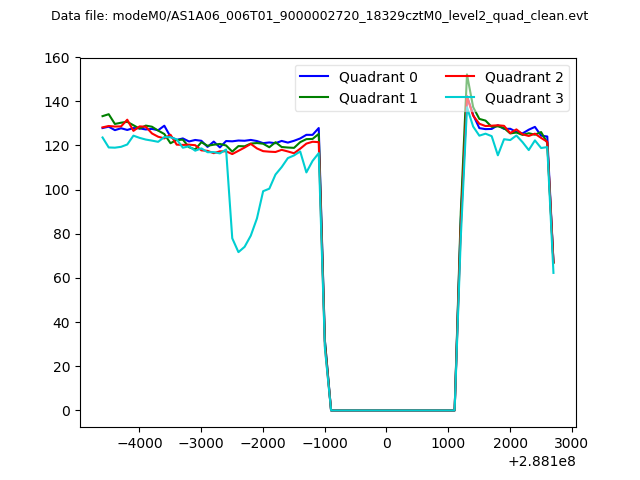
| Quadrant-wise count rates Data is divided into 100 sec bins |
 |
|
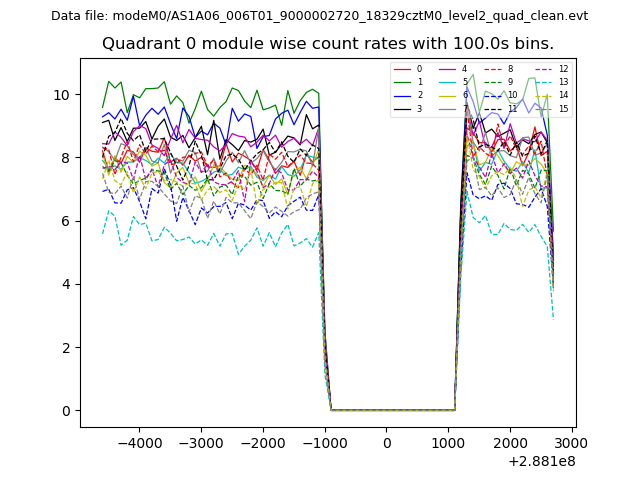
| Module-wise count rates for Quadrant A Data is divided into 100 sec bins |
 |
 |
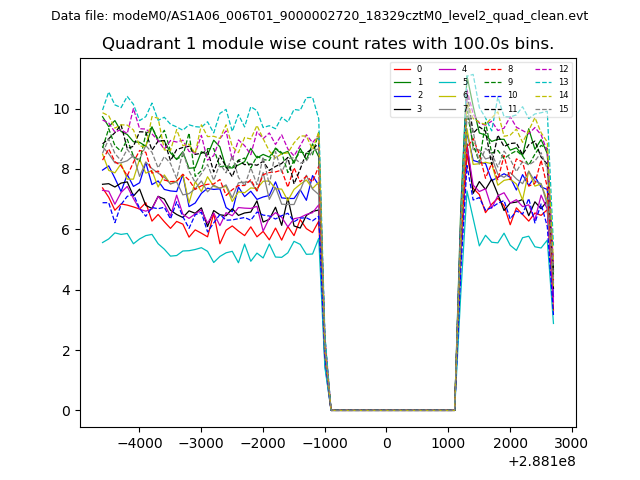
| Module-wise count rates for Quadrant B Data is divided into 100 sec bins |
 |
 |
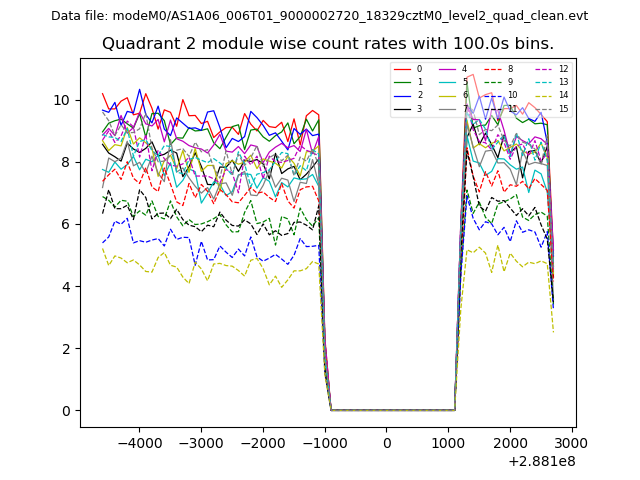
| Module-wise count rates for Quadrant C Data is divided into 100 sec bins |
 |
 |
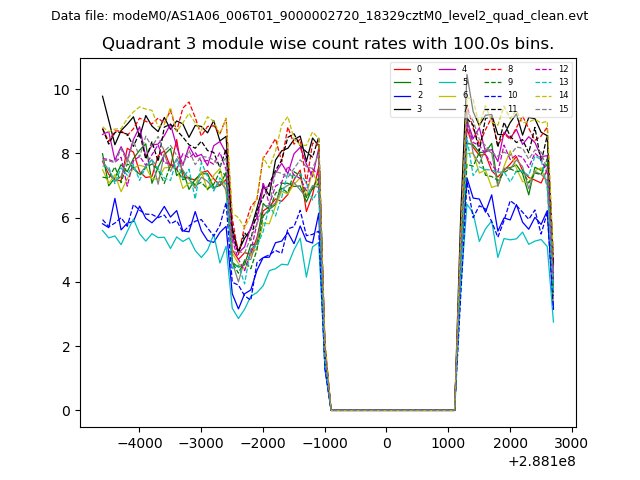
| Module-wise count rates for Quadrant D Data is divided into 100 sec bins |
 |
 |
| Parameter | Plot |
|---|---|
| CZT HV Monitor | 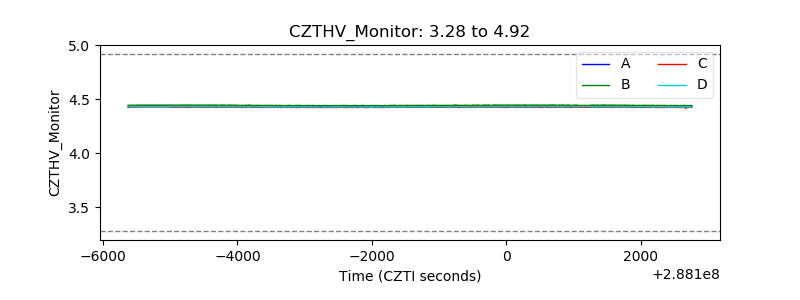 |
| D_VDD | 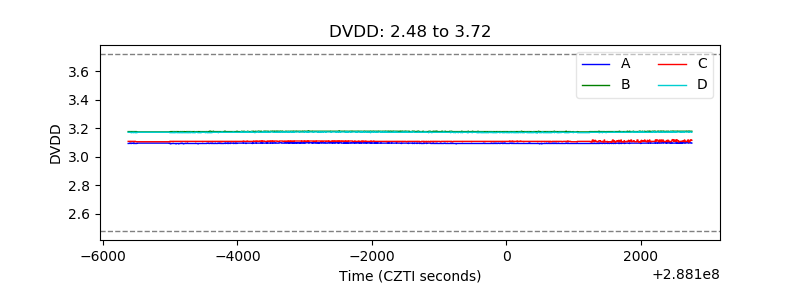 |
| Temperature 1 | 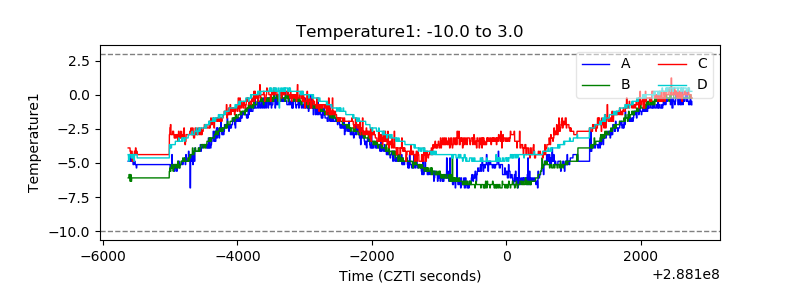 |
| Veto HV Monitor | 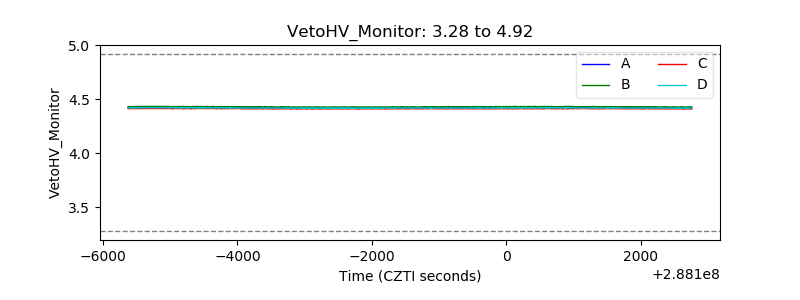 |
| Veto LLD | 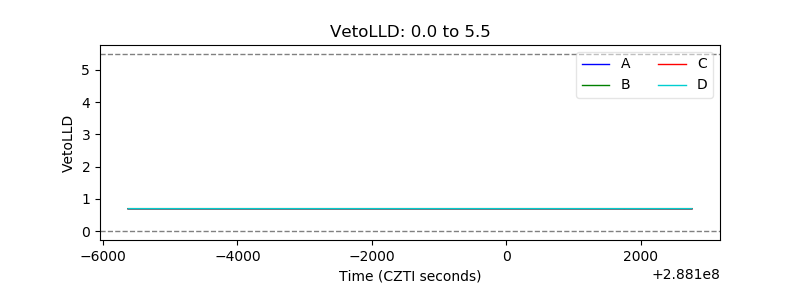 |
| Alpha Counter | 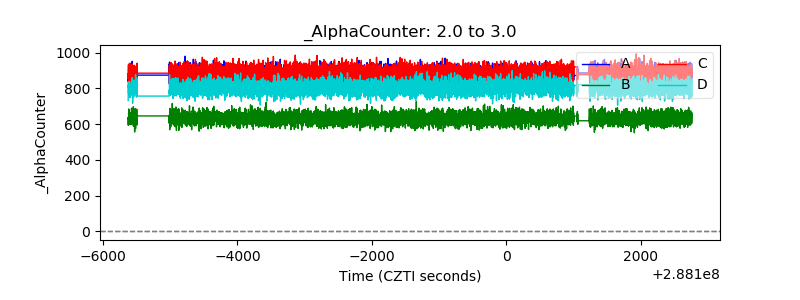 |
| _CPM_Rate | 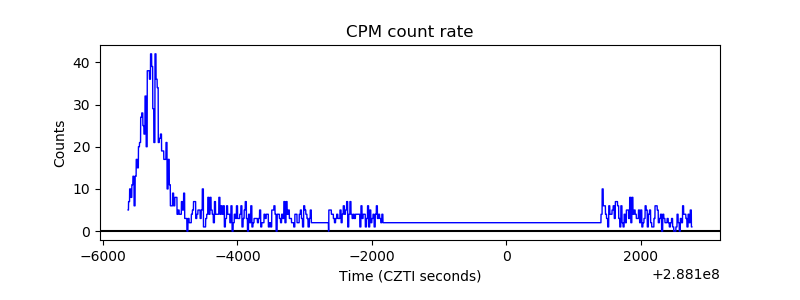 |
| CZT Counter | 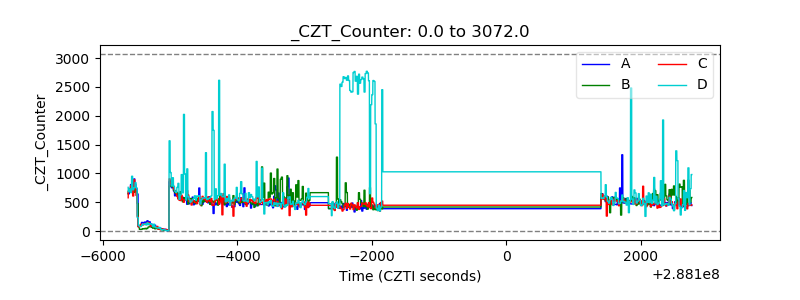 |
| +2.5 Volts monitor |  |
| +5 Volts monitor |  |
| _ROLL_ROT | 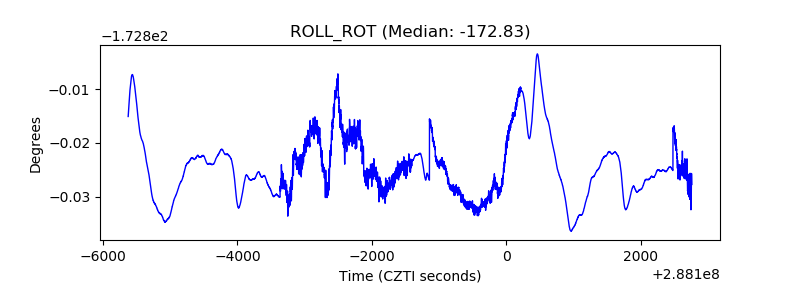 |
| _Roll_DEC | 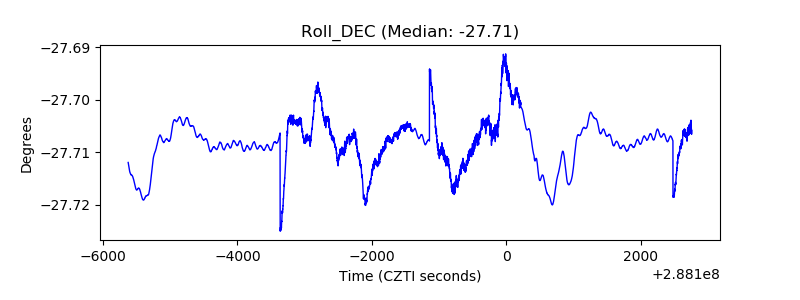 |
| _Roll_RA | 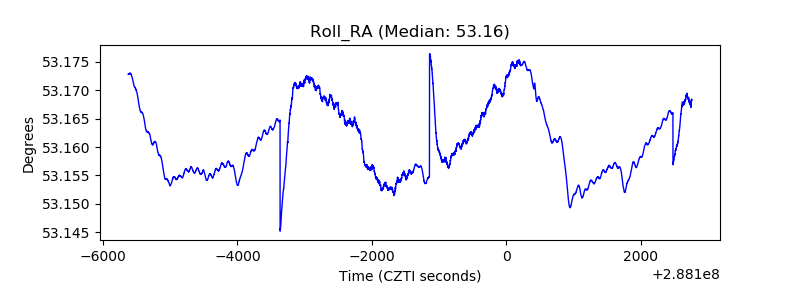 |
| Veto Counter | 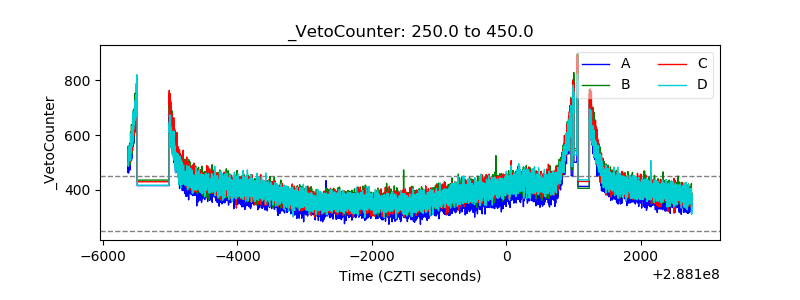 |