| Param | Original file | Final file |
|---|---|---|
| Filename | modeM0/AS1A06_006T01_9000002720_18333cztM0_level2.evt | modeM0/AS1A06_006T01_9000002720_18333cztM0_level2_quad_clean.evt |
| Size (bytes) | 1,314,123,840 | 225,581,760 |
| Size | 1.2 GB | 215.1 MB |
| Events in quadrant A | 8,384,301 | 1,428,937 |
| Events in quadrant B | 9,200,739 | 1,430,699 |
| Events in quadrant C | 8,621,725 | 1,400,777 |
| Events in quadrant D | 12,366,388 | 1,321,967 |
| Mode SS | |||
|---|---|---|---|
| Quadrant | BADHDUFLAG | Total packets | Discarded packets |
| A | 0 | 368 | 0 |
| B | 0 | 368 | 0 |
| C | 0 | 368 | 0 |
| D | 0 | 368 | 0 |
| Mode M9 | |||
|---|---|---|---|
| Quadrant | BADHDUFLAG | Total packets | Discarded packets |
| A | 0 | 21 | 0 |
| B | 0 | 21 | 0 |
| C | 0 | 21 | 0 |
| D | 0 | 21 | 0 |
| Mode M0 | |||
|---|---|---|---|
| Quadrant | BADHDUFLAG | Total packets | Discarded packets |
| A | 0 | 37117 | 3 |
| B | 0 | 39057 | 3 |
| C | 0 | 37495 | 3 |
| D | 0 | 49055 | 3 |
| Quadrant | Total seconds | Saturated seconds | Saturation percentage |
|---|---|---|---|
| A | 18134 | 67 | 0.369472% |
| B | 18135 | 128 | 0.705817% |
| C | 18134 | 121 | 0.667255% |
| D | 18134 | 841 | 4.637697% |
Noise dominated data is calculated using 1-second bins in cleaned event files. If a bin has >2000 counts, and if more than 50% of those come from <1% of pixels, then it is considered to be noise-dominated and hence unusable.
| Quadrant | # 1 sec bins | Bins with >0 counts | Bins with >2000 counts | High rate bins dominated by noise | Noise dominated (total time) | Noise dominated (detector-on time) | Marked lightcurve |
|---|---|---|---|---|---|---|---|
| A | 20179 | 18137 | 5 | 5 | 0.02% | 0.03% | 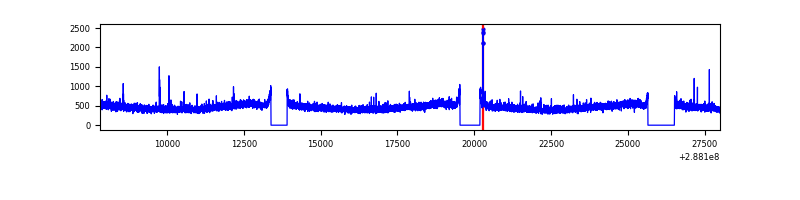 |
| B | 20180 | 18138 | 34 | 34 | 0.17% | 0.19% | 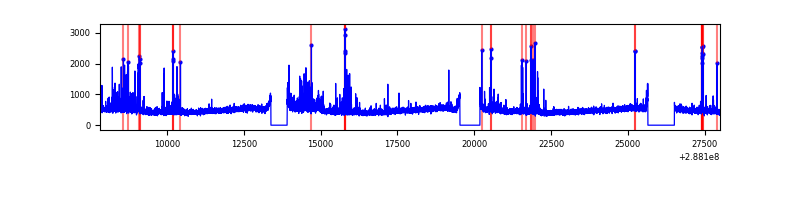 |
| C | 20179 | 18137 | 0 | 0 | 0.00% | 0.00% | 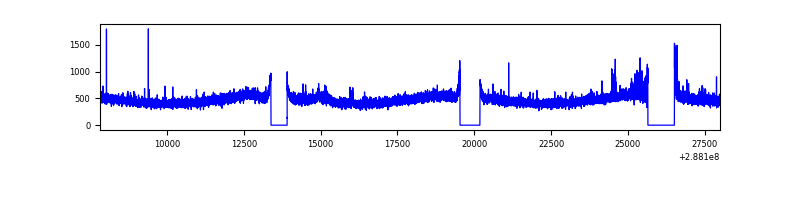 |
| D | 20179 | 18137 | 677 | 677 | 3.35% | 3.73% | 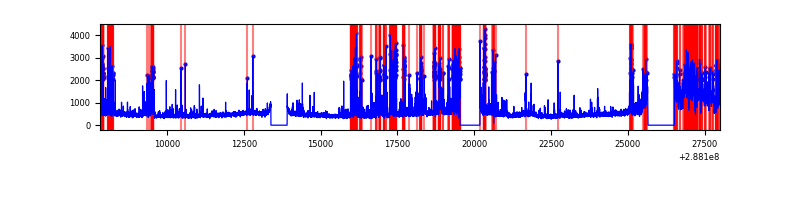 |
Top three noisy pixels from each quadrant. If the there are fewer than three noisy pixels in the level2.evt file, extra rows are filled as -1
| Pixel properties | Quadrant properties | ||||||
|---|---|---|---|---|---|---|---|
| Quadrant | DetID | PixID | Counts | Sigma | Mean | Median | Sigma |
| A | 15 | 174 | 67063 | 148.98 | 2158 | 2112 | 436.0 |
| A | 0 | 226 | 19296 | 39.41 | 2158 | 2112 | 436.0 |
| A | 12 | 194 | 15933 | 31.7 | 2158 | 2112 | 436.0 |
| B | 7 | 220 | 395348 | 951.61 | 2161 | 2109 | 413.2 |
| B | 0 | 197 | 146601 | 349.66 | 2161 | 2109 | 413.2 |
| B | 0 | 190 | 63383 | 148.28 | 2161 | 2109 | 413.2 |
| C | 14 | 238 | 310683 | 638.5 | 2067 | 2083 | 483.3 |
| C | 3 | 233 | 205513 | 420.9 | 2067 | 2083 | 483.3 |
| C | 0 | 207 | 23515 | 44.34 | 2067 | 2083 | 483.3 |
| D | 1 | 52 | 1892894 | 3796.12 | 2047 | 1991 | 498.1 |
| D | 13 | 168 | 1438239 | 2883.37 | 2047 | 1991 | 498.1 |
| D | 7 | 238 | 436571 | 872.45 | 2047 | 1991 | 498.1 |
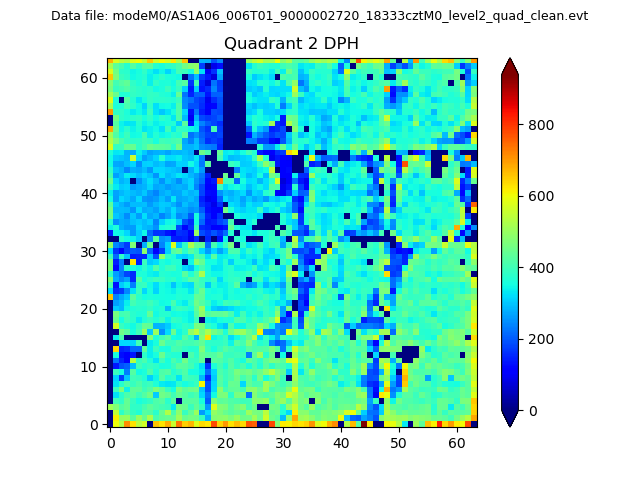
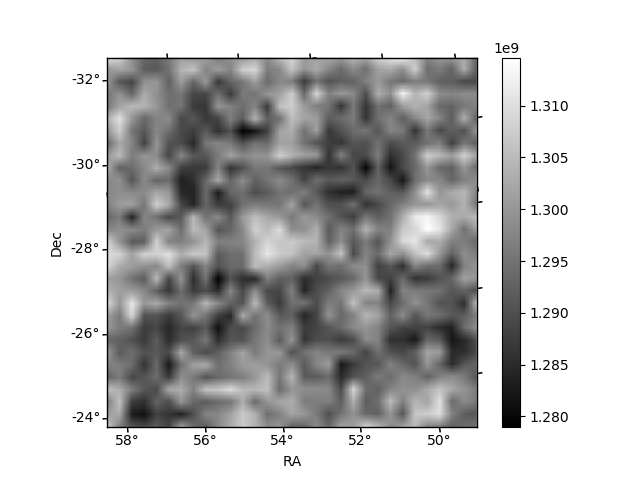
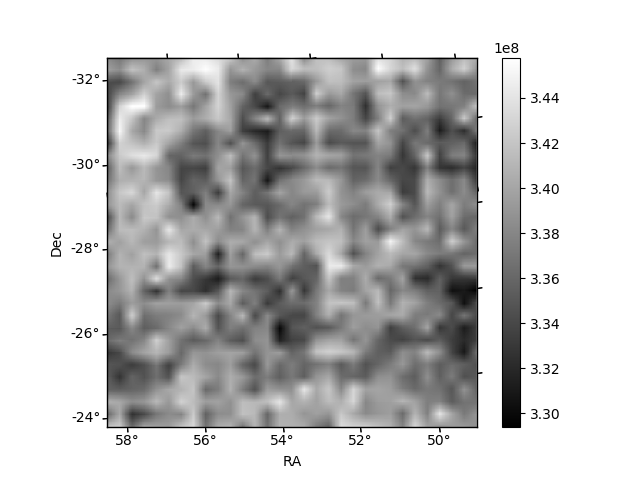
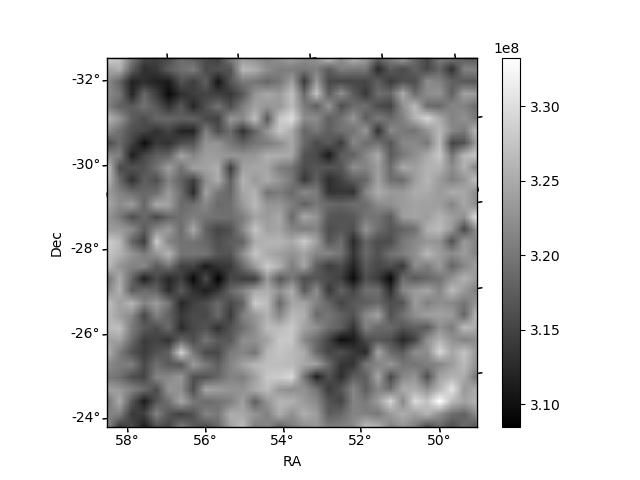
Histogram calculated using DETX and DETY for each event in the final _common_clean file
| Quadrant A | 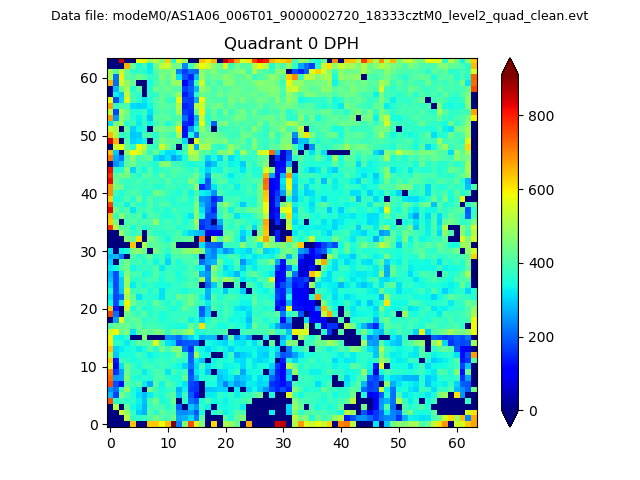 |
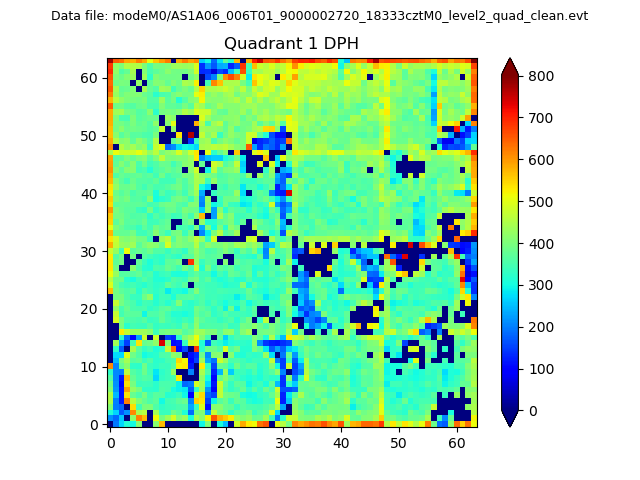 |
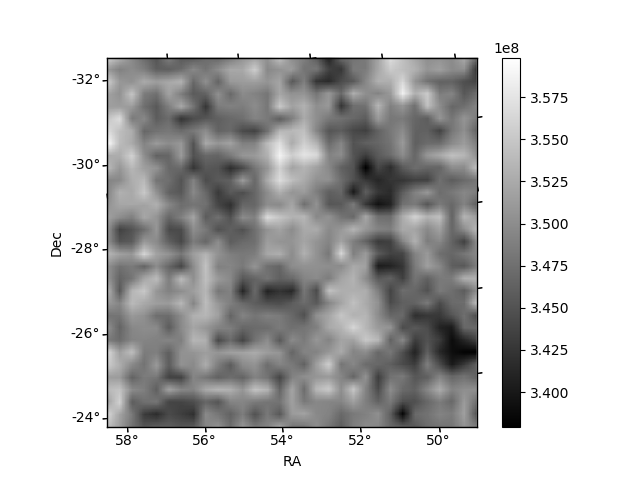
Quadrant B |
|---|---|---|---|
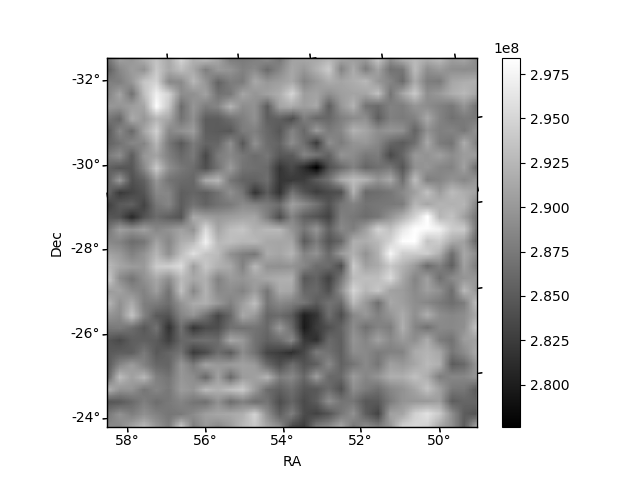
| Quadrant D | 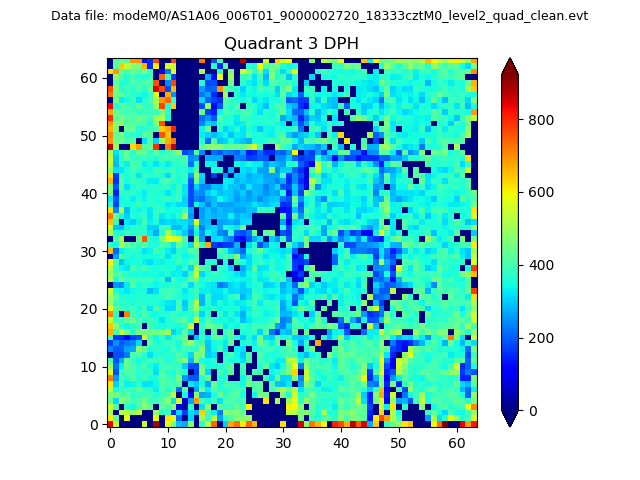 |
 |
Quadrant C |
| Plot type | Count rate plots | Images |
|---|---|---|
| Comparison with Poisson distribution Blue bars denote a histogram of data divided into 1 sec bins. Red curve is a Poisson curve with rate = median count rate of data. |
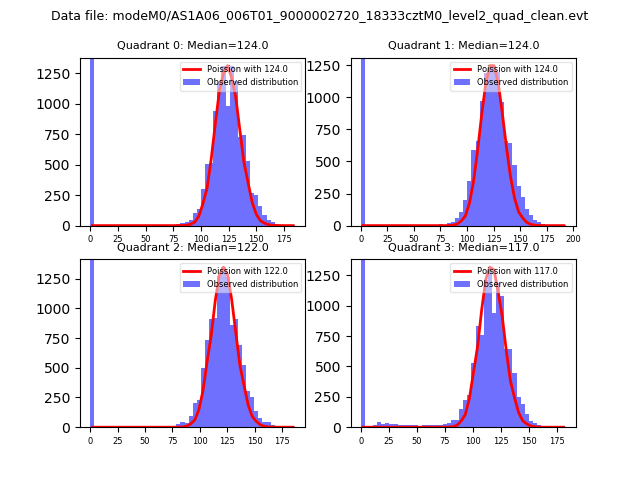 |
 |
| Quadrant-wise count rates Data is divided into 100 sec bins |
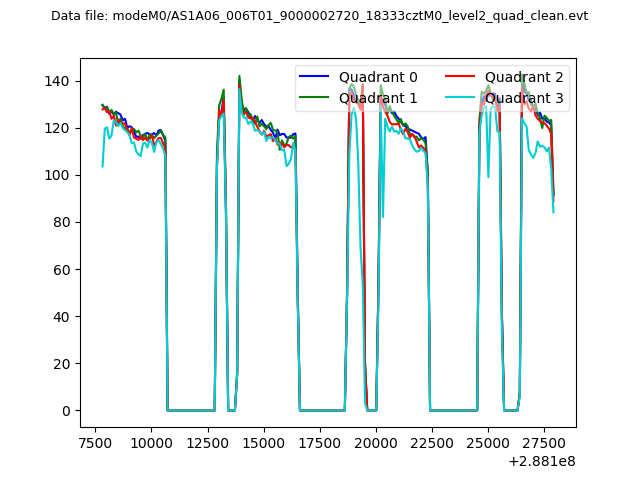 |
|
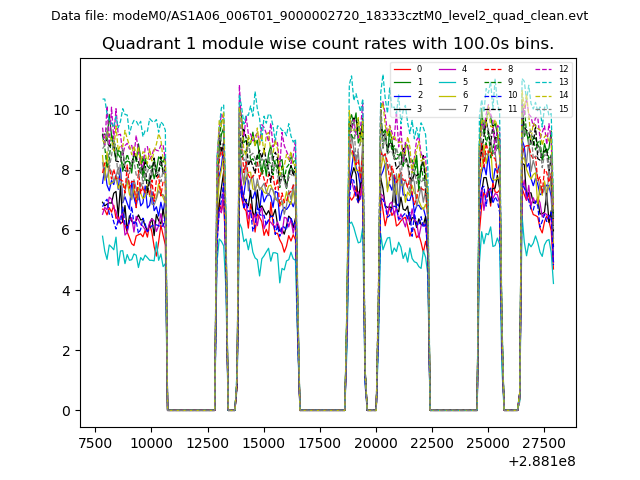
| Module-wise count rates for Quadrant A Data is divided into 100 sec bins |
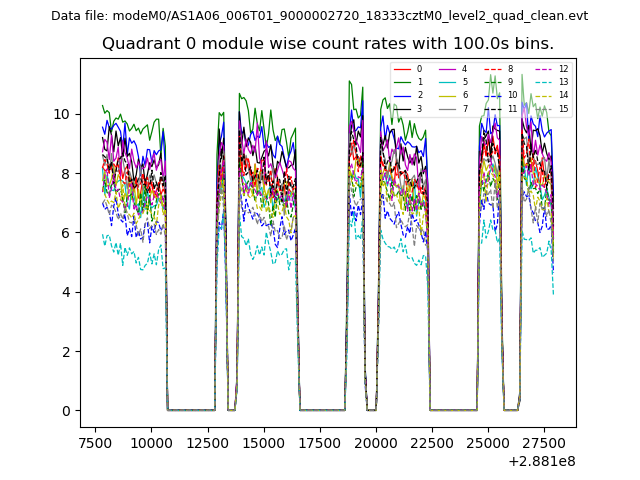 |
 |
| Module-wise count rates for Quadrant B Data is divided into 100 sec bins |
 |
 |
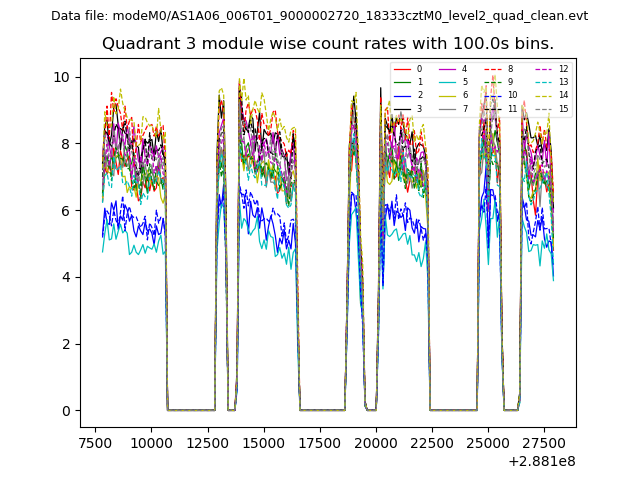
| Module-wise count rates for Quadrant C Data is divided into 100 sec bins |
 |
 |
| Module-wise count rates for Quadrant D Data is divided into 100 sec bins |
 |
 |
| Parameter | Plot |
|---|---|
| CZT HV Monitor | 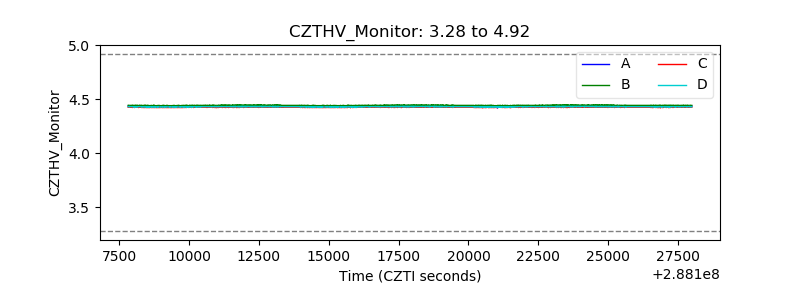 |
| D_VDD | 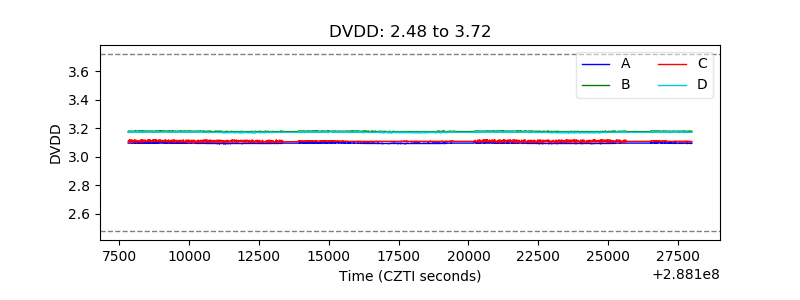 |
| Temperature 1 | 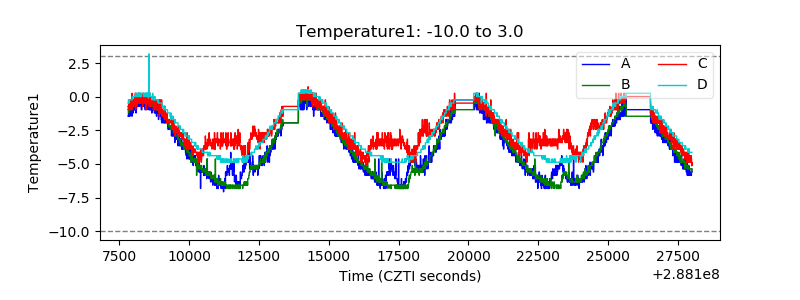 |
| Veto HV Monitor | 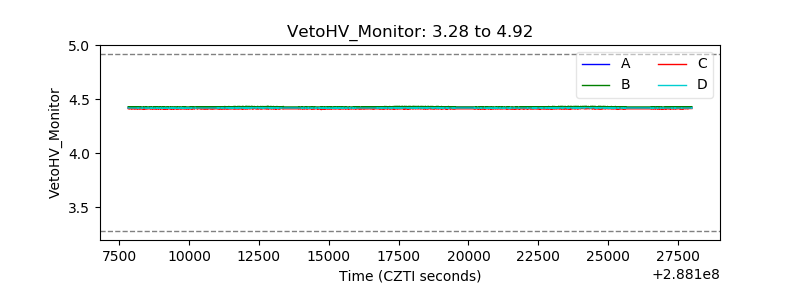 |
| Veto LLD | 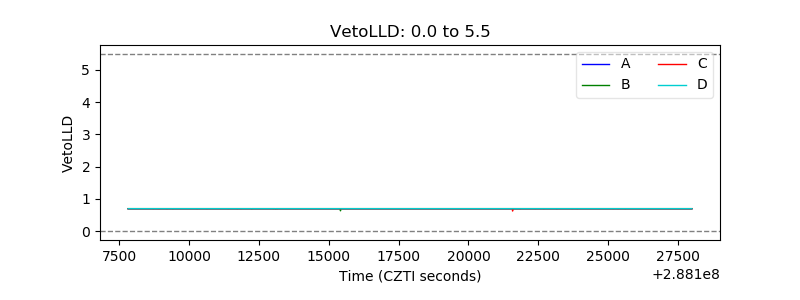 |
| Alpha Counter | 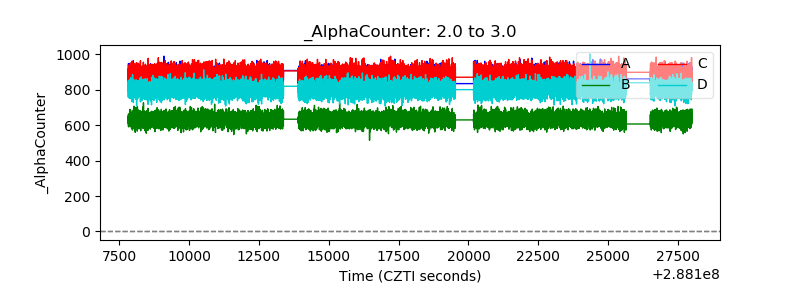 |
| _CPM_Rate | 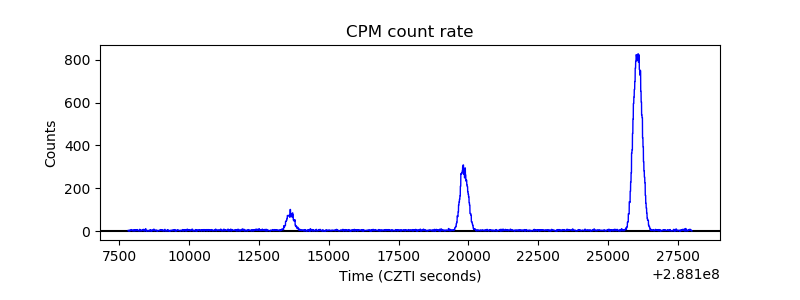 |
| CZT Counter | 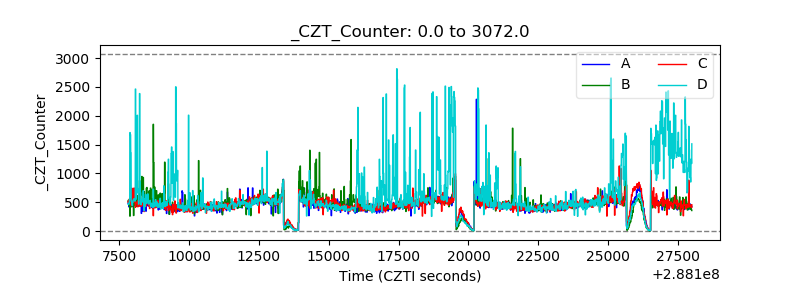 |
| +2.5 Volts monitor |  |
| +5 Volts monitor |  |
| _ROLL_ROT | 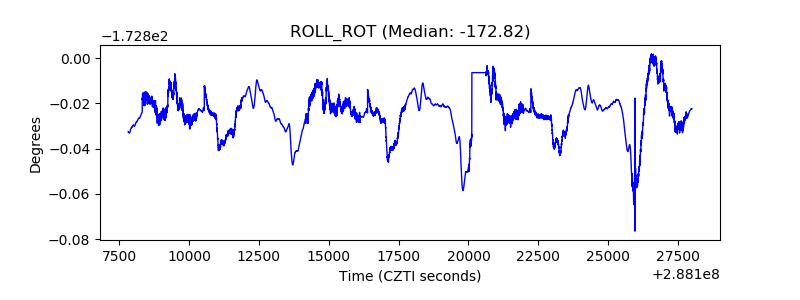 |
| _Roll_DEC | 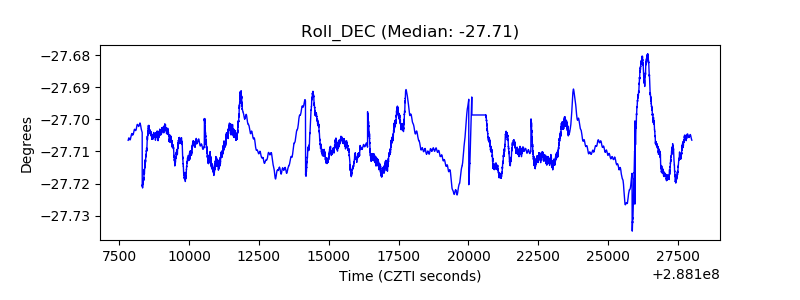 |
| _Roll_RA | 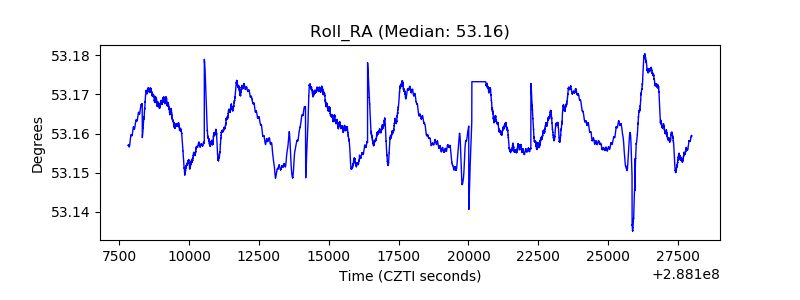 |
| Veto Counter | 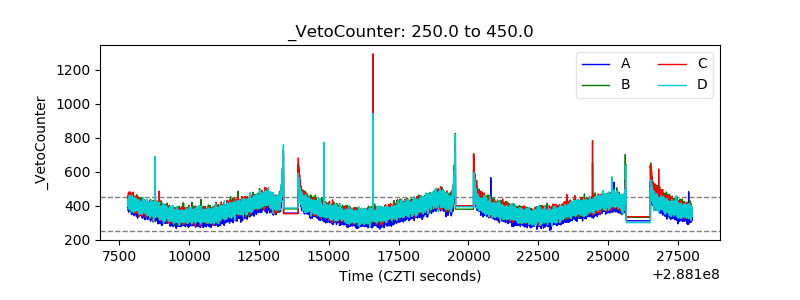 |