| Param | Original file | Final file |
|---|---|---|
| Filename | modeM0/AS1A06_006T01_9000002720_18334cztM0_level2.evt | modeM0/AS1A06_006T01_9000002720_18334cztM0_level2_quad_clean.evt |
| Size (bytes) | 578,617,920 | 89,847,360 |
| Size | 551.8 MB | 85.7 MB |
| Events in quadrant A | 3,106,749 | 577,723 |
| Events in quadrant B | 3,346,596 | 583,698 |
| Events in quadrant C | 3,231,293 | 567,382 |
| Events in quadrant D | 7,385,024 | 524,517 |
| Mode SS | |||
|---|---|---|---|
| Quadrant | BADHDUFLAG | Total packets | Discarded packets |
| A | 0 | 136 | 0 |
| B | 0 | 136 | 0 |
| C | 0 | 136 | 0 |
| D | 0 | 136 | 0 |
| Mode M9 | |||
|---|---|---|---|
| Quadrant | BADHDUFLAG | Total packets | Discarded packets |
| A | 0 | 18 | 0 |
| B | 0 | 18 | 0 |
| C | 0 | 18 | 0 |
| D | 0 | 18 | 0 |
| Mode M0 | |||
|---|---|---|---|
| Quadrant | BADHDUFLAG | Total packets | Discarded packets |
| A | 0 | 13658 | 2 |
| B | 0 | 14272 | 2 |
| C | 0 | 13816 | 2 |
| D | 0 | 26603 | 2 |
| Quadrant | Total seconds | Saturated seconds | Saturation percentage |
|---|---|---|---|
| A | 6705 | 10 | 0.149142% |
| B | 6706 | 43 | 0.641217% |
| C | 6706 | 49 | 0.730689% |
| D | 6706 | 318 | 4.742022% |
Noise dominated data is calculated using 1-second bins in cleaned event files. If a bin has >2000 counts, and if more than 50% of those come from <1% of pixels, then it is considered to be noise-dominated and hence unusable.
| Quadrant | # 1 sec bins | Bins with >0 counts | Bins with >2000 counts | High rate bins dominated by noise | Noise dominated (total time) | Noise dominated (detector-on time) | Marked lightcurve |
|---|---|---|---|---|---|---|---|
| A | 8560 | 6707 | 0 | 0 | 0.00% | 0.00% | 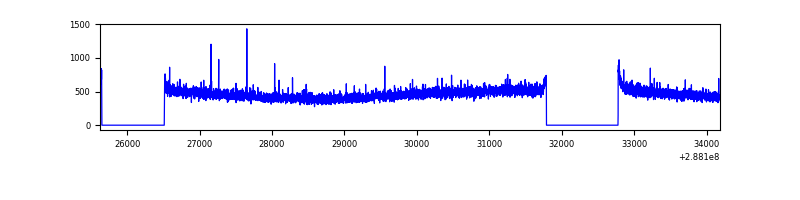 |
| B | 8561 | 6708 | 10 | 10 | 0.12% | 0.15% | 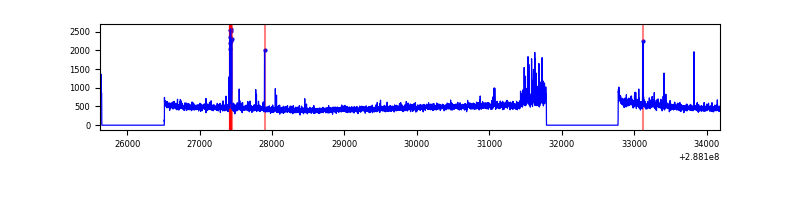 |
| C | 8561 | 6708 | 0 | 0 | 0.00% | 0.00% | 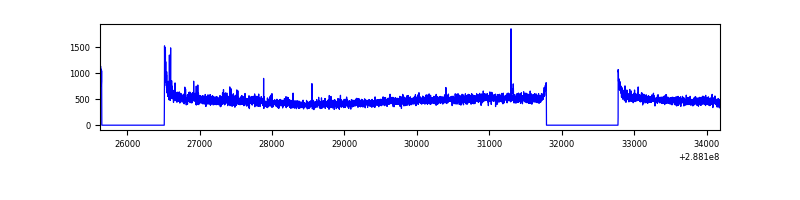 |
| D | 8561 | 6708 | 291 | 291 | 3.40% | 4.34% | 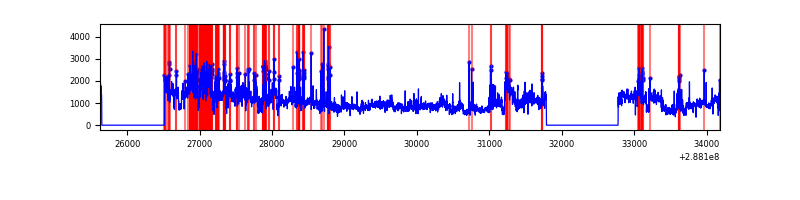 |
Top three noisy pixels from each quadrant. If the there are fewer than three noisy pixels in the level2.evt file, extra rows are filled as -1
| Pixel properties | Quadrant properties | ||||||
|---|---|---|---|---|---|---|---|
| Quadrant | DetID | PixID | Counts | Sigma | Mean | Median | Sigma |
| A | 15 | 174 | 8272 | 46.1 | 804 | 788 | 162.4 |
| A | 0 | 226 | 7171 | 39.31 | 804 | 788 | 162.4 |
| A | 3 | 137 | 5845 | 31.15 | 804 | 788 | 162.4 |
| B | 7 | 220 | 120912 | 774.96 | 808 | 788 | 155.0 |
| B | 0 | 197 | 32285 | 203.2 | 808 | 788 | 155.0 |
| B | 4 | 216 | 18785 | 116.11 | 808 | 788 | 155.0 |
| C | 14 | 238 | 118280 | 651.38 | 770 | 777 | 180.4 |
| C | 3 | 233 | 99497 | 547.26 | 770 | 777 | 180.4 |
| C | 0 | 207 | 11266 | 58.15 | 770 | 777 | 180.4 |
| D | 13 | 168 | 3424311 | 18125.38 | 767 | 743 | 188.9 |
| D | 1 | 52 | 601649 | 3181.37 | 767 | 743 | 188.9 |
| D | 7 | 238 | 279435 | 1475.48 | 767 | 743 | 188.9 |
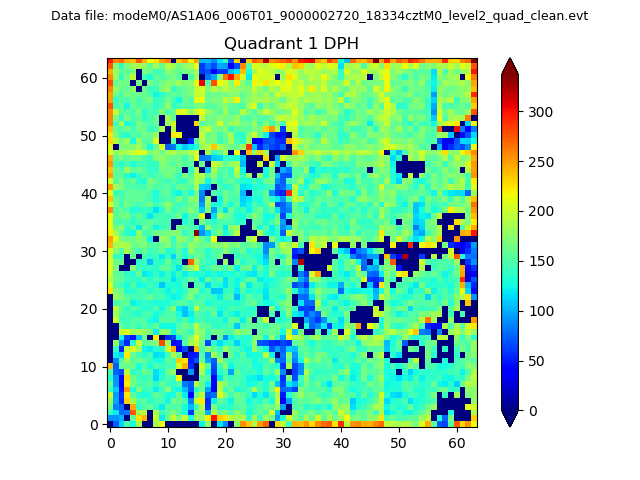
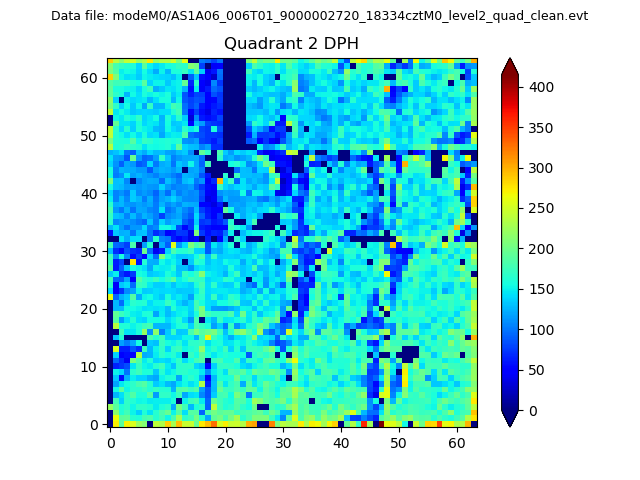
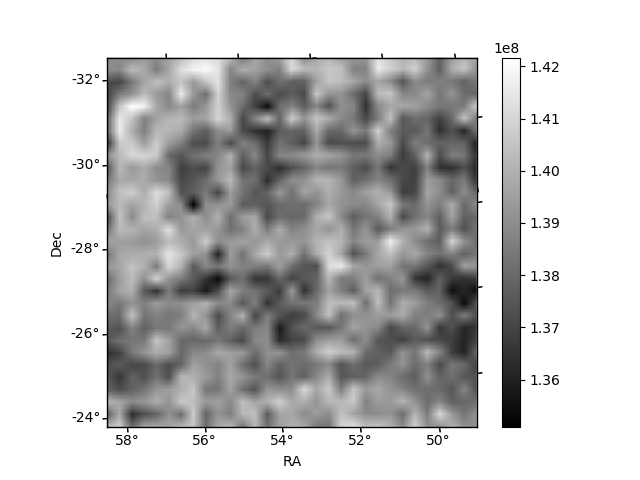
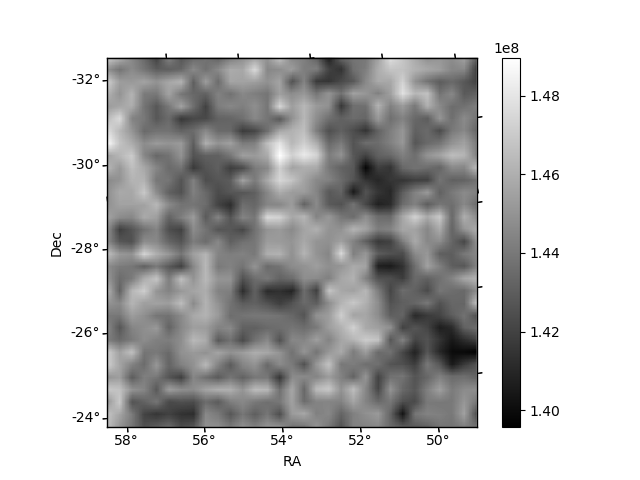
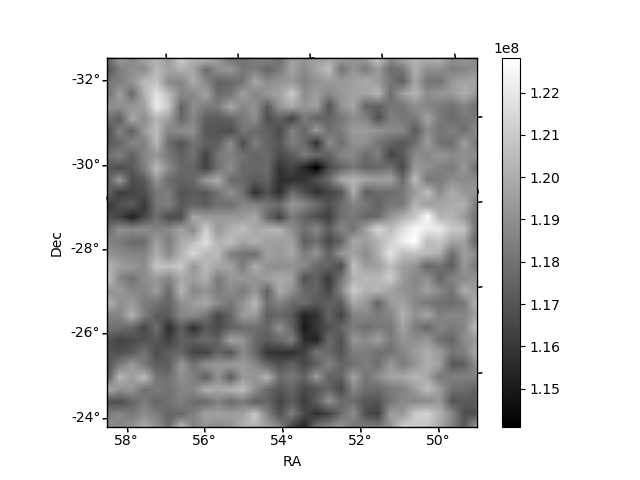
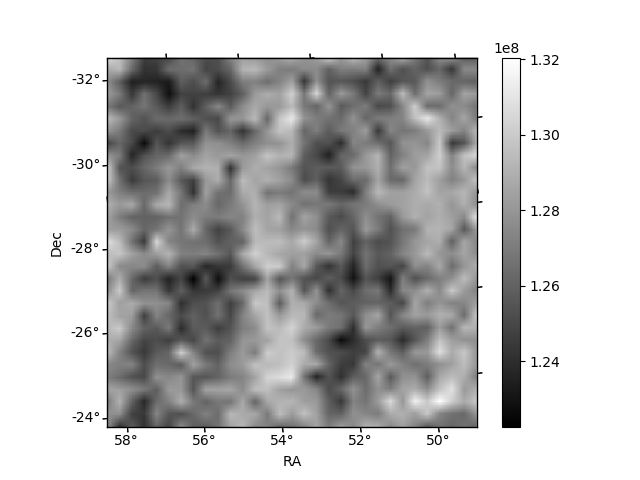
Histogram calculated using DETX and DETY for each event in the final _common_clean file
| Quadrant A |  |
 |
Quadrant B |
|---|---|---|---|
| Quadrant D |  |
 |
Quadrant C |
| Plot type | Count rate plots | Images |
|---|---|---|
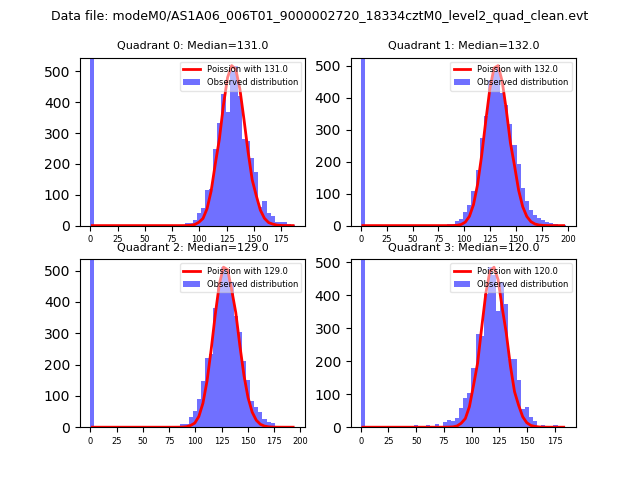
| Comparison with Poisson distribution Blue bars denote a histogram of data divided into 1 sec bins. Red curve is a Poisson curve with rate = median count rate of data. |
 |
 |
| Quadrant-wise count rates Data is divided into 100 sec bins |
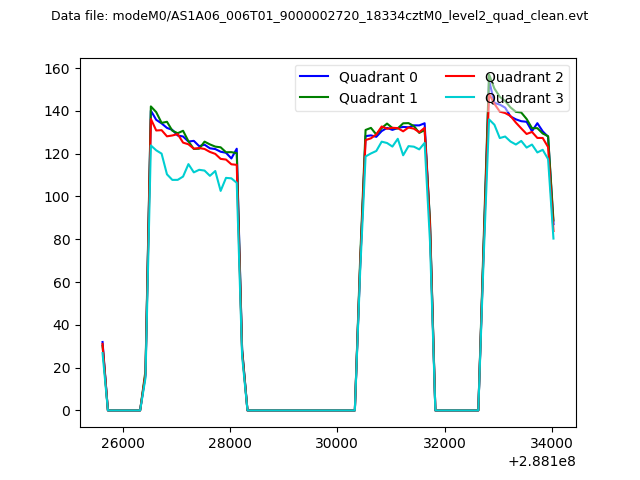 |
|
| Module-wise count rates for Quadrant A Data is divided into 100 sec bins |
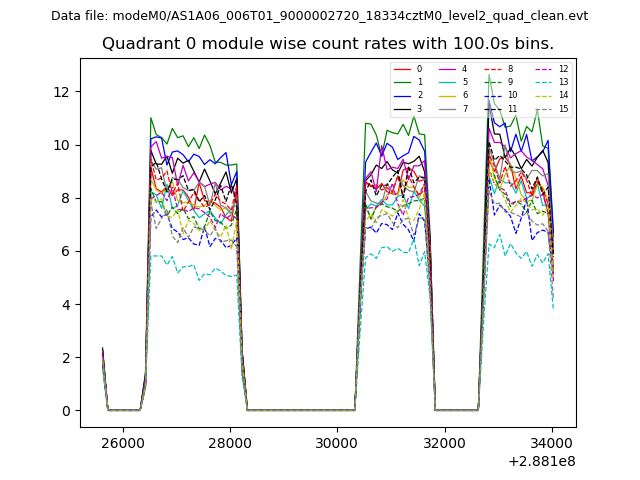 |
 |
| Module-wise count rates for Quadrant B Data is divided into 100 sec bins |
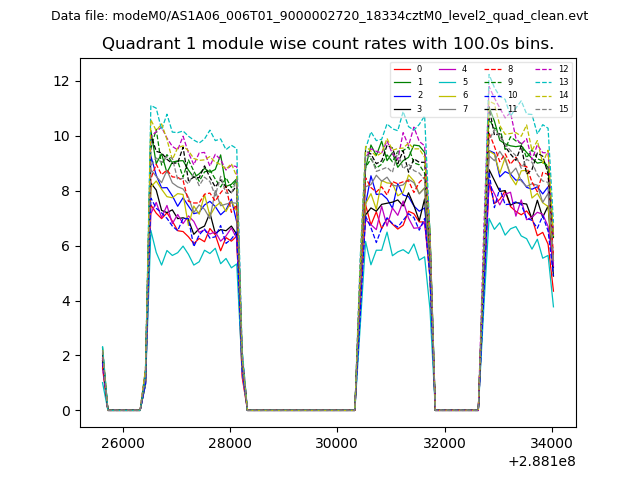 |
 |
| Module-wise count rates for Quadrant C Data is divided into 100 sec bins |
 |
 |
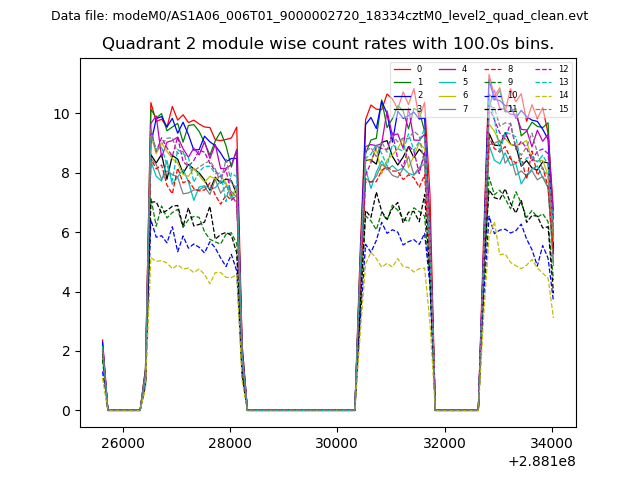
| Module-wise count rates for Quadrant D Data is divided into 100 sec bins |
 |
 |
| Parameter | Plot |
|---|---|
| CZT HV Monitor | 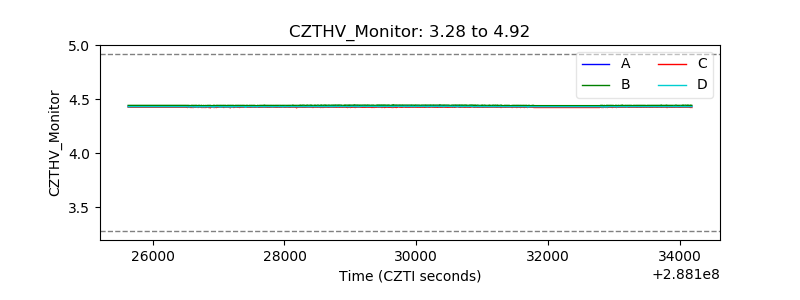 |
| D_VDD | 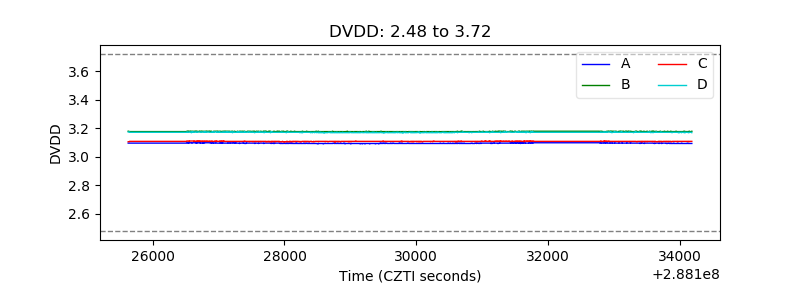 |
| Temperature 1 | 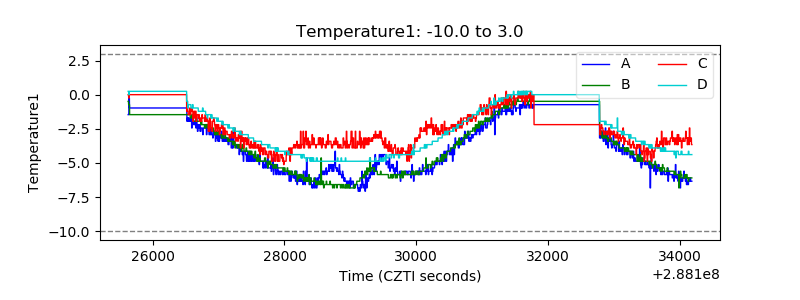 |
| Veto HV Monitor | 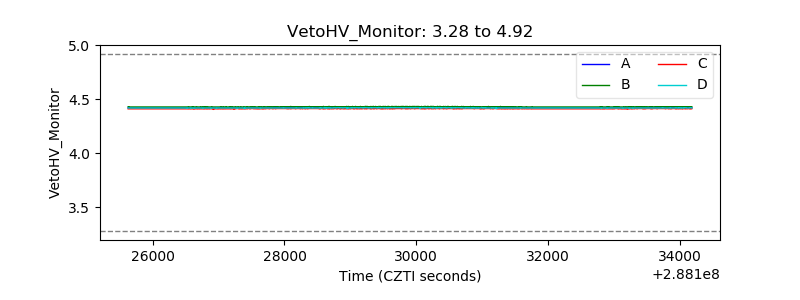 |
| Veto LLD | 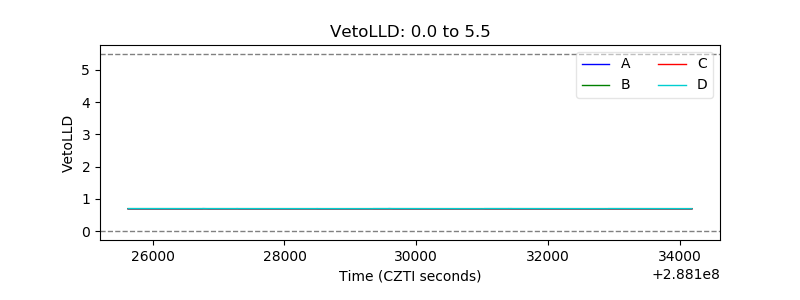 |
| Alpha Counter | 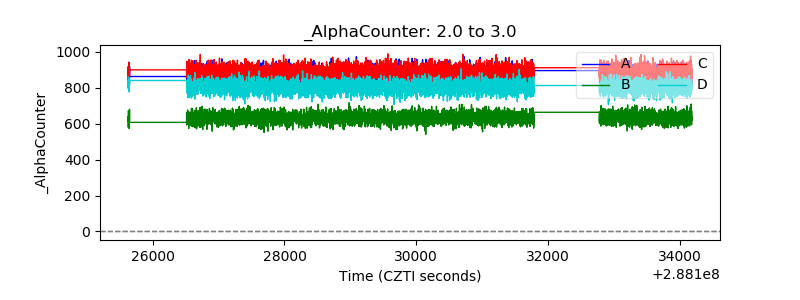 |
| _CPM_Rate | 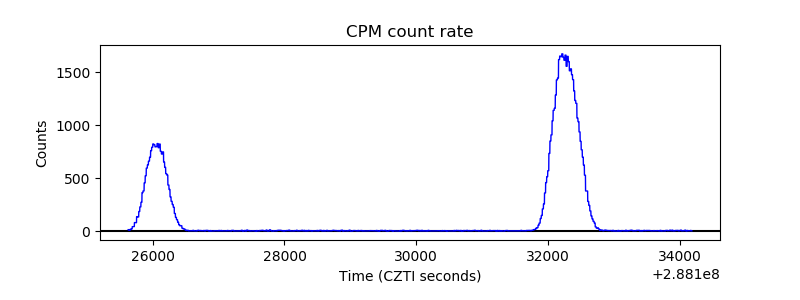 |
| CZT Counter | 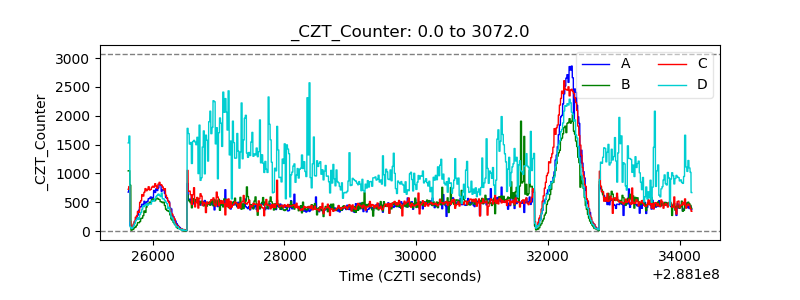 |
| +2.5 Volts monitor |  |
| +5 Volts monitor |  |
| _ROLL_ROT | 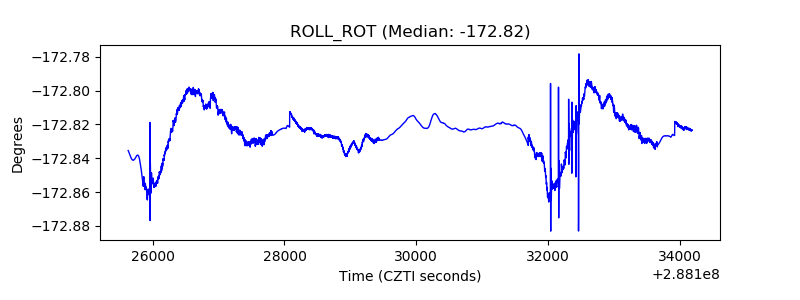 |
| _Roll_DEC | 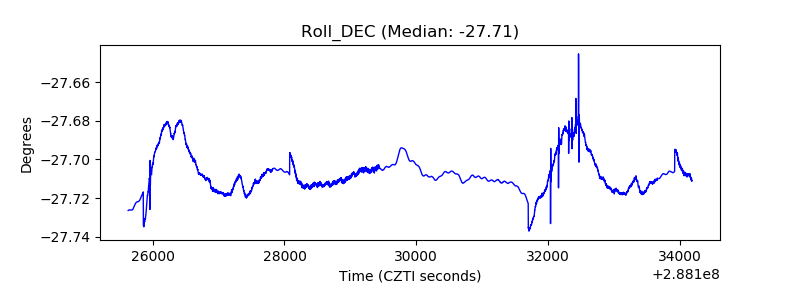 |
| _Roll_RA | 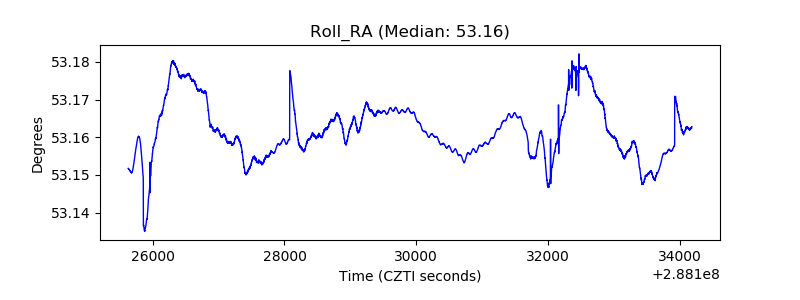 |
| Veto Counter | 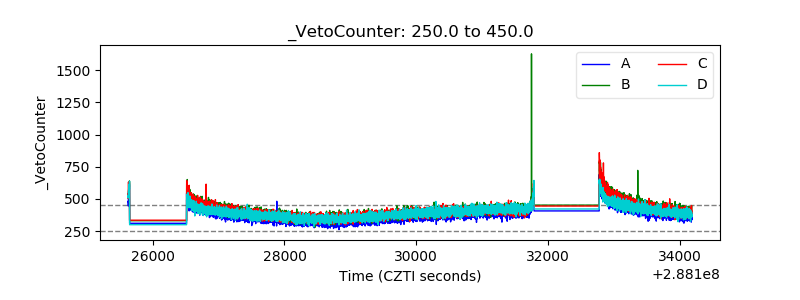 |