| Param | Original file | Final file |
|---|---|---|
| Filename | modeM0/AS1A06_006T01_9000002720_18336cztM0_level2.evt | modeM0/AS1A06_006T01_9000002720_18336cztM0_level2_quad_clean.evt |
| Size (bytes) | 497,234,880 | 83,943,360 |
| Size | 474.2 MB | 80.1 MB |
| Events in quadrant A | 3,143,237 | 529,269 |
| Events in quadrant B | 3,363,529 | 539,031 |
| Events in quadrant C | 3,244,671 | 519,765 |
| Events in quadrant D | 4,857,184 | 491,420 |
| Mode SS | |||
|---|---|---|---|
| Quadrant | BADHDUFLAG | Total packets | Discarded packets |
| A | 0 | 134 | 0 |
| B | 0 | 134 | 0 |
| C | 0 | 134 | 0 |
| D | 0 | 134 | 0 |
| Mode M9 | |||
|---|---|---|---|
| Quadrant | BADHDUFLAG | Total packets | Discarded packets |
| A | 0 | 18 | 0 |
| B | 0 | 19 | 0 |
| C | 0 | 19 | 0 |
| D | 0 | 19 | 0 |
| Mode M0 | |||
|---|---|---|---|
| Quadrant | BADHDUFLAG | Total packets | Discarded packets |
| A | 0 | 13585 | 1 |
| B | 0 | 14214 | 2 |
| C | 0 | 13632 | 1 |
| D | 0 | 18866 | 1 |
| Quadrant | Total seconds | Saturated seconds | Saturation percentage |
|---|---|---|---|
| A | 6637 | 19 | 0.286274% |
| B | 6636 | 27 | 0.406872% |
| C | 6636 | 43 | 0.647981% |
| D | 6636 | 141 | 2.124774% |
Noise dominated data is calculated using 1-second bins in cleaned event files. If a bin has >2000 counts, and if more than 50% of those come from <1% of pixels, then it is considered to be noise-dominated and hence unusable.
| Quadrant | # 1 sec bins | Bins with >0 counts | Bins with >2000 counts | High rate bins dominated by noise | Noise dominated (total time) | Noise dominated (detector-on time) | Marked lightcurve |
|---|---|---|---|---|---|---|---|
| A | 7772 | 6638 | 1 | 1 | 0.01% | 0.02% | 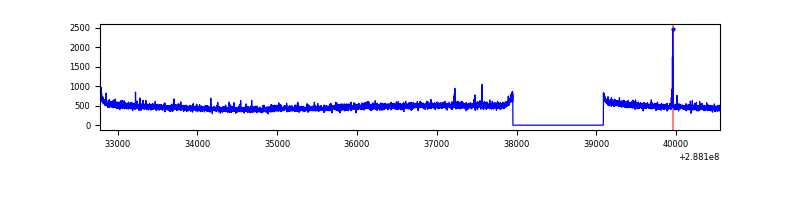 |
| B | 7771 | 6637 | 1 | 1 | 0.01% | 0.02% | 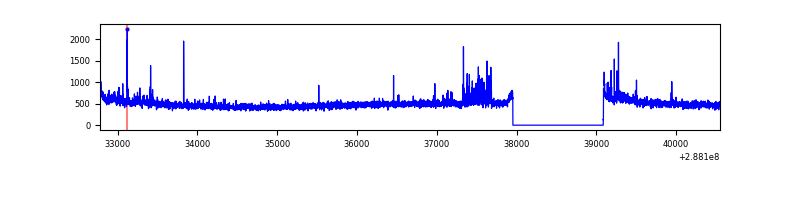 |
| C | 7771 | 6637 | 0 | 0 | 0.00% | 0.00% | 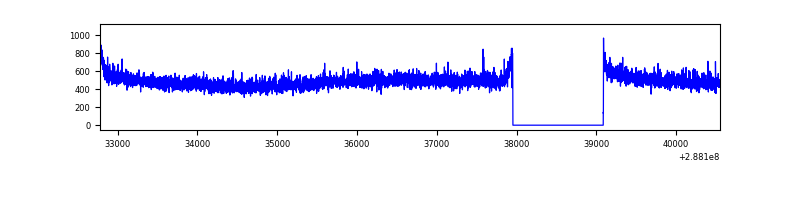 |
| D | 7771 | 6637 | 75 | 75 | 0.97% | 1.13% | 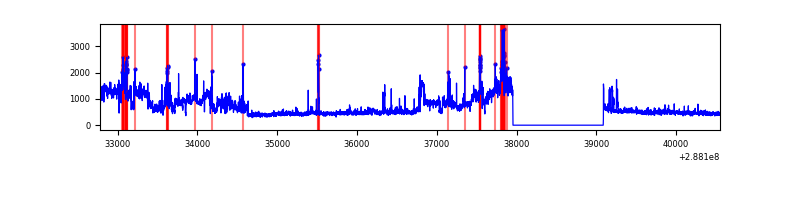 |
Top three noisy pixels from each quadrant. If the there are fewer than three noisy pixels in the level2.evt file, extra rows are filled as -1
| Pixel properties | Quadrant properties | ||||||
|---|---|---|---|---|---|---|---|
| Quadrant | DetID | PixID | Counts | Sigma | Mean | Median | Sigma |
| A | 15 | 174 | 11368 | 64.49 | 813 | 797 | 163.9 |
| A | 0 | 226 | 7189 | 38.99 | 813 | 797 | 163.9 |
| A | 3 | 137 | 5914 | 31.22 | 813 | 797 | 163.9 |
| B | 7 | 220 | 81039 | 513.01 | 821 | 804 | 156.4 |
| B | 0 | 197 | 37223 | 232.86 | 821 | 804 | 156.4 |
| B | 4 | 216 | 18035 | 110.17 | 821 | 804 | 156.4 |
| C | 14 | 238 | 121228 | 660.11 | 783 | 789 | 182.5 |
| C | 3 | 233 | 69282 | 375.4 | 783 | 789 | 182.5 |
| C | 13 | 61 | 5558 | 26.14 | 783 | 789 | 182.5 |
| D | 13 | 168 | 1515711 | 8009.13 | 783 | 760 | 189.2 |
| D | 1 | 52 | 174203 | 916.95 | 783 | 760 | 189.2 |
| D | 2 | 33 | 74796 | 391.41 | 783 | 760 | 189.2 |
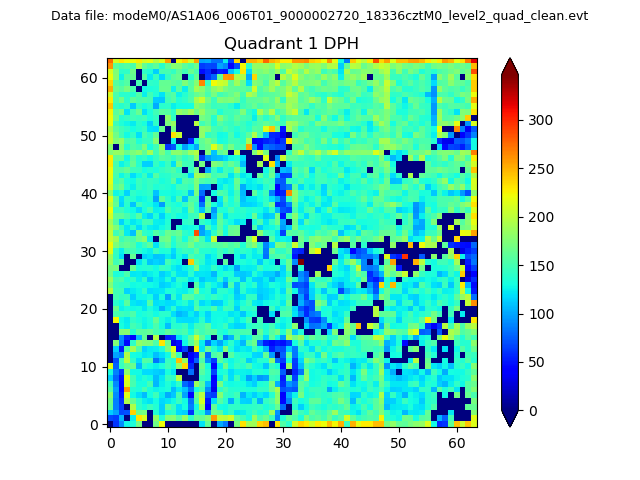
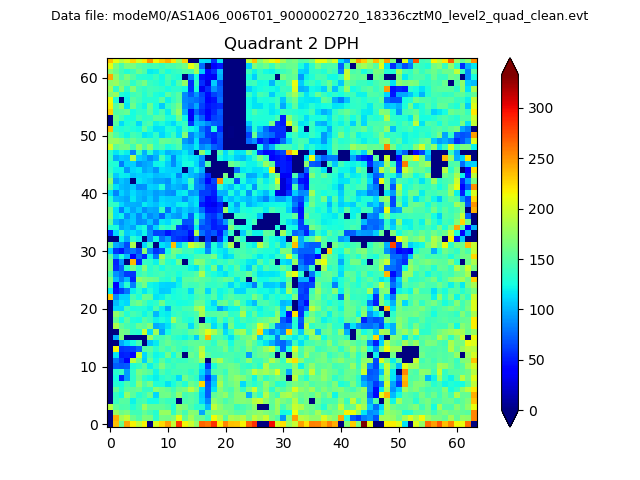
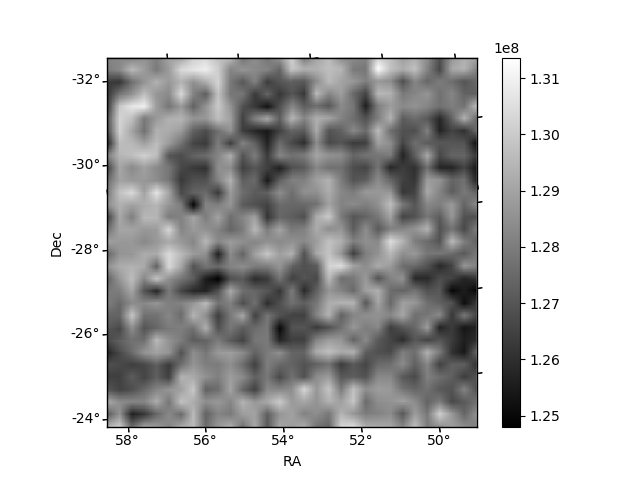
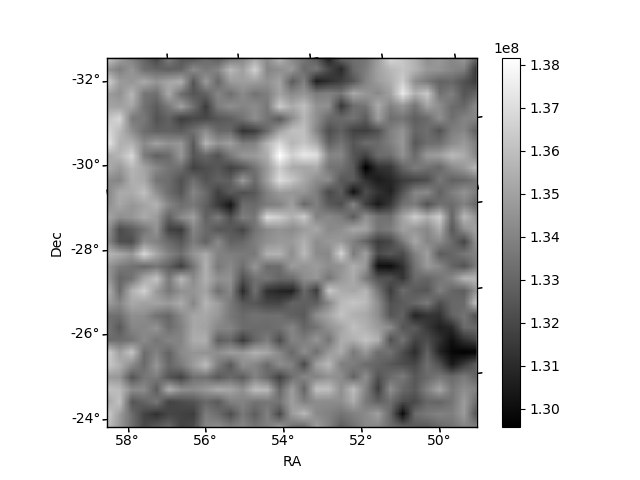
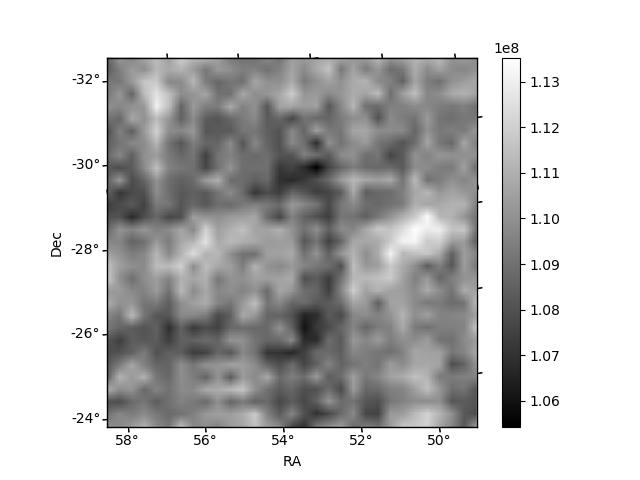
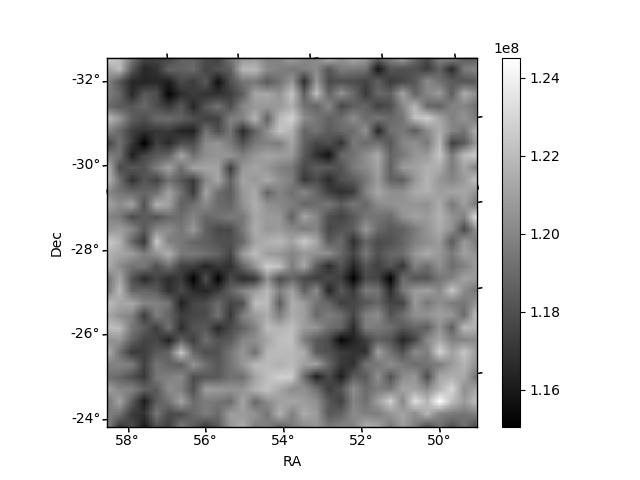
Histogram calculated using DETX and DETY for each event in the final _common_clean file
| Quadrant A |  |
 |
Quadrant B |
|---|---|---|---|
| Quadrant D |  |
 |
Quadrant C |
| Plot type | Count rate plots | Images |
|---|---|---|
| Comparison with Poisson distribution Blue bars denote a histogram of data divided into 1 sec bins. Red curve is a Poisson curve with rate = median count rate of data. |
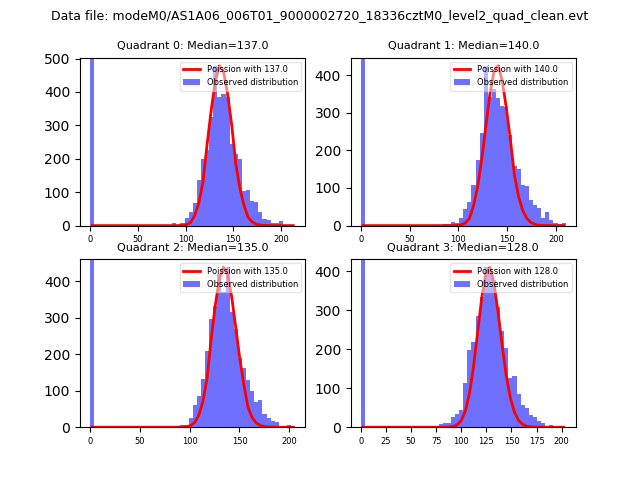 |
 |
| Quadrant-wise count rates Data is divided into 100 sec bins |
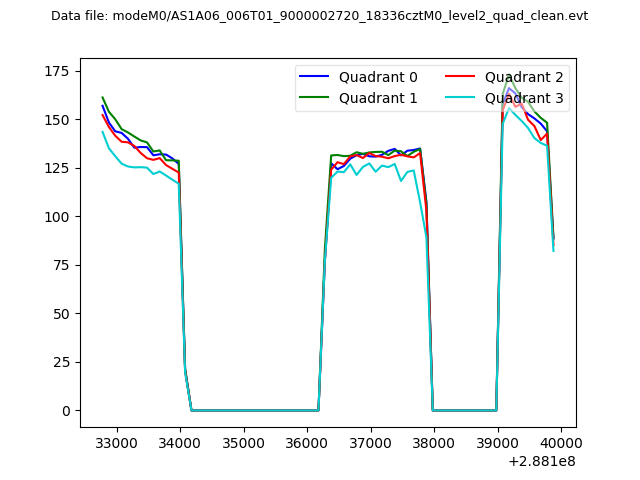 |
|
| Module-wise count rates for Quadrant A Data is divided into 100 sec bins |
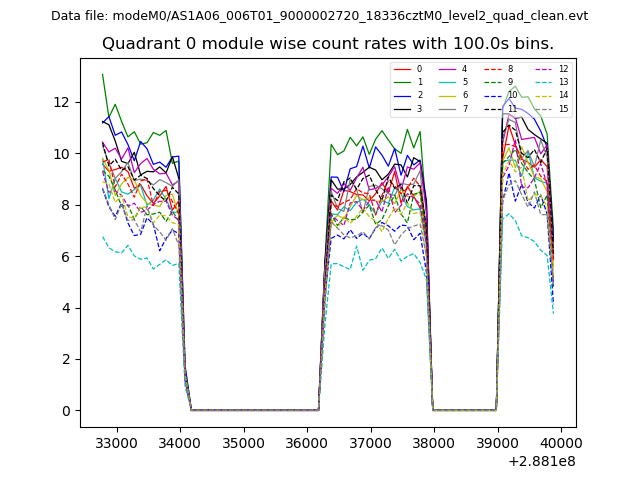 |
 |
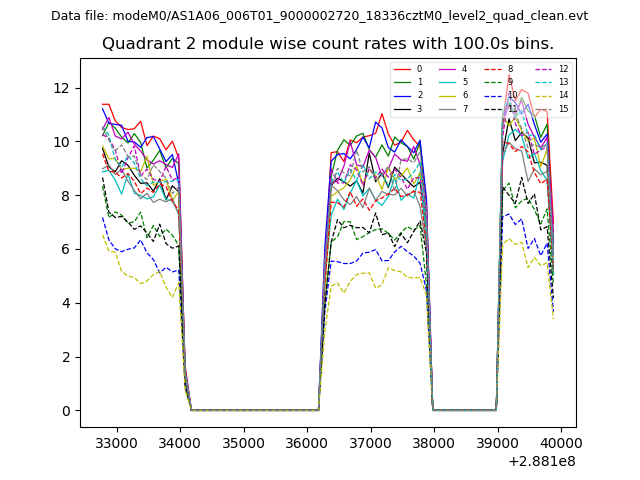
| Module-wise count rates for Quadrant B Data is divided into 100 sec bins |
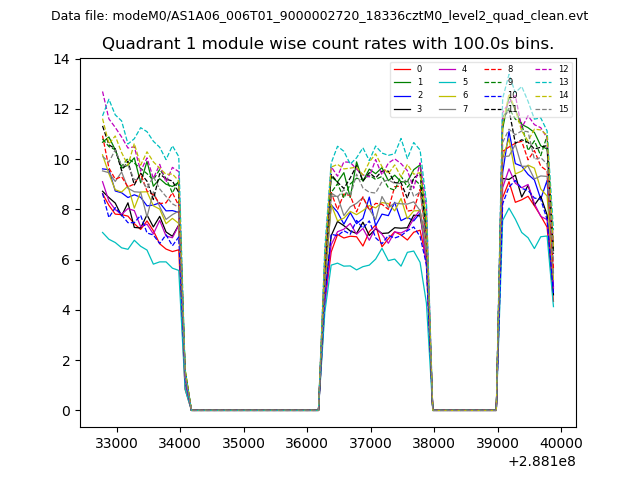 |
 |
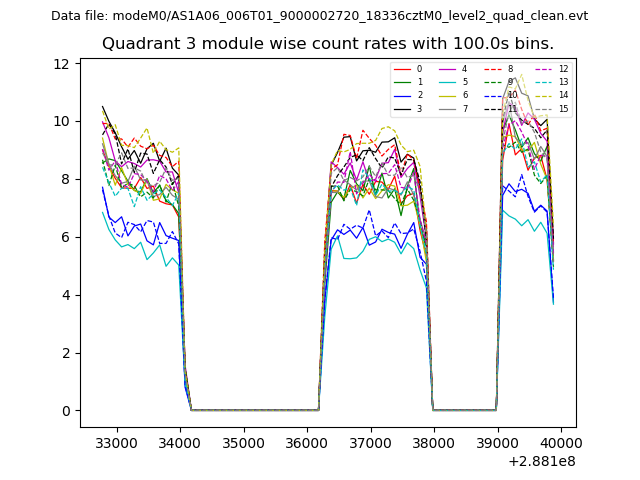
| Module-wise count rates for Quadrant C Data is divided into 100 sec bins |
 |
 |
| Module-wise count rates for Quadrant D Data is divided into 100 sec bins |
 |
 |
| Parameter | Plot |
|---|---|
| CZT HV Monitor | 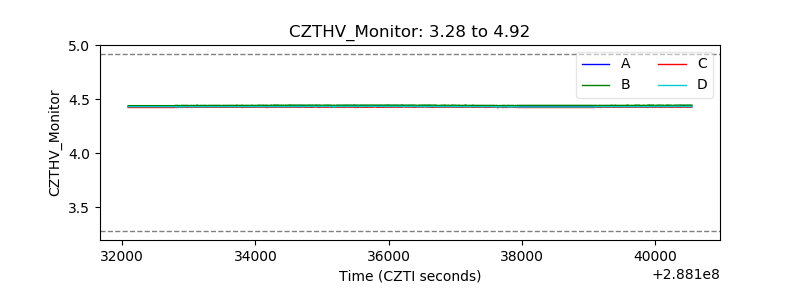 |
| D_VDD |  |
| Temperature 1 | 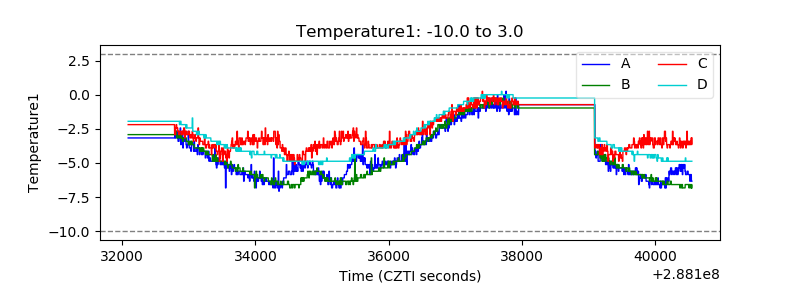 |
| Veto HV Monitor | 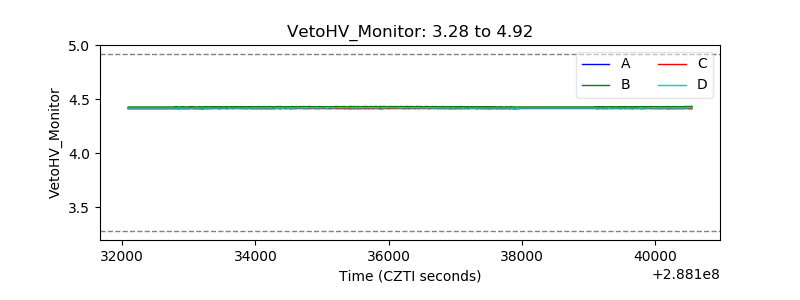 |
| Veto LLD |  |
| Alpha Counter | 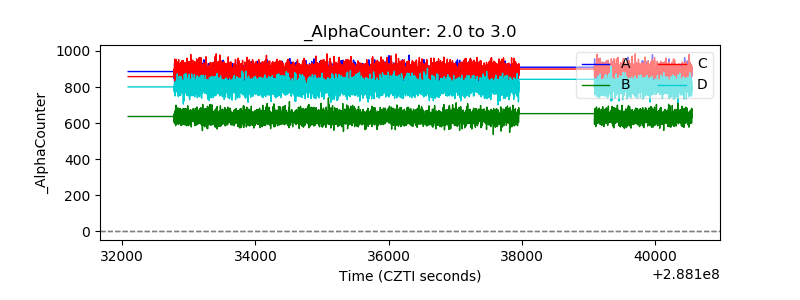 |
| _CPM_Rate | 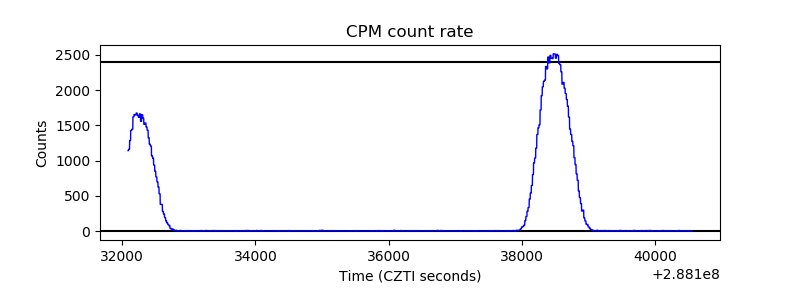 |
| CZT Counter | 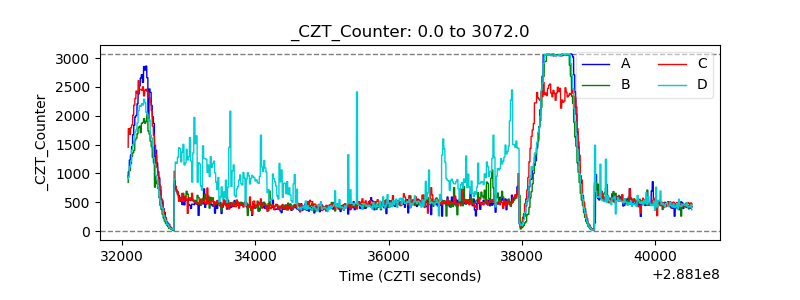 |
| +2.5 Volts monitor |  |
| +5 Volts monitor |  |
| _ROLL_ROT | 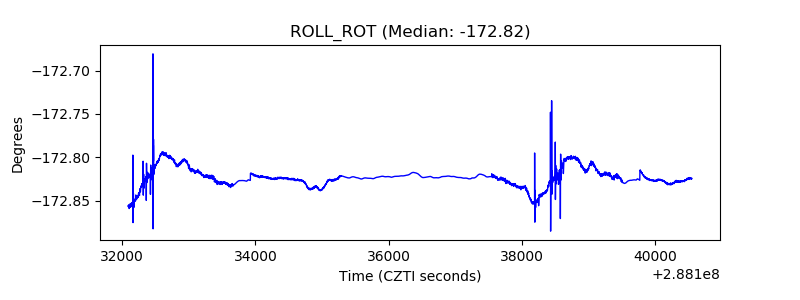 |
| _Roll_DEC | 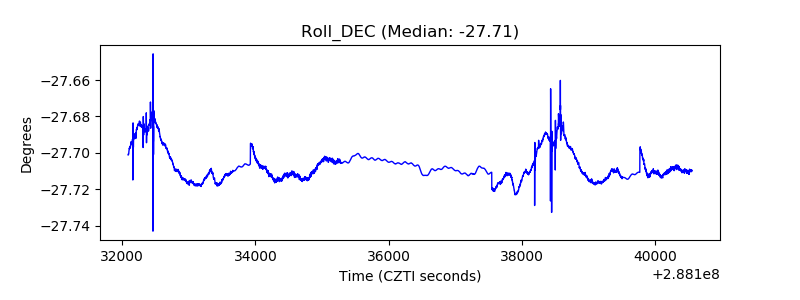 |
| _Roll_RA | 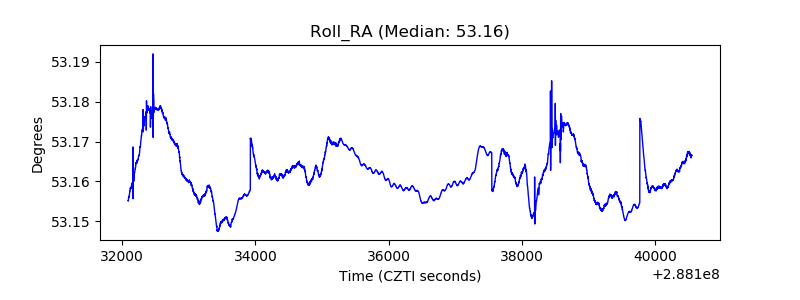 |
| Veto Counter | 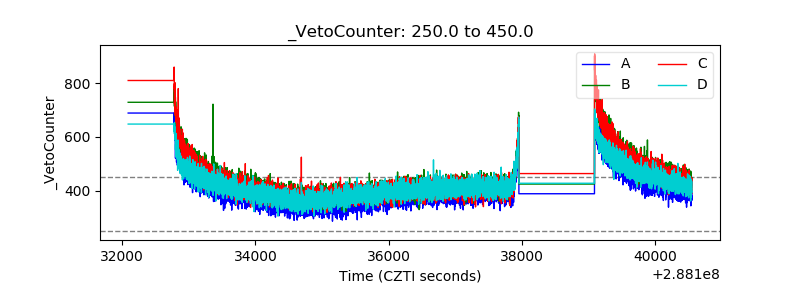 |