| Param | Original file | Final file |
|---|---|---|
| Filename | modeM0/AS1A06_006T01_9000002720_18337cztM0_level2.evt | modeM0/AS1A06_006T01_9000002720_18337cztM0_level2_quad_clean.evt |
| Size (bytes) | 463,746,240 | 76,705,920 |
| Size | 442.3 MB | 73.2 MB |
| Events in quadrant A | 3,201,110 | 473,895 |
| Events in quadrant B | 3,534,572 | 480,389 |
| Events in quadrant C | 3,292,886 | 466,541 |
| Events in quadrant D | 3,575,257 | 449,164 |
| Mode SS | |||
|---|---|---|---|
| Quadrant | BADHDUFLAG | Total packets | Discarded packets |
| A | 0 | 132 | 0 |
| B | 0 | 132 | 0 |
| C | 0 | 132 | 0 |
| D | 0 | 132 | 0 |
| Mode M9 | |||
|---|---|---|---|
| Quadrant | BADHDUFLAG | Total packets | Discarded packets |
| A | 0 | 16 | 0 |
| B | 0 | 17 | 0 |
| C | 0 | 17 | 0 |
| D | 0 | 17 | 0 |
| Mode M0 | |||
|---|---|---|---|
| Quadrant | BADHDUFLAG | Total packets | Discarded packets |
| A | 0 | 13434 | 1 |
| B | 0 | 14523 | 1 |
| C | 0 | 13544 | 1 |
| D | 0 | 14716 | 1 |
| Quadrant | Total seconds | Saturated seconds | Saturation percentage |
|---|---|---|---|
| A | 6489 | 23 | 0.354446% |
| B | 6489 | 66 | 1.017106% |
| C | 6489 | 54 | 0.832178% |
| D | 6489 | 66 | 1.017106% |
Noise dominated data is calculated using 1-second bins in cleaned event files. If a bin has >2000 counts, and if more than 50% of those come from <1% of pixels, then it is considered to be noise-dominated and hence unusable.
| Quadrant | # 1 sec bins | Bins with >0 counts | Bins with >2000 counts | High rate bins dominated by noise | Noise dominated (total time) | Noise dominated (detector-on time) | Marked lightcurve |
|---|---|---|---|---|---|---|---|
| A | 7724 | 6490 | 1 | 1 | 0.01% | 0.02% | 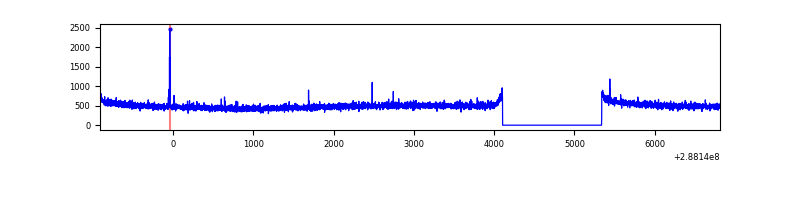 |
| B | 7724 | 6490 | 12 | 12 | 0.16% | 0.18% | 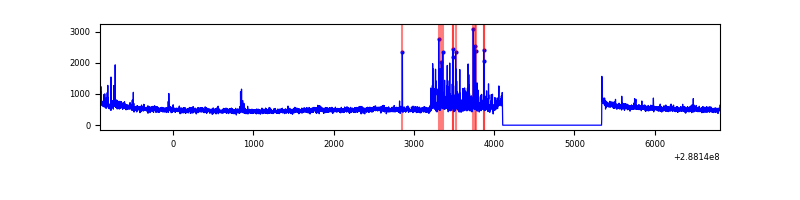 |
| C | 7724 | 6490 | 0 | 0 | 0.00% | 0.00% | 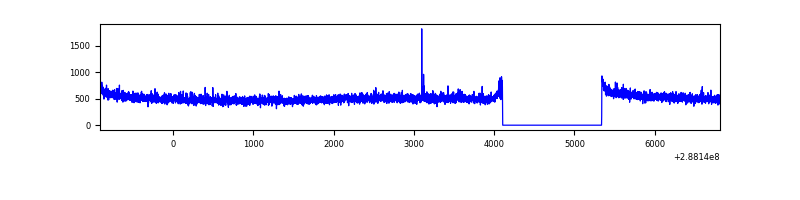 |
| D | 7724 | 6490 | 33 | 33 | 0.43% | 0.51% | 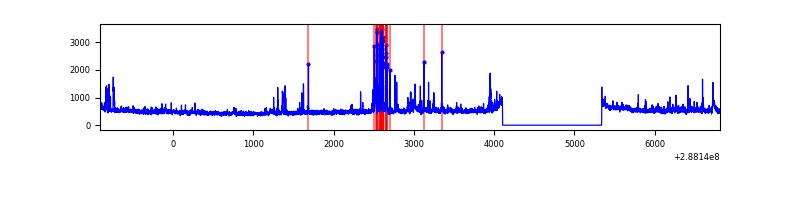 |
Top three noisy pixels from each quadrant. If the there are fewer than three noisy pixels in the level2.evt file, extra rows are filled as -1
| Pixel properties | Quadrant properties | ||||||
|---|---|---|---|---|---|---|---|
| Quadrant | DetID | PixID | Counts | Sigma | Mean | Median | Sigma |
| A | 15 | 174 | 10738 | 59.55 | 829 | 813 | 166.7 |
| A | 0 | 226 | 7230 | 38.5 | 829 | 813 | 166.7 |
| A | 4 | 2 | 7069 | 37.53 | 829 | 813 | 166.7 |
| B | 7 | 220 | 193222 | 1220.3 | 835 | 820 | 157.7 |
| B | 0 | 197 | 24274 | 148.76 | 835 | 820 | 157.7 |
| B | 0 | 198 | 20934 | 127.57 | 835 | 820 | 157.7 |
| C | 14 | 238 | 126698 | 679.64 | 801 | 807 | 185.2 |
| C | 3 | 233 | 39373 | 208.2 | 801 | 807 | 185.2 |
| C | 13 | 61 | 5632 | 26.05 | 801 | 807 | 185.2 |
| D | 1 | 52 | 322853 | 1660.81 | 802 | 781 | 193.9 |
| D | 7 | 223 | 58033 | 295.23 | 802 | 781 | 193.9 |
| D | 7 | 238 | 38583 | 194.93 | 802 | 781 | 193.9 |
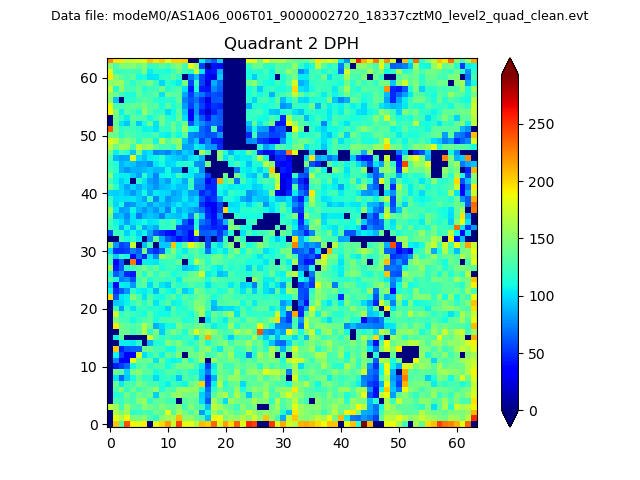
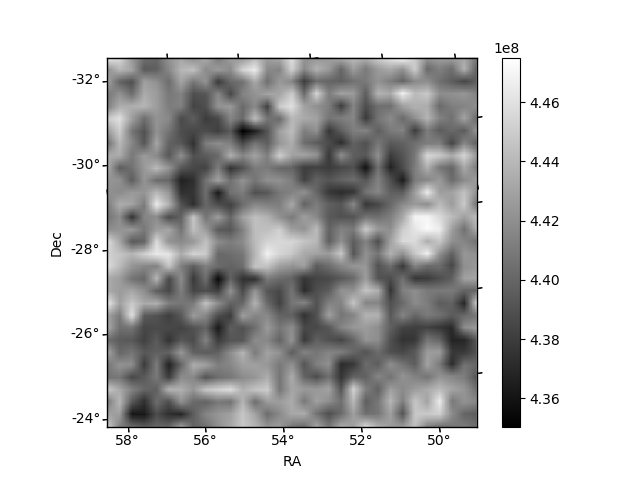
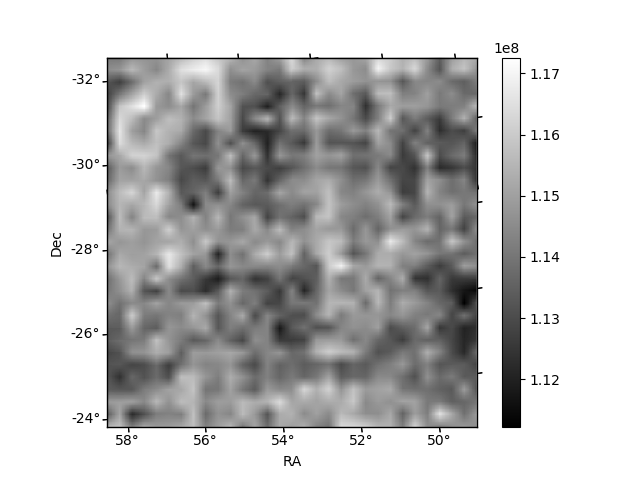
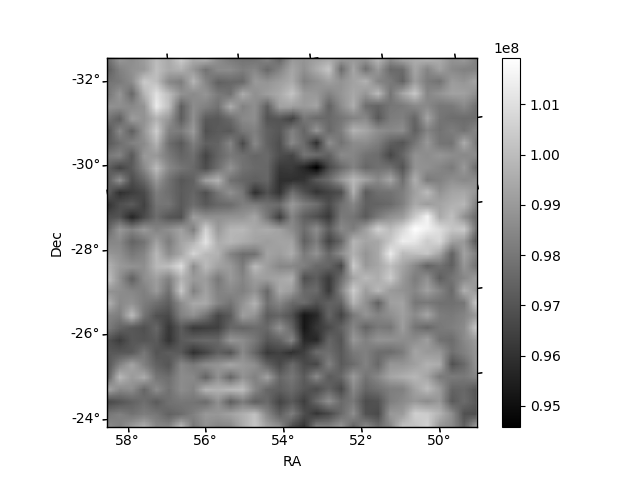
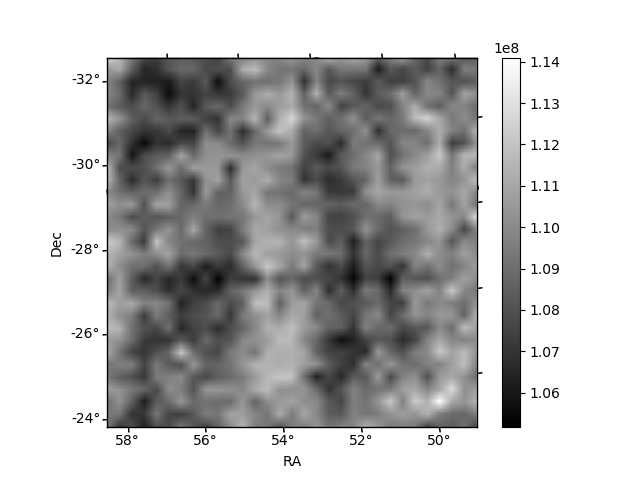
Histogram calculated using DETX and DETY for each event in the final _common_clean file
| Quadrant A | 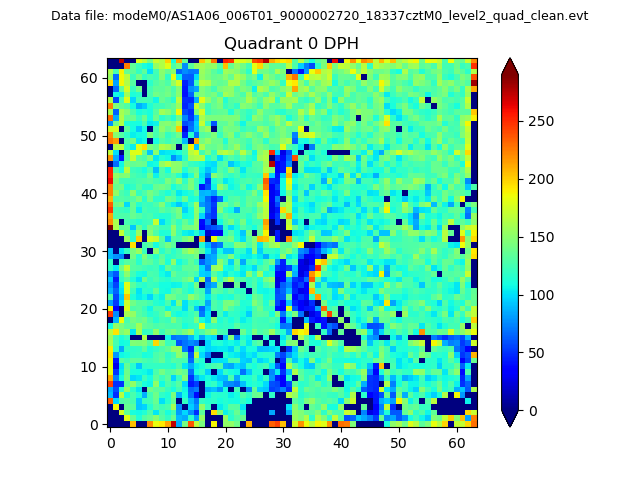 |
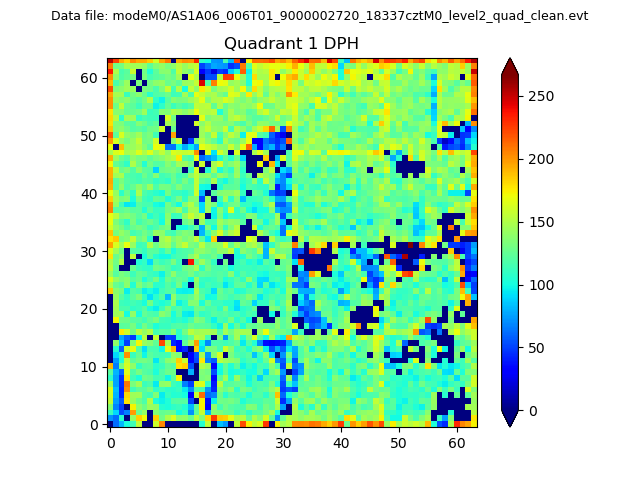 |
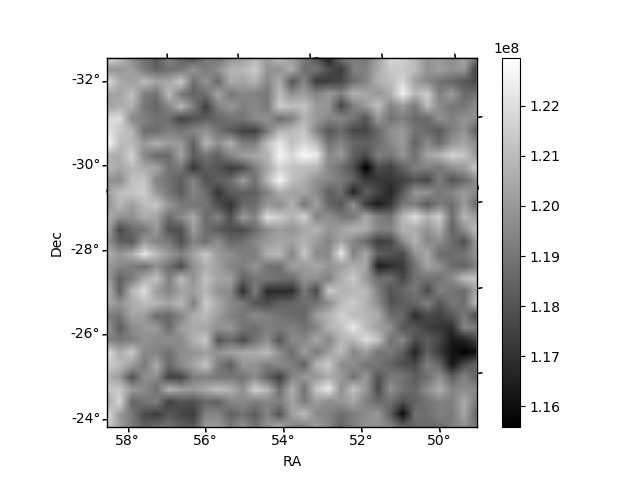
Quadrant B |
|---|---|---|---|
| Quadrant D | 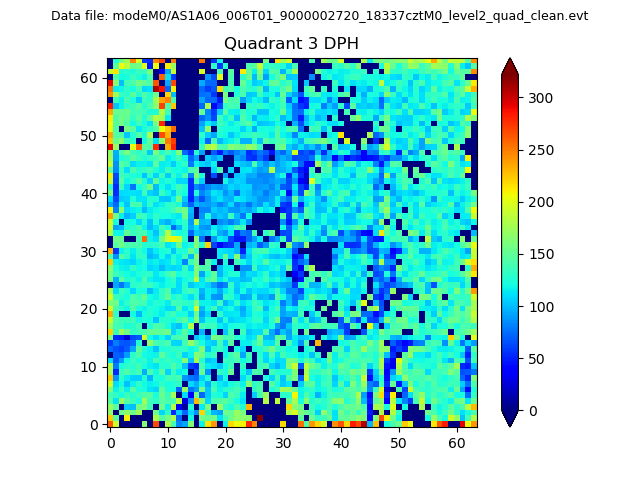 |
 |
Quadrant C |
| Plot type | Count rate plots | Images |
|---|---|---|
| Comparison with Poisson distribution Blue bars denote a histogram of data divided into 1 sec bins. Red curve is a Poisson curve with rate = median count rate of data. |
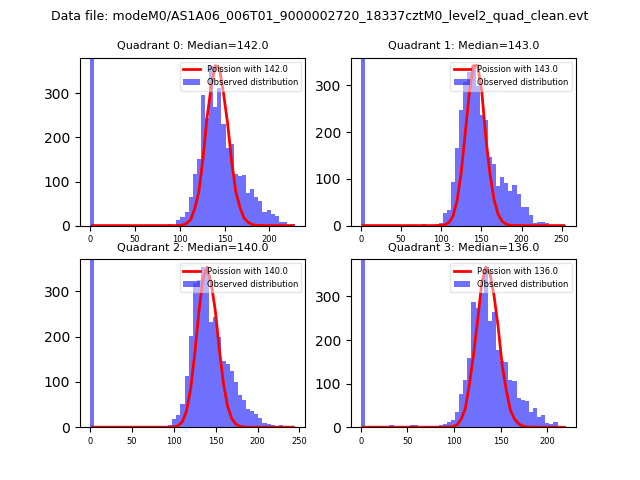 |
 |
| Quadrant-wise count rates Data is divided into 100 sec bins |
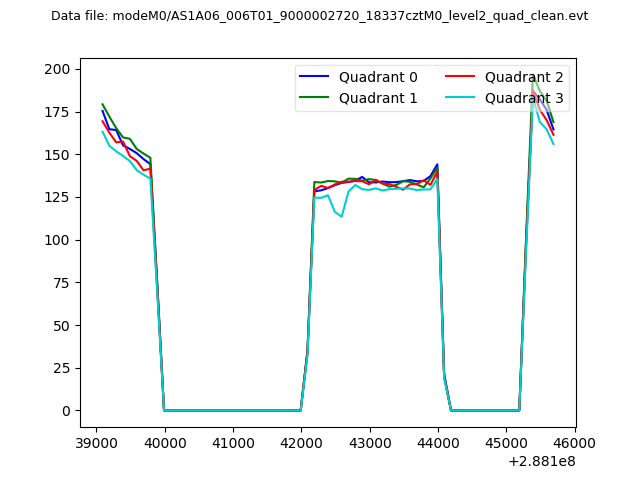 |
|
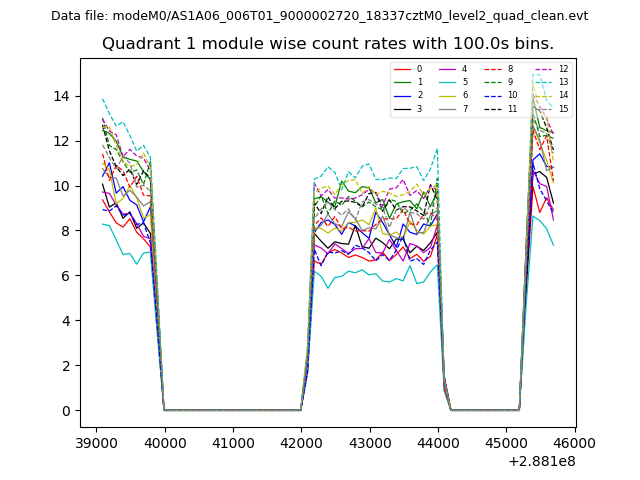
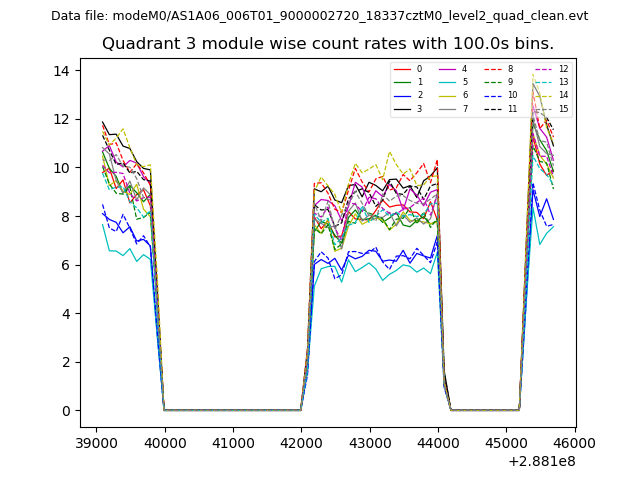
| Module-wise count rates for Quadrant A Data is divided into 100 sec bins |
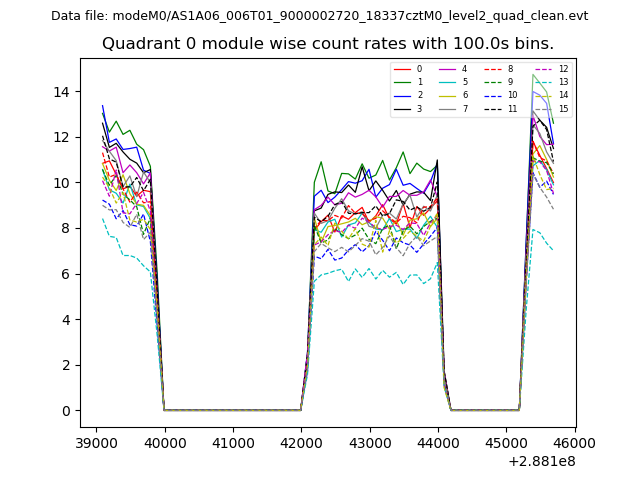 |
 |
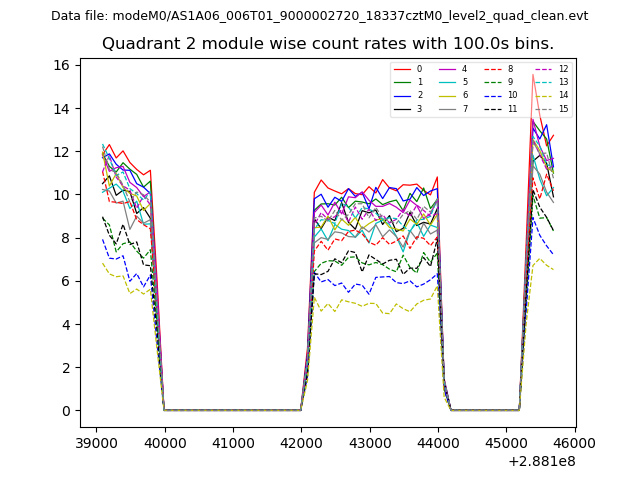
| Module-wise count rates for Quadrant B Data is divided into 100 sec bins |
 |
 |
| Module-wise count rates for Quadrant C Data is divided into 100 sec bins |
 |
 |
| Module-wise count rates for Quadrant D Data is divided into 100 sec bins |
 |
 |
| Parameter | Plot |
|---|---|
| CZT HV Monitor | 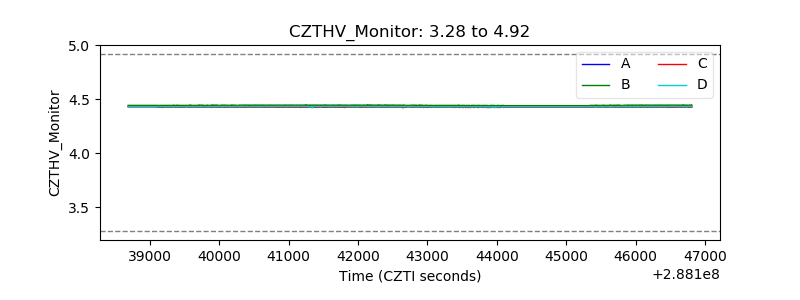 |
| D_VDD | 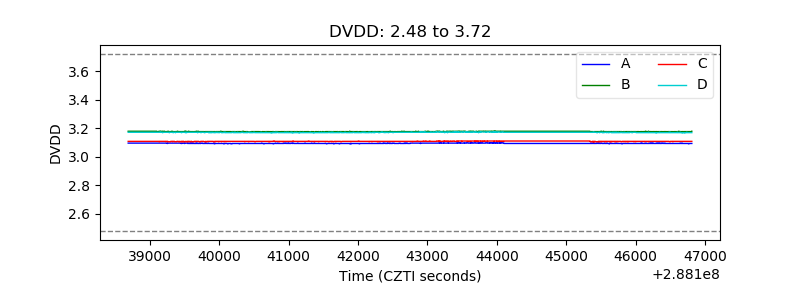 |
| Temperature 1 |  |
| Veto HV Monitor | 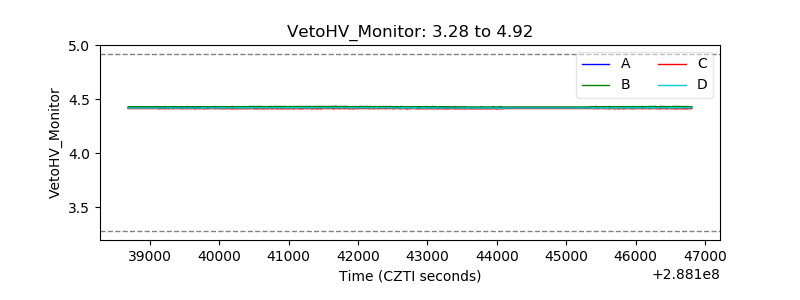 |
| Veto LLD | 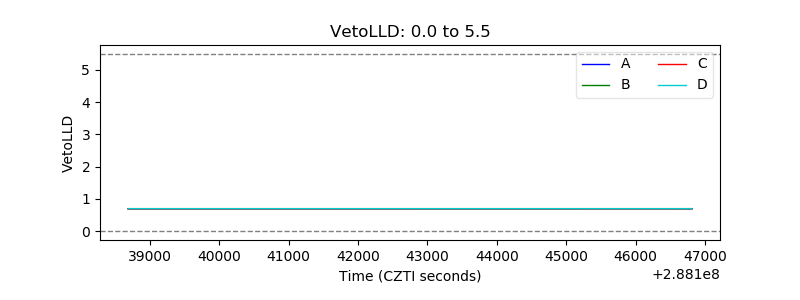 |
| Alpha Counter | 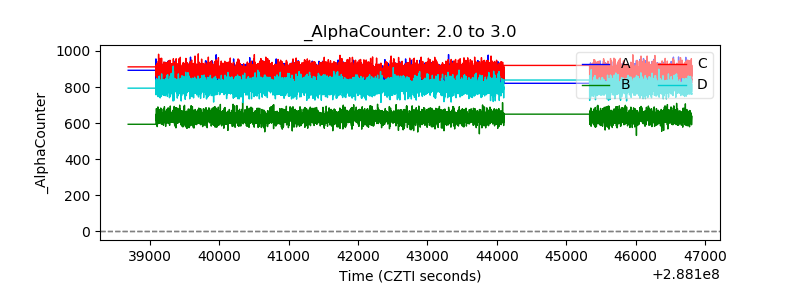 |
| _CPM_Rate | 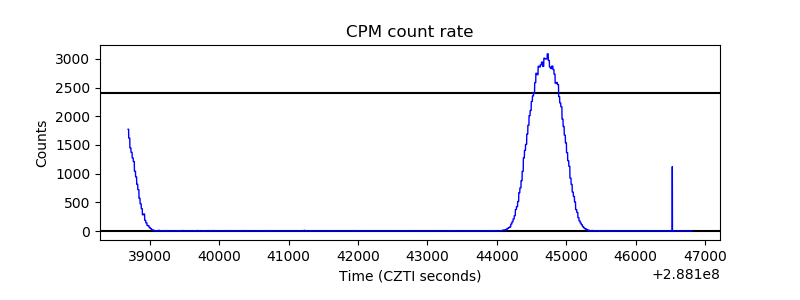 |
| CZT Counter | 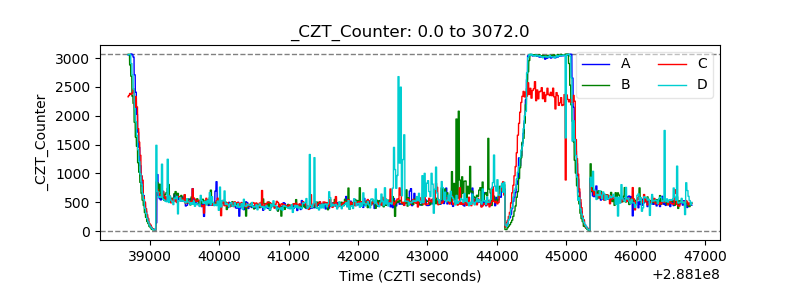 |
| +2.5 Volts monitor |  |
| +5 Volts monitor | 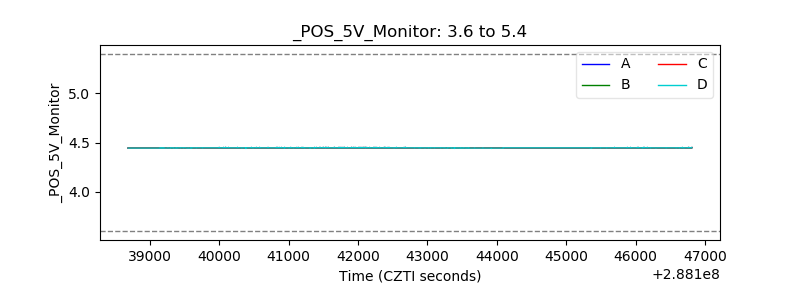 |
| _ROLL_ROT | 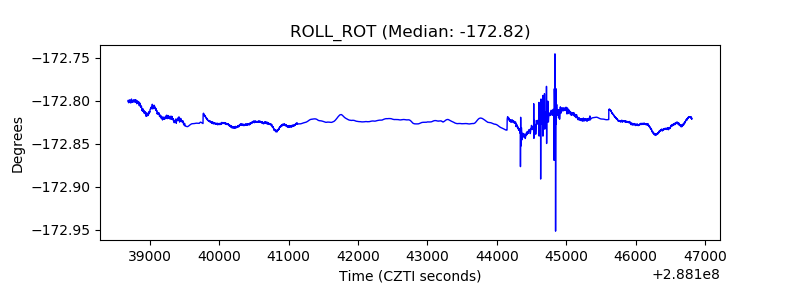 |
| _Roll_DEC | 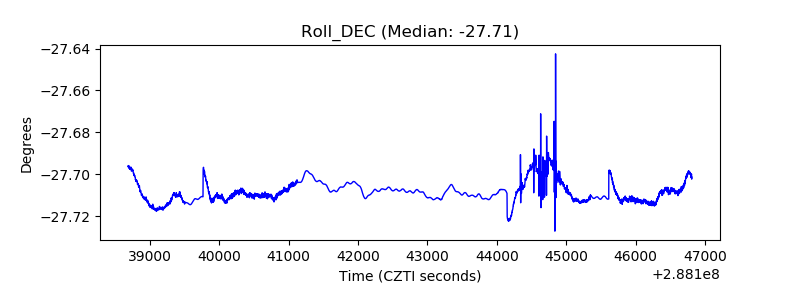 |
| _Roll_RA | 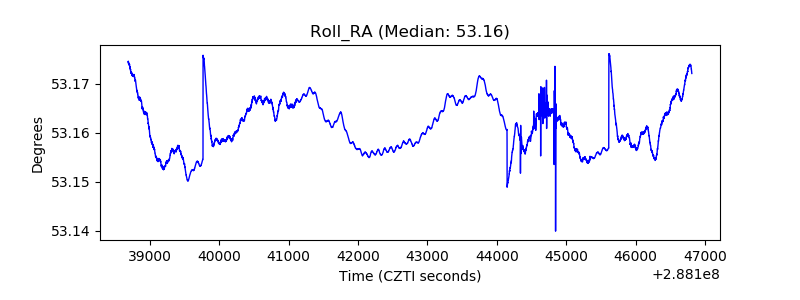 |
| Veto Counter | 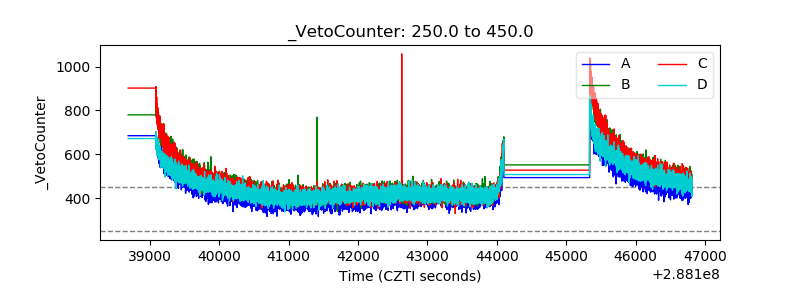 |