| Param | Original file | Final file |
|---|---|---|
| Filename | modeM0/AS1A06_006T01_9000002720_18338cztM0_level2.evt | modeM0/AS1A06_006T01_9000002720_18338cztM0_level2_quad_clean.evt |
| Size (bytes) | 468,976,320 | 63,305,280 |
| Size | 447.3 MB | 60.4 MB |
| Events in quadrant A | 3,192,733 | 374,163 |
| Events in quadrant B | 3,420,069 | 381,889 |
| Events in quadrant C | 3,255,716 | 369,883 |
| Events in quadrant D | 3,912,138 | 356,362 |
| Mode SS | |||
|---|---|---|---|
| Quadrant | BADHDUFLAG | Total packets | Discarded packets |
| A | 0 | 126 | 0 |
| B | 0 | 126 | 0 |
| C | 0 | 126 | 0 |
| D | 0 | 126 | 0 |
| Mode M9 | |||
|---|---|---|---|
| Quadrant | BADHDUFLAG | Total packets | Discarded packets |
| A | 0 | 14 | 0 |
| B | 0 | 14 | 0 |
| C | 0 | 14 | 0 |
| D | 0 | 14 | 0 |
| Mode M0 | |||
|---|---|---|---|
| Quadrant | BADHDUFLAG | Total packets | Discarded packets |
| A | 0 | 13037 | 1 |
| B | 0 | 13753 | 1 |
| C | 0 | 13221 | 1 |
| D | 0 | 15830 | 1 |
| Quadrant | Total seconds | Saturated seconds | Saturation percentage |
|---|---|---|---|
| A | 6224 | 25 | 0.401671% |
| B | 6224 | 69 | 1.108612% |
| C | 6224 | 61 | 0.980077% |
| D | 6224 | 69 | 1.108612% |
Noise dominated data is calculated using 1-second bins in cleaned event files. If a bin has >2000 counts, and if more than 50% of those come from <1% of pixels, then it is considered to be noise-dominated and hence unusable.
| Quadrant | # 1 sec bins | Bins with >0 counts | Bins with >2000 counts | High rate bins dominated by noise | Noise dominated (total time) | Noise dominated (detector-on time) | Marked lightcurve |
|---|---|---|---|---|---|---|---|
| A | 7564 | 6225 | 0 | 0 | 0.00% | 0.00% | 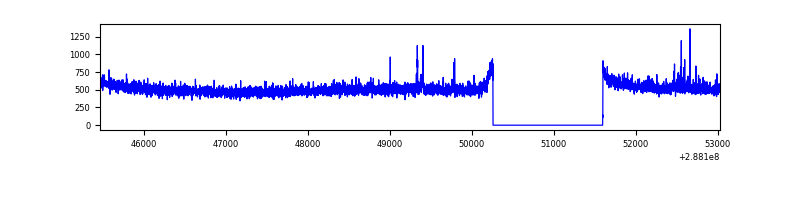 |
| B | 7564 | 6225 | 26 | 26 | 0.34% | 0.42% | 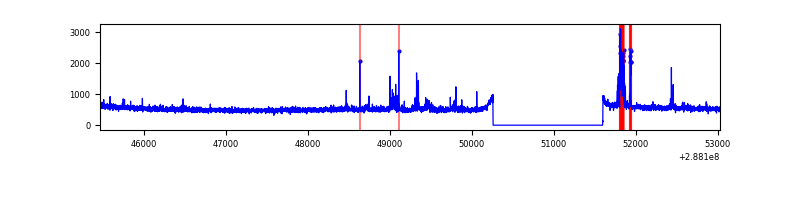 |
| C | 7564 | 6225 | 0 | 0 | 0.00% | 0.00% | 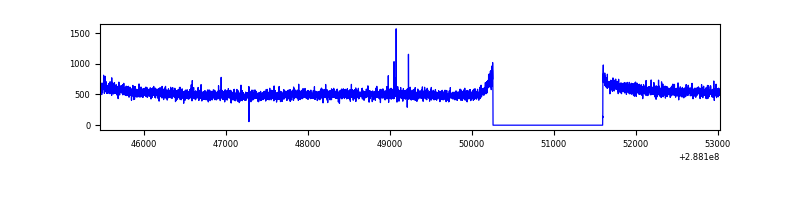 |
| D | 7564 | 6225 | 43 | 43 | 0.57% | 0.69% | 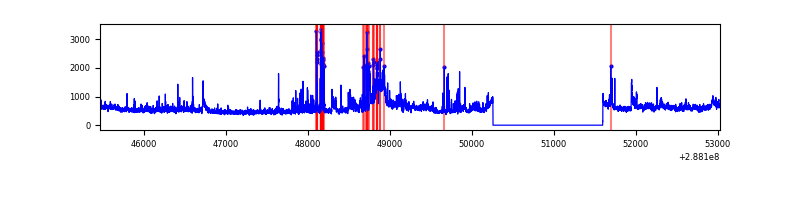 |
Top three noisy pixels from each quadrant. If the there are fewer than three noisy pixels in the level2.evt file, extra rows are filled as -1
| Pixel properties | Quadrant properties | ||||||
|---|---|---|---|---|---|---|---|
| Quadrant | DetID | PixID | Counts | Sigma | Mean | Median | Sigma |
| A | 4 | 2 | 14653 | 84.59 | 824 | 810 | 163.7 |
| A | 15 | 174 | 8727 | 48.38 | 824 | 810 | 163.7 |
| A | 0 | 226 | 7286 | 39.57 | 824 | 810 | 163.7 |
| B | 4 | 171 | 106429 | 672.02 | 832 | 814 | 157.2 |
| B | 7 | 220 | 41390 | 258.18 | 832 | 814 | 157.2 |
| B | 12 | 111 | 17214 | 104.35 | 832 | 814 | 157.2 |
| C | 14 | 238 | 126176 | 681.99 | 799 | 808 | 183.8 |
| C | 0 | 207 | 8252 | 40.49 | 799 | 808 | 183.8 |
| C | 13 | 61 | 5706 | 26.64 | 799 | 808 | 183.8 |
| D | 1 | 52 | 650423 | 3323.59 | 803 | 780 | 195.5 |
| D | 7 | 238 | 140681 | 715.74 | 803 | 780 | 195.5 |
| D | 7 | 223 | 36175 | 181.08 | 803 | 780 | 195.5 |
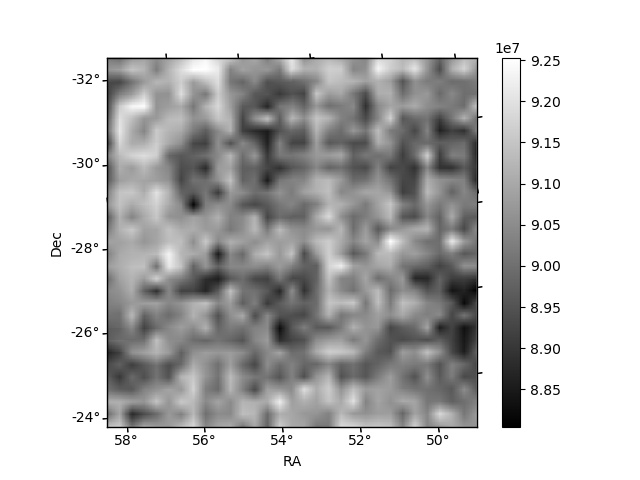
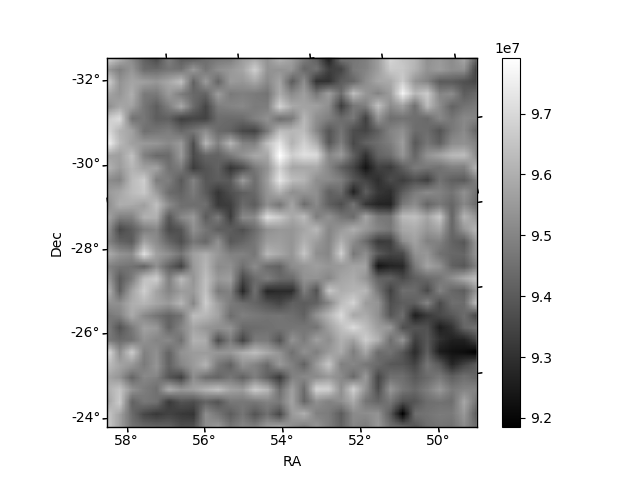
Histogram calculated using DETX and DETY for each event in the final _common_clean file
| Quadrant A | 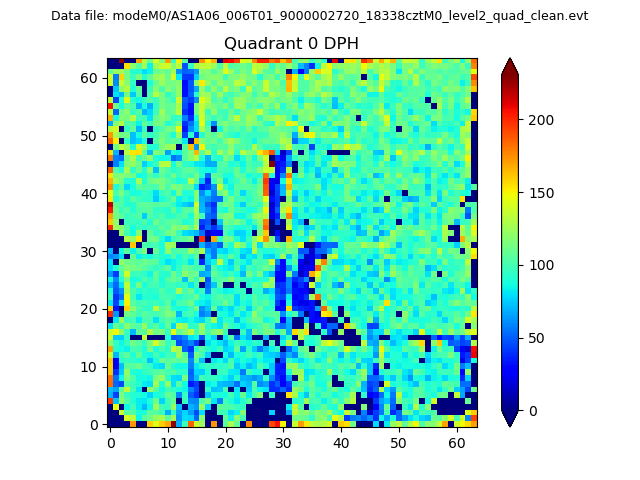 |
 |
Quadrant B |
|---|---|---|---|
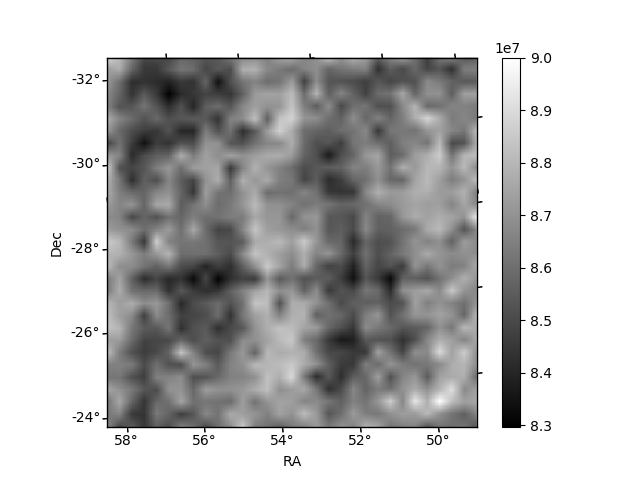
| Quadrant D | 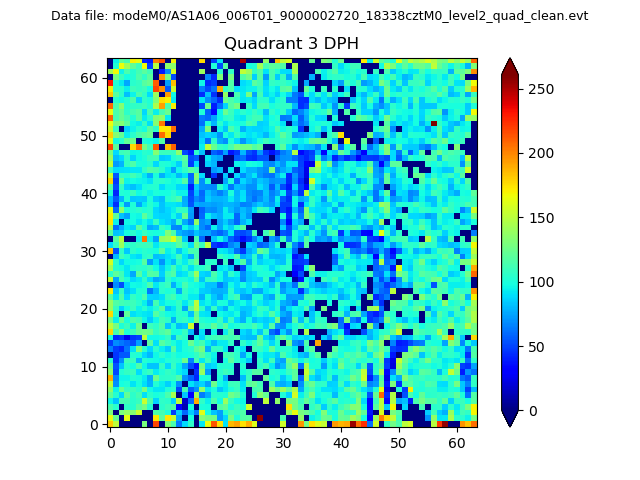 |
 |
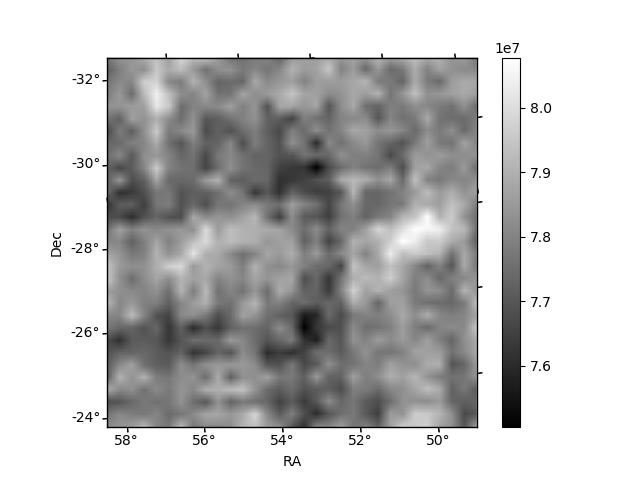
Quadrant C |
| Plot type | Count rate plots | Images |
|---|---|---|
| Comparison with Poisson distribution Blue bars denote a histogram of data divided into 1 sec bins. Red curve is a Poisson curve with rate = median count rate of data. |
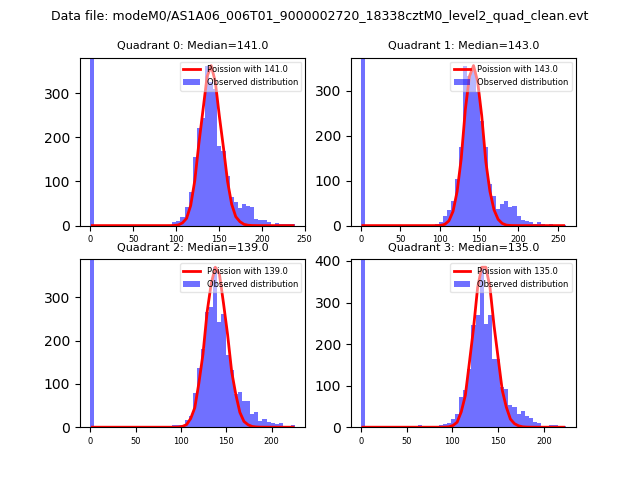 |
 |
| Quadrant-wise count rates Data is divided into 100 sec bins |
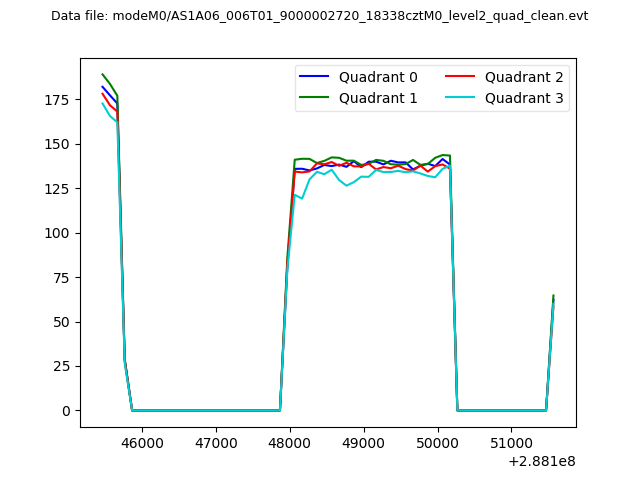 |
|
| Module-wise count rates for Quadrant A Data is divided into 100 sec bins |
 |
 |
| Module-wise count rates for Quadrant B Data is divided into 100 sec bins |
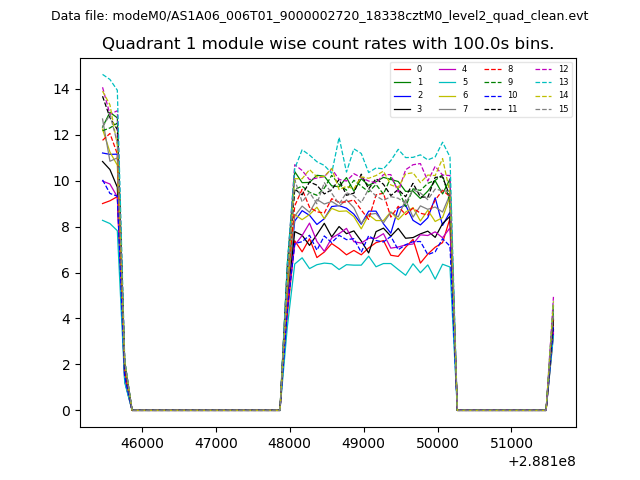 |
 |
| Module-wise count rates for Quadrant C Data is divided into 100 sec bins |
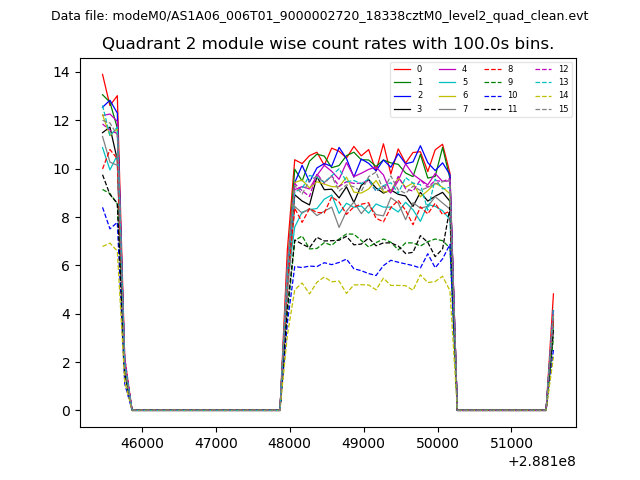 |
 |
| Module-wise count rates for Quadrant D Data is divided into 100 sec bins |
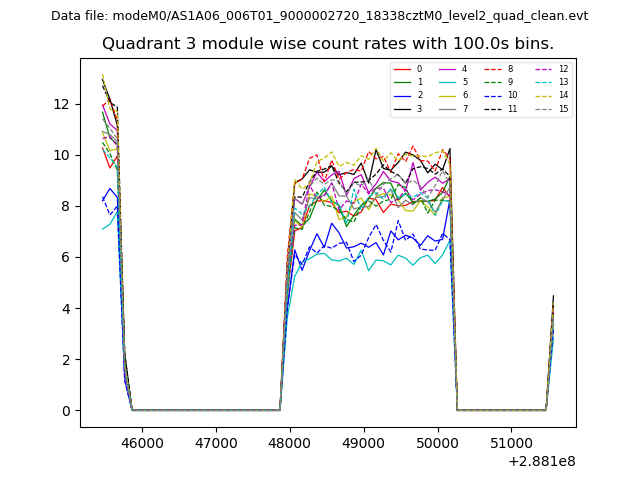 |
 |
| Parameter | Plot |
|---|---|
| CZT HV Monitor | 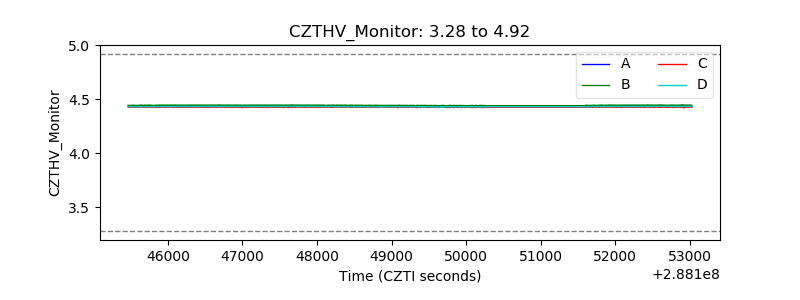 |
| D_VDD | 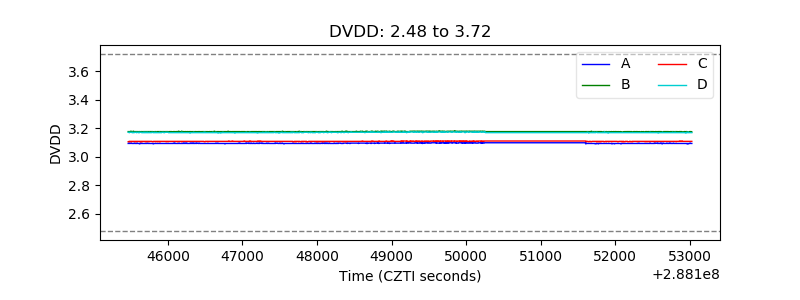 |
| Temperature 1 | 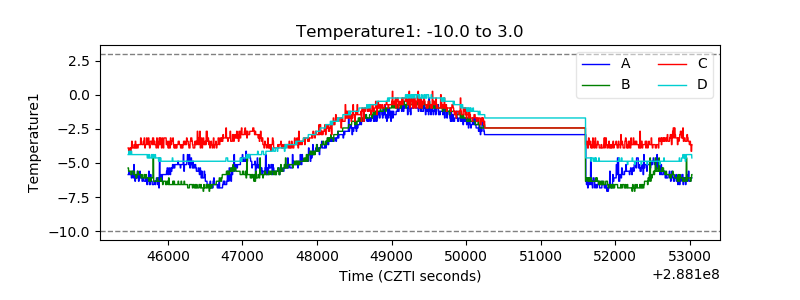 |
| Veto HV Monitor | 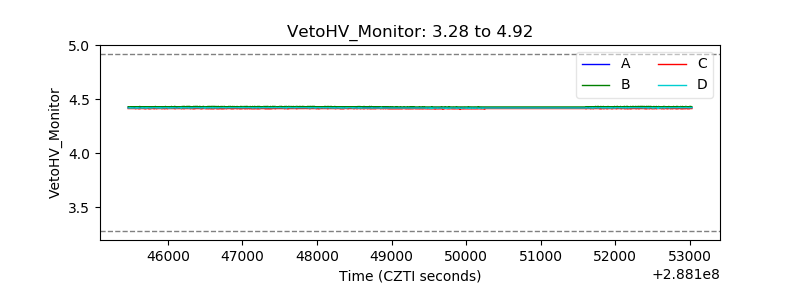 |
| Veto LLD | 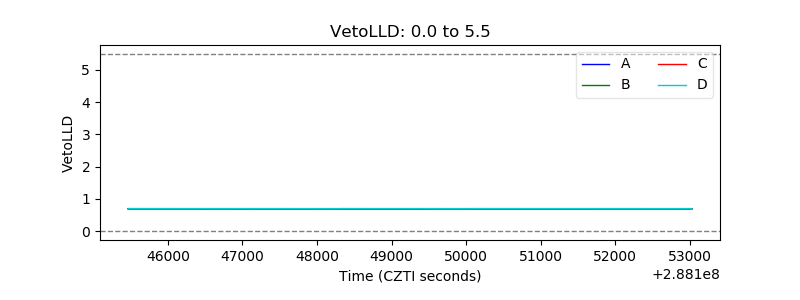 |
| Alpha Counter | 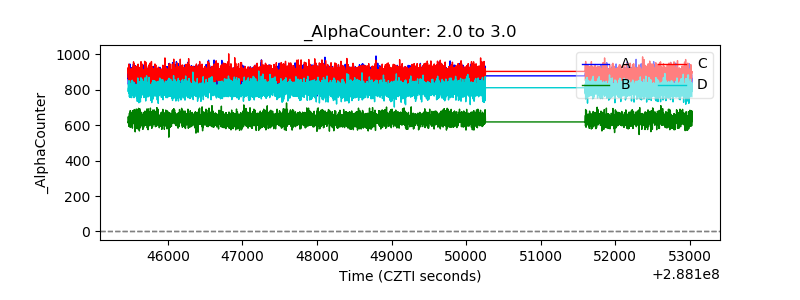 |
| _CPM_Rate | 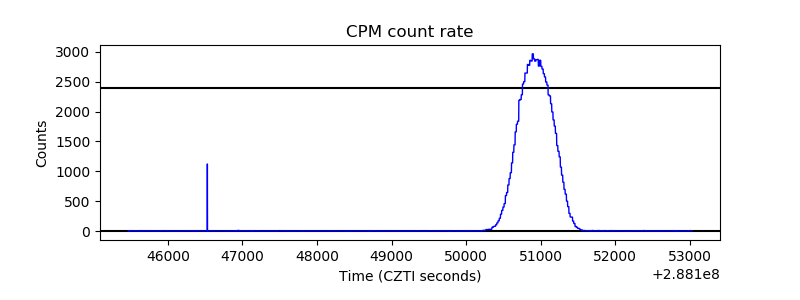 |
| CZT Counter | 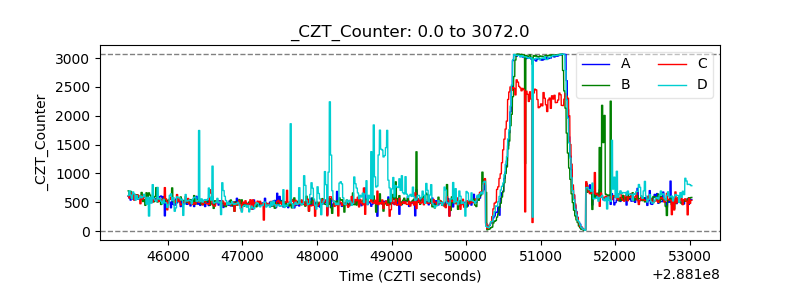 |
| +2.5 Volts monitor |  |
| +5 Volts monitor |  |
| _ROLL_ROT | 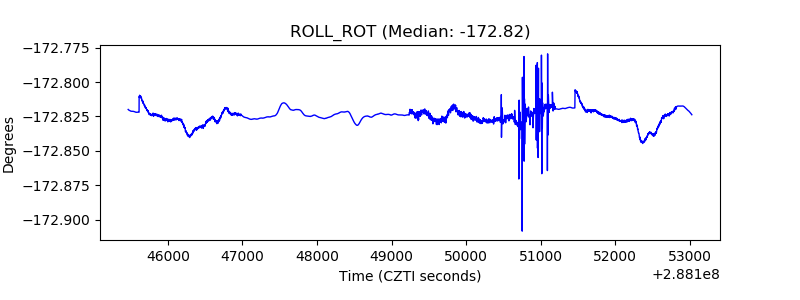 |
| _Roll_DEC | 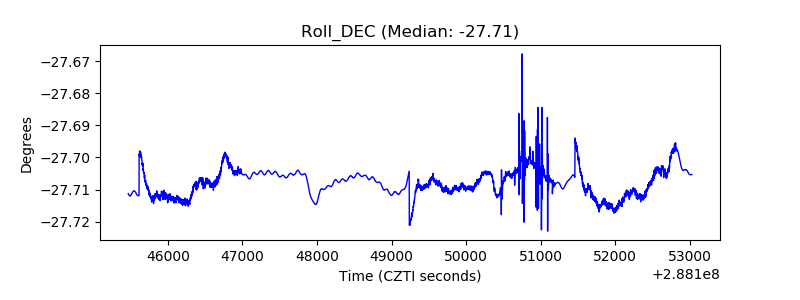 |
| _Roll_RA | 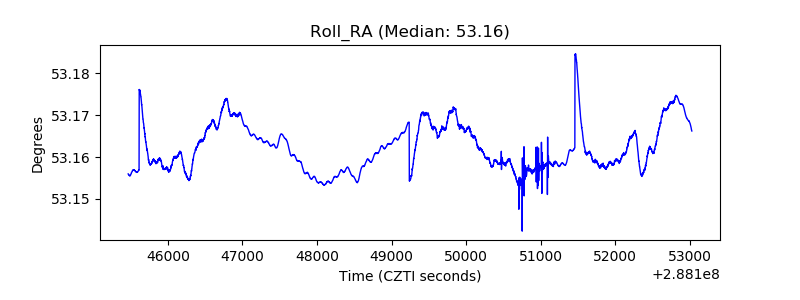 |
| Veto Counter | 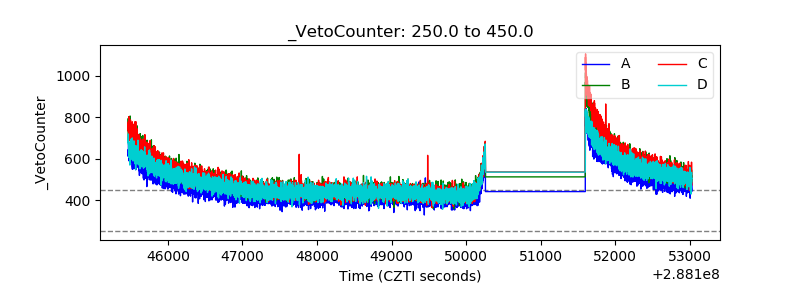 |