| Param | Original file | Final file |
|---|---|---|
| Filename | modeM0/AS1A06_006T01_9000002720_18340cztM0_level2.evt | modeM0/AS1A06_006T01_9000002720_18340cztM0_level2_quad_clean.evt |
| Size (bytes) | 492,704,640 | 71,303,040 |
| Size | 469.9 MB | 68.0 MB |
| Events in quadrant A | 3,541,921 | 434,692 |
| Events in quadrant B | 3,560,425 | 440,152 |
| Events in quadrant C | 3,539,658 | 428,545 |
| Events in quadrant D | 3,857,909 | 421,722 |
| Mode SS | |||
|---|---|---|---|
| Quadrant | BADHDUFLAG | Total packets | Discarded packets |
| A | 0 | 128 | 0 |
| B | 0 | 128 | 0 |
| C | 0 | 128 | 0 |
| D | 0 | 128 | 0 |
| Mode M9 | |||
|---|---|---|---|
| Quadrant | BADHDUFLAG | Total packets | Discarded packets |
| A | 0 | 19 | 0 |
| B | 0 | 20 | 0 |
| C | 0 | 20 | 0 |
| D | 0 | 20 | 0 |
| Mode M0 | |||
|---|---|---|---|
| Quadrant | BADHDUFLAG | Total packets | Discarded packets |
| A | 0 | 14082 | 2 |
| B | 0 | 14153 | 2 |
| C | 0 | 14184 | 2 |
| D | 0 | 15354 | 2 |
| Quadrant | Total seconds | Saturated seconds | Saturation percentage |
|---|---|---|---|
| A | 6208 | 151 | 2.432345% |
| B | 6208 | 115 | 1.852448% |
| C | 6208 | 164 | 2.641753% |
| D | 6208 | 107 | 1.723582% |
Noise dominated data is calculated using 1-second bins in cleaned event files. If a bin has >2000 counts, and if more than 50% of those come from <1% of pixels, then it is considered to be noise-dominated and hence unusable.
| Quadrant | # 1 sec bins | Bins with >0 counts | Bins with >2000 counts | High rate bins dominated by noise | Noise dominated (total time) | Noise dominated (detector-on time) | Marked lightcurve |
|---|---|---|---|---|---|---|---|
| A | 7483 | 6209 | 65 | 65 | 0.87% | 1.05% | 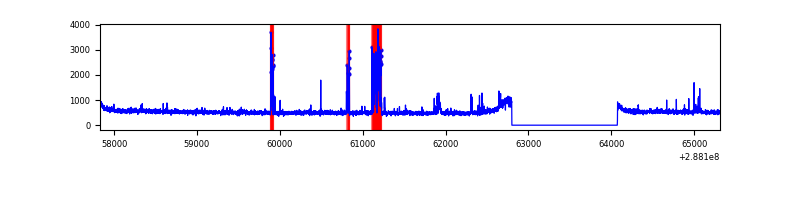 |
| B | 7483 | 6209 | 11 | 11 | 0.15% | 0.18% | 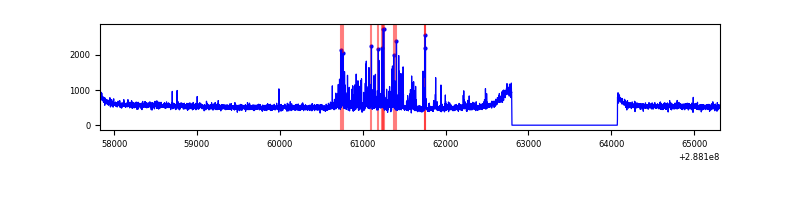 |
| C | 7483 | 6209 | 18 | 18 | 0.24% | 0.29% | 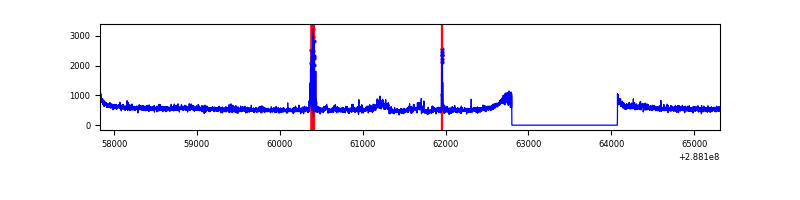 |
| D | 7483 | 6209 | 13 | 13 | 0.17% | 0.21% | 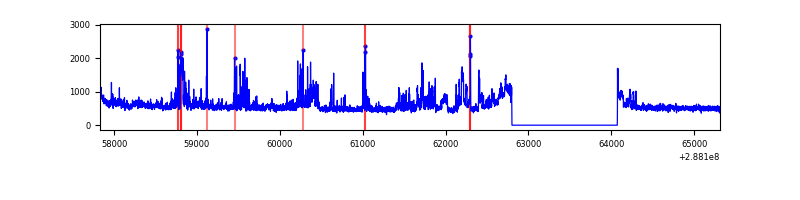 |
Top three noisy pixels from each quadrant. If the there are fewer than three noisy pixels in the level2.evt file, extra rows are filled as -1
| Pixel properties | Quadrant properties | ||||||
|---|---|---|---|---|---|---|---|
| Quadrant | DetID | PixID | Counts | Sigma | Mean | Median | Sigma |
| A | 4 | 2 | 264810 | 1563.72 | 839 | 823 | 168.8 |
| A | 15 | 174 | 29994 | 172.79 | 839 | 823 | 168.8 |
| A | 14 | 237 | 25040 | 143.45 | 839 | 823 | 168.8 |
| B | 7 | 220 | 220034 | 1381.79 | 843 | 821 | 158.6 |
| B | 12 | 111 | 17228 | 103.42 | 843 | 821 | 158.6 |
| B | 11 | 111 | 14697 | 87.46 | 843 | 821 | 158.6 |
| C | 3 | 233 | 178077 | 949.53 | 809 | 816 | 186.7 |
| C | 14 | 238 | 126742 | 674.54 | 809 | 816 | 186.7 |
| C | 0 | 207 | 82876 | 439.57 | 809 | 816 | 186.7 |
| D | 1 | 52 | 475679 | 2385.4 | 823 | 802 | 199.1 |
| D | 14 | 34 | 169898 | 849.4 | 823 | 802 | 199.1 |
| D | 13 | 104 | 35720 | 175.4 | 823 | 802 | 199.1 |
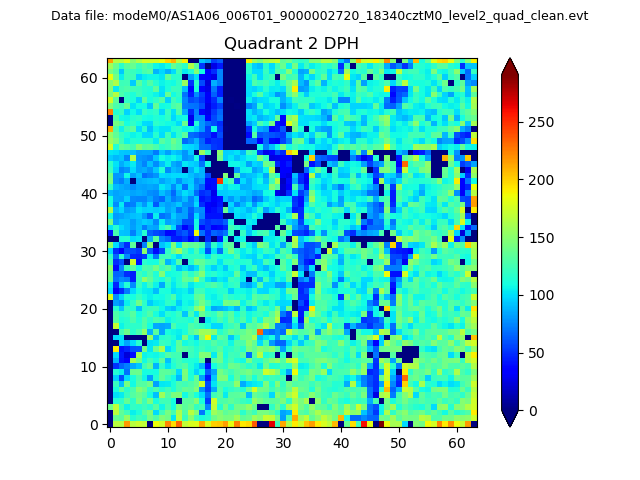
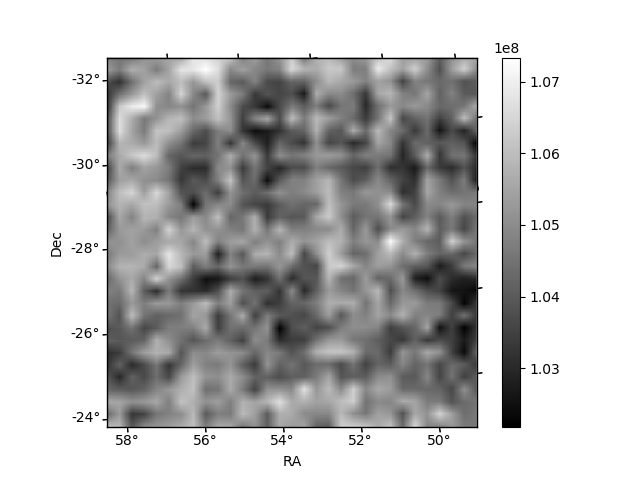
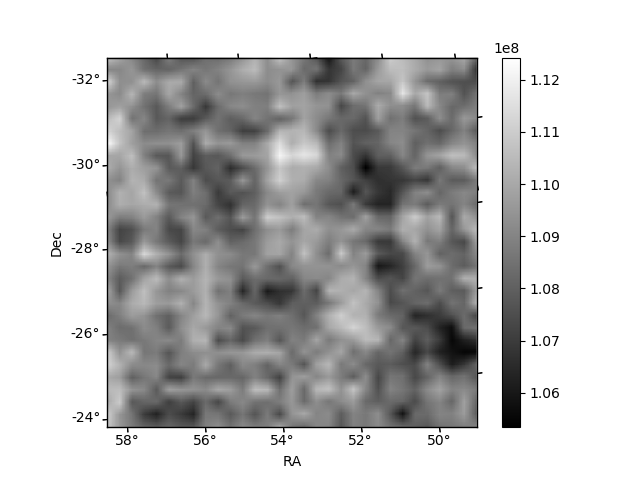
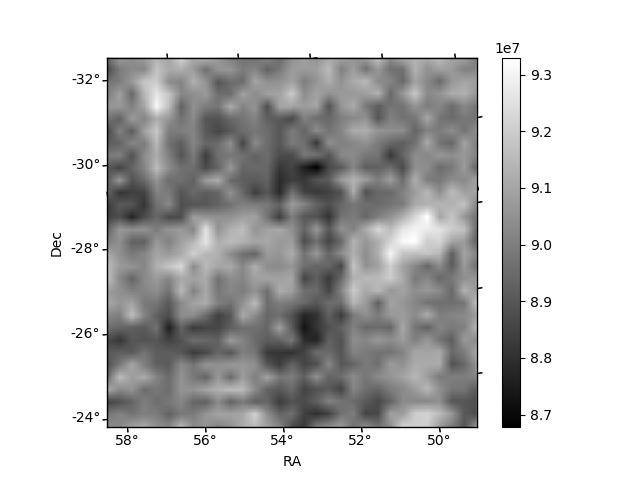
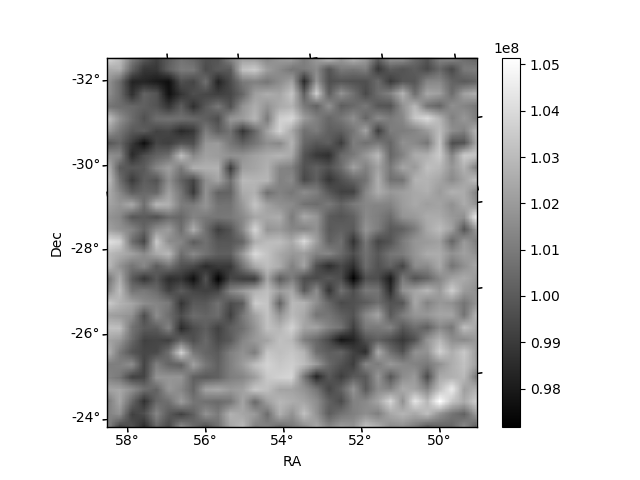
Histogram calculated using DETX and DETY for each event in the final _common_clean file
| Quadrant A | 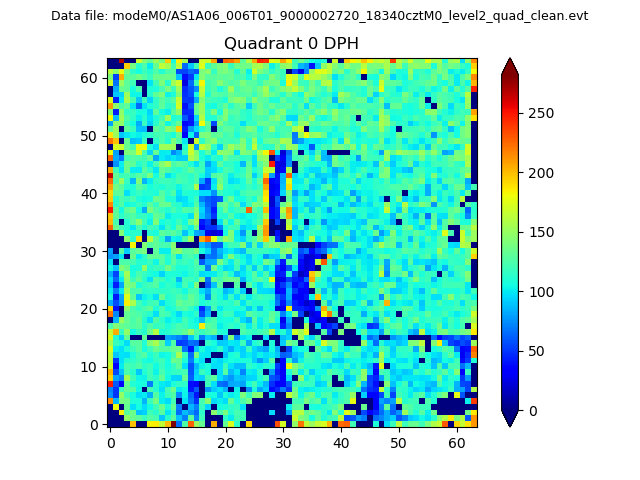 |
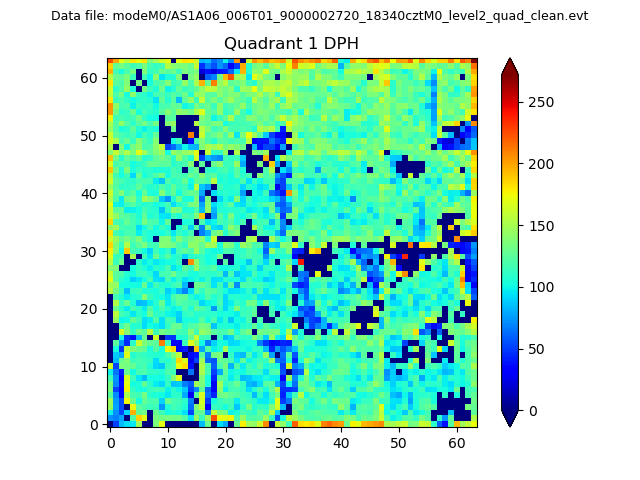 |
Quadrant B |
|---|---|---|---|
| Quadrant D | 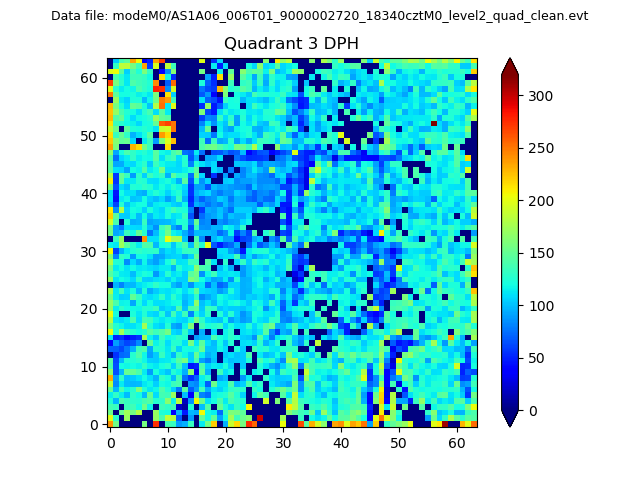 |
 |
Quadrant C |
| Plot type | Count rate plots | Images |
|---|---|---|
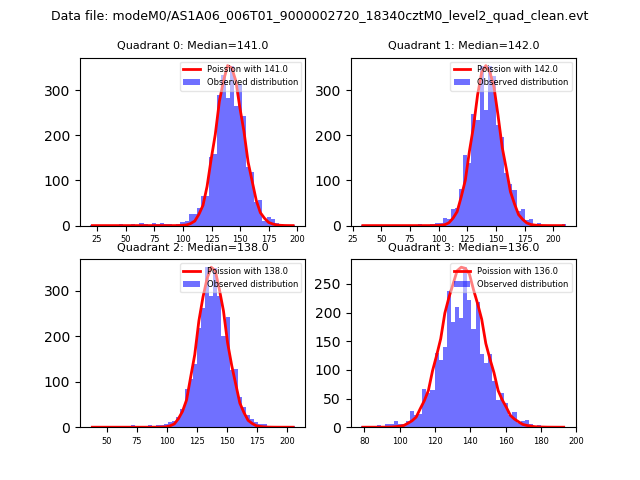
| Comparison with Poisson distribution Blue bars denote a histogram of data divided into 1 sec bins. Red curve is a Poisson curve with rate = median count rate of data. |
 |
 |
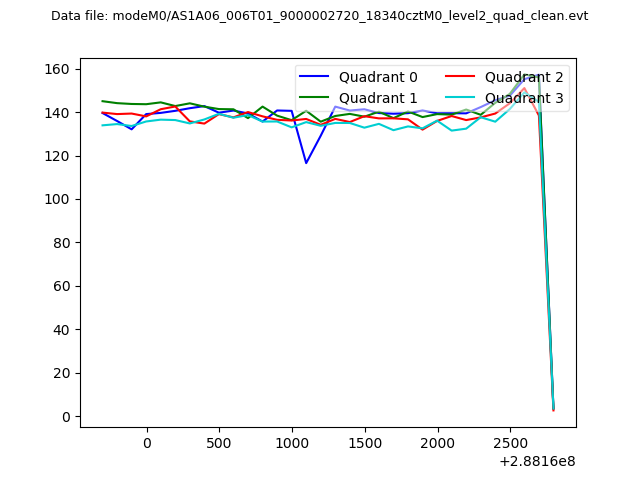
| Quadrant-wise count rates Data is divided into 100 sec bins |
 |
|
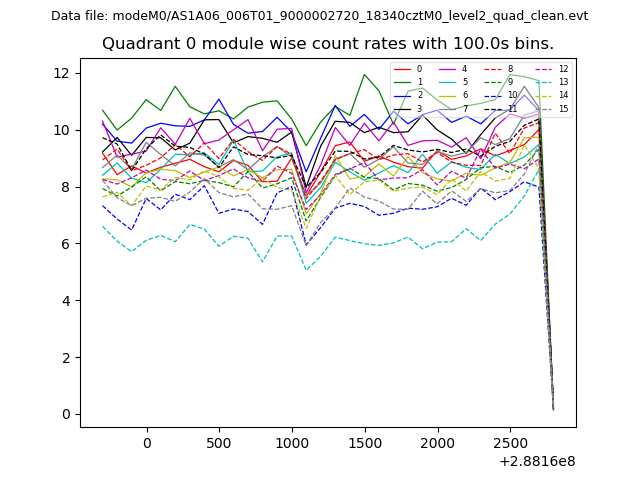
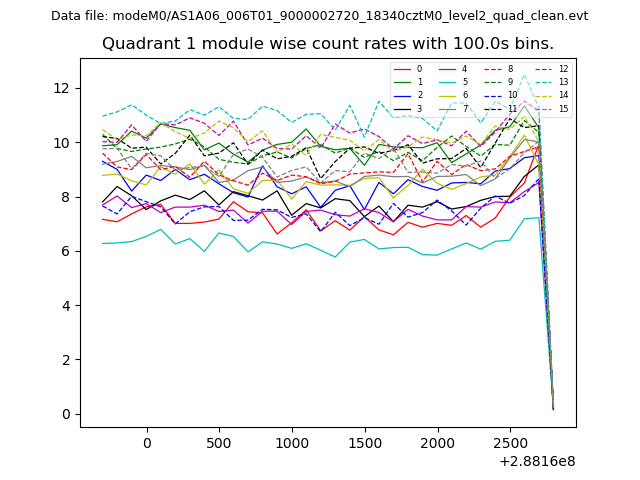
| Module-wise count rates for Quadrant A Data is divided into 100 sec bins |
 |
 |
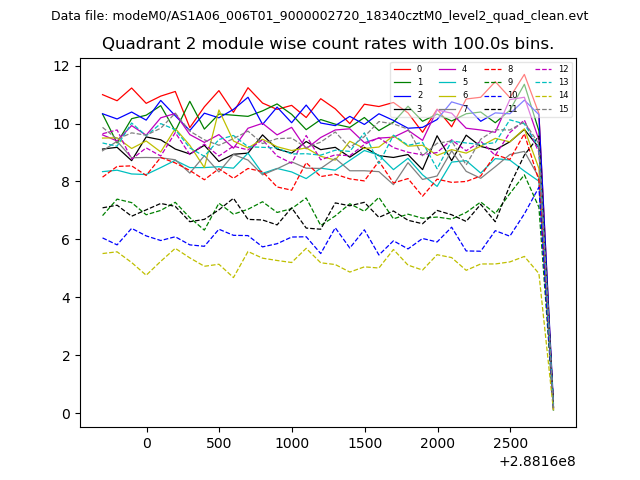
| Module-wise count rates for Quadrant B Data is divided into 100 sec bins |
 |
 |
| Module-wise count rates for Quadrant C Data is divided into 100 sec bins |
 |
 |
| Module-wise count rates for Quadrant D Data is divided into 100 sec bins |
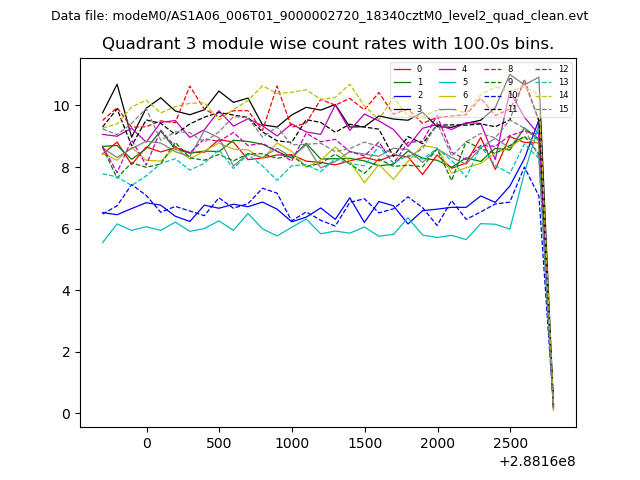 |
 |
| Parameter | Plot |
|---|---|
| CZT HV Monitor | 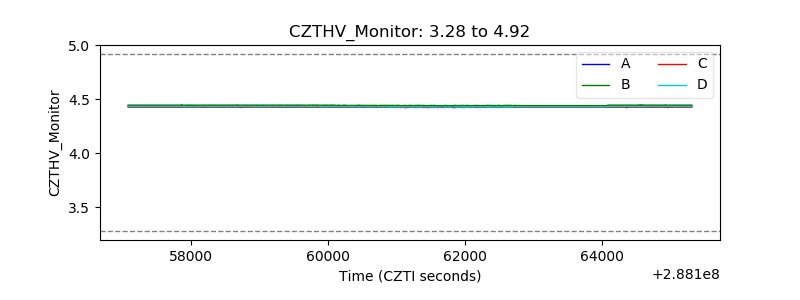 |
| D_VDD | 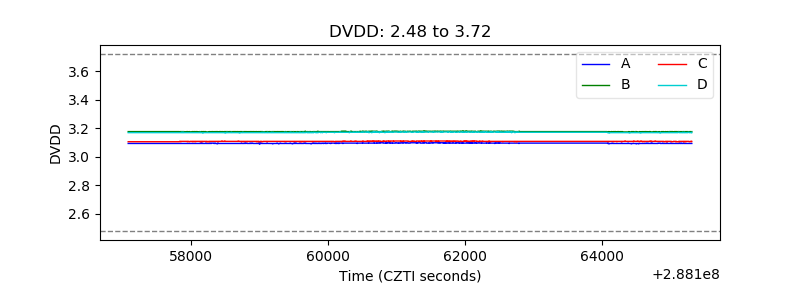 |
| Temperature 1 | 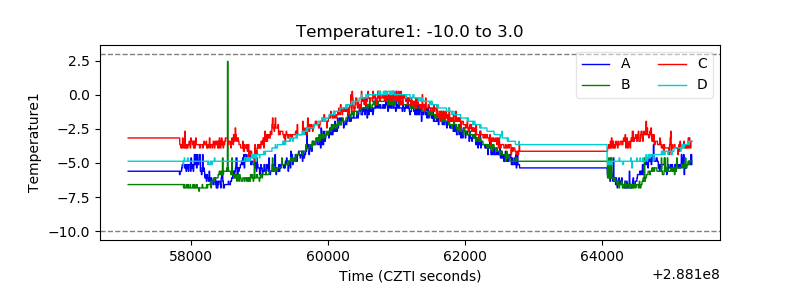 |
| Veto HV Monitor | 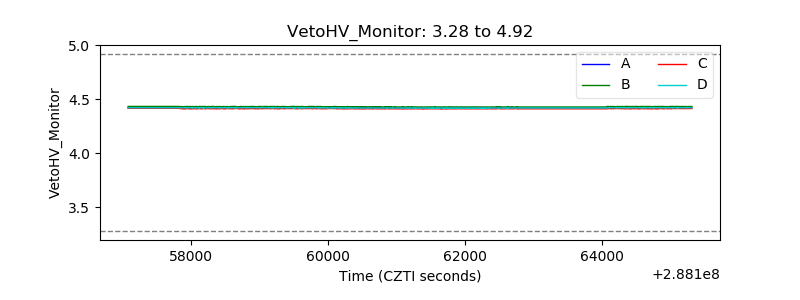 |
| Veto LLD | 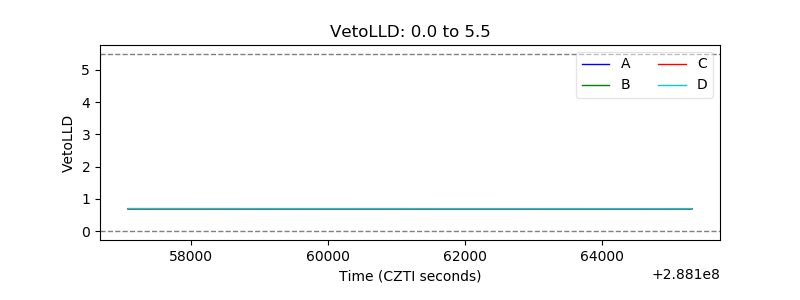 |
| Alpha Counter | 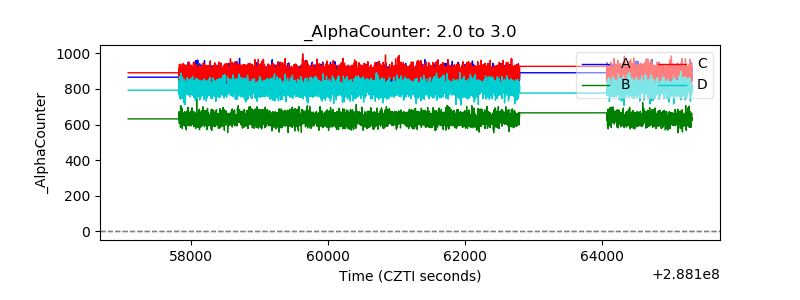 |
| _CPM_Rate | 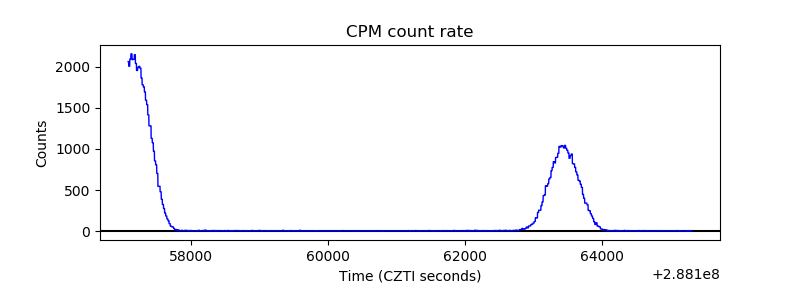 |
| CZT Counter | 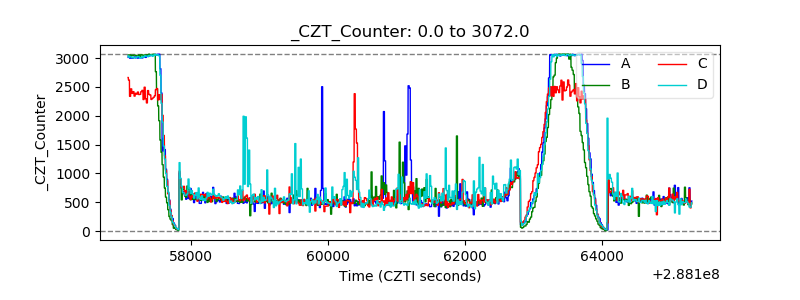 |
| +2.5 Volts monitor |  |
| +5 Volts monitor |  |
| _ROLL_ROT | 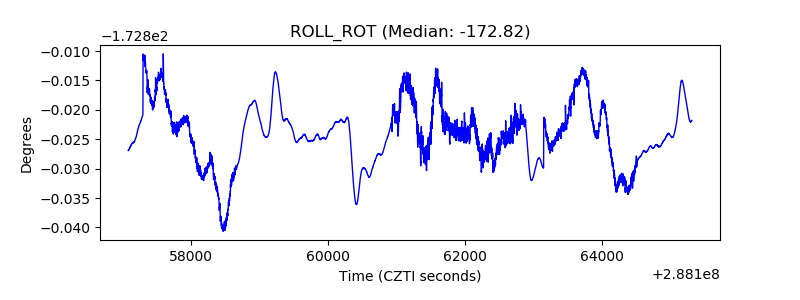 |
| _Roll_DEC | 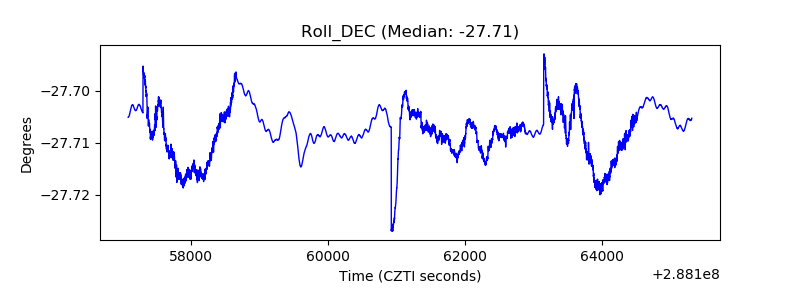 |
| _Roll_RA | 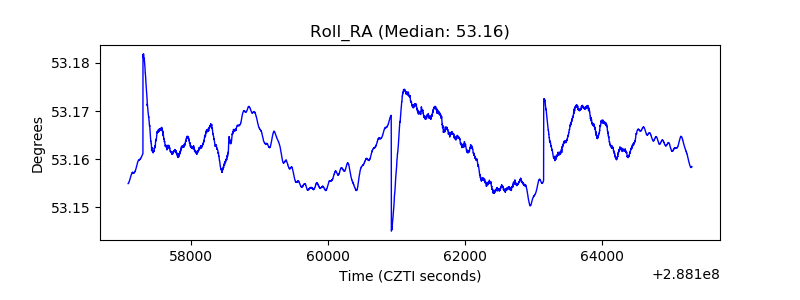 |
| Veto Counter | 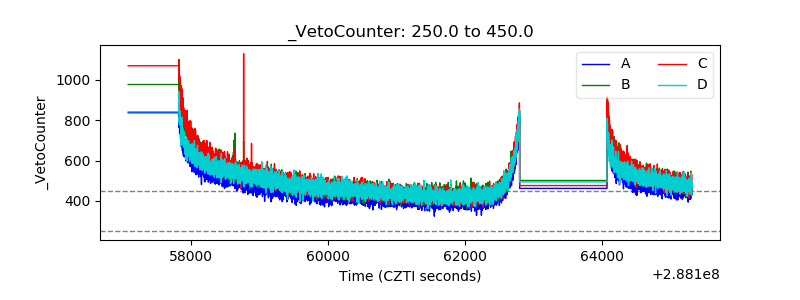 |