| Param | Original file | Final file |
|---|---|---|
| Filename | modeM0/AS1A06_006T01_9000002720_18341cztM0_level2.evt | modeM0/AS1A06_006T01_9000002720_18341cztM0_level2_quad_clean.evt |
| Size (bytes) | 480,991,680 | 84,525,120 |
| Size | 458.7 MB | 80.6 MB |
| Events in quadrant A | 3,337,214 | 533,269 |
| Events in quadrant B | 3,511,234 | 533,345 |
| Events in quadrant C | 3,381,628 | 526,556 |
| Events in quadrant D | 3,891,891 | 509,527 |
| Mode SS | |||
|---|---|---|---|
| Quadrant | BADHDUFLAG | Total packets | Discarded packets |
| A | 0 | 134 | 0 |
| B | 0 | 134 | 0 |
| C | 0 | 134 | 0 |
| D | 0 | 134 | 0 |
| Mode M9 | |||
|---|---|---|---|
| Quadrant | BADHDUFLAG | Total packets | Discarded packets |
| A | 0 | 15 | 0 |
| B | 0 | 16 | 0 |
| C | 0 | 16 | 0 |
| D | 0 | 16 | 0 |
| Mode M0 | |||
|---|---|---|---|
| Quadrant | BADHDUFLAG | Total packets | Discarded packets |
| A | 0 | 13768 | 2 |
| B | 0 | 14247 | 2 |
| C | 0 | 13925 | 2 |
| D | 0 | 15522 | 2 |
| Quadrant | Total seconds | Saturated seconds | Saturation percentage |
|---|---|---|---|
| A | 6547 | 99 | 1.512143% |
| B | 6547 | 144 | 2.199481% |
| C | 6547 | 129 | 1.970368% |
| D | 6547 | 165 | 2.520238% |
Noise dominated data is calculated using 1-second bins in cleaned event files. If a bin has >2000 counts, and if more than 50% of those come from <1% of pixels, then it is considered to be noise-dominated and hence unusable.
| Quadrant | # 1 sec bins | Bins with >0 counts | Bins with >2000 counts | High rate bins dominated by noise | Noise dominated (total time) | Noise dominated (detector-on time) | Marked lightcurve |
|---|---|---|---|---|---|---|---|
| A | 7622 | 6548 | 0 | 0 | 0.00% | 0.00% | 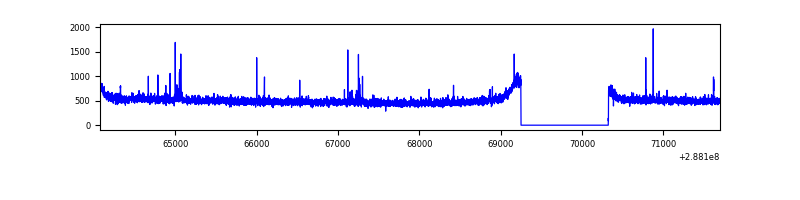 |
| B | 7622 | 6548 | 41 | 41 | 0.54% | 0.63% | 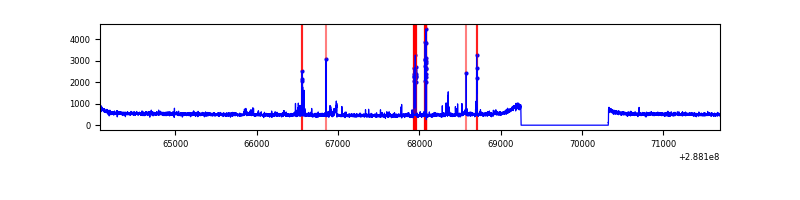 |
| C | 7622 | 6548 | 0 | 0 | 0.00% | 0.00% | 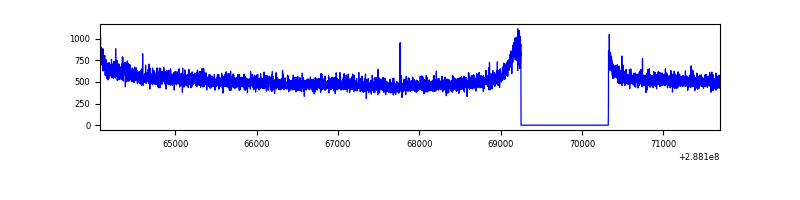 |
| D | 7622 | 6548 | 69 | 69 | 0.91% | 1.05% | 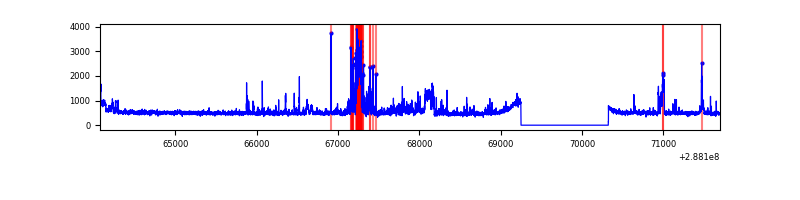 |
Top three noisy pixels from each quadrant. If the there are fewer than three noisy pixels in the level2.evt file, extra rows are filled as -1
| Pixel properties | Quadrant properties | ||||||
|---|---|---|---|---|---|---|---|
| Quadrant | DetID | PixID | Counts | Sigma | Mean | Median | Sigma |
| A | 4 | 2 | 27224 | 154.29 | 853 | 837 | 171.0 |
| A | 15 | 191 | 19521 | 109.25 | 853 | 837 | 171.0 |
| A | 15 | 174 | 15651 | 86.62 | 853 | 837 | 171.0 |
| B | 4 | 171 | 91677 | 564.02 | 848 | 830 | 161.1 |
| B | 7 | 220 | 40286 | 244.96 | 848 | 830 | 161.1 |
| B | 4 | 216 | 23563 | 141.14 | 848 | 830 | 161.1 |
| C | 14 | 238 | 125303 | 649.59 | 819 | 824 | 191.6 |
| C | 3 | 233 | 58601 | 301.51 | 819 | 824 | 191.6 |
| C | 13 | 61 | 5867 | 26.32 | 819 | 824 | 191.6 |
| D | 14 | 34 | 239134 | 1171.75 | 831 | 806 | 203.4 |
| D | 1 | 52 | 223156 | 1093.19 | 831 | 806 | 203.4 |
| D | 12 | 110 | 175434 | 858.56 | 831 | 806 | 203.4 |
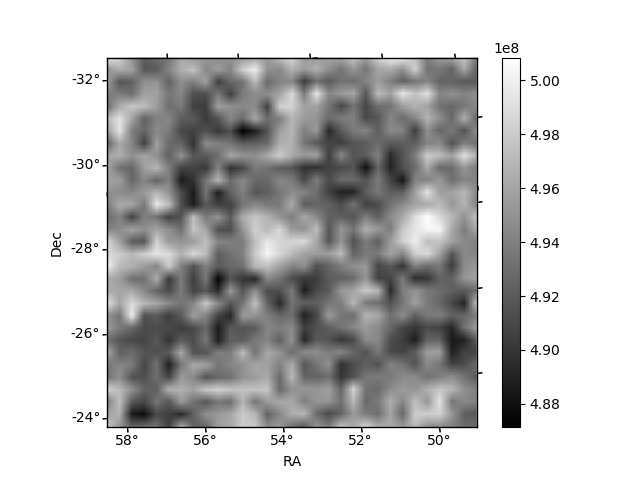
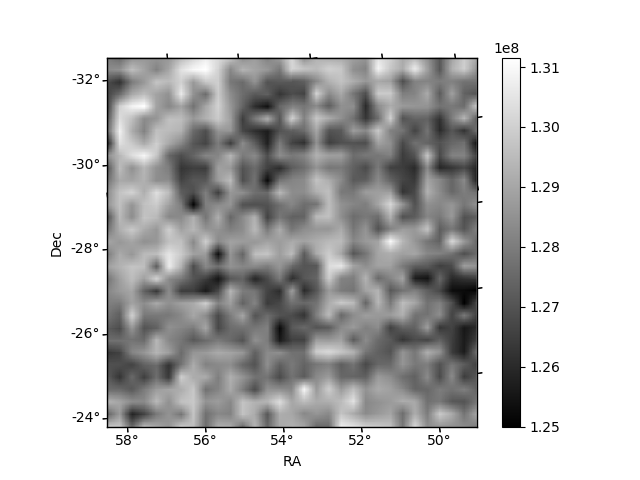
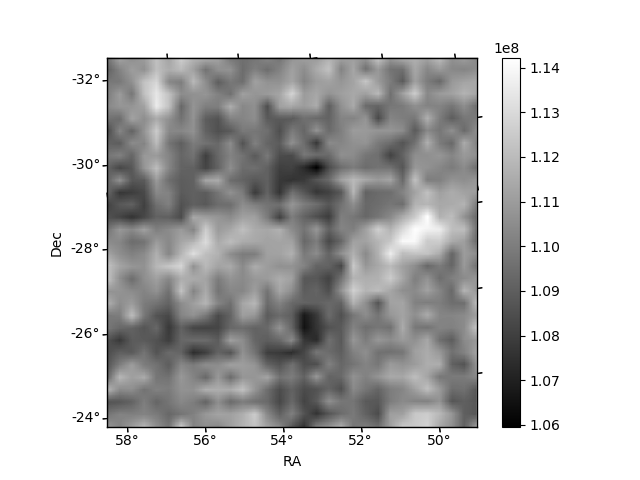
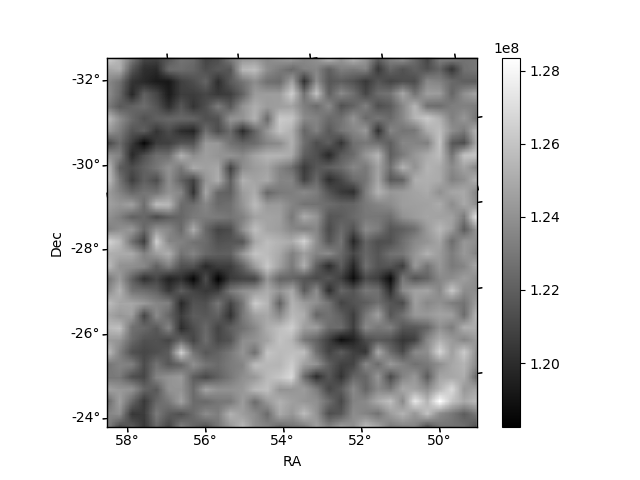
Histogram calculated using DETX and DETY for each event in the final _common_clean file
| Quadrant A | 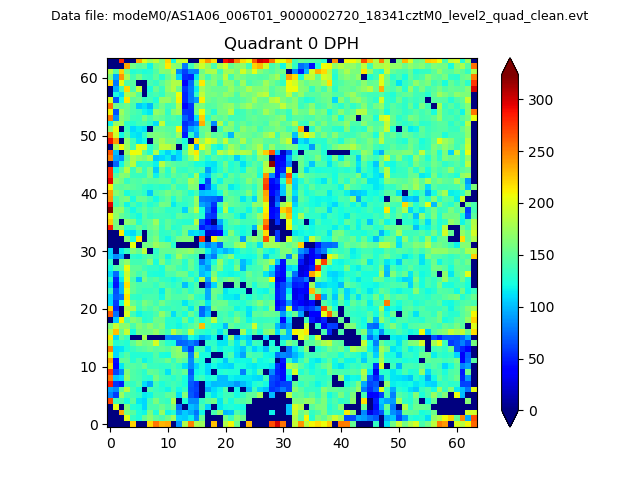 |
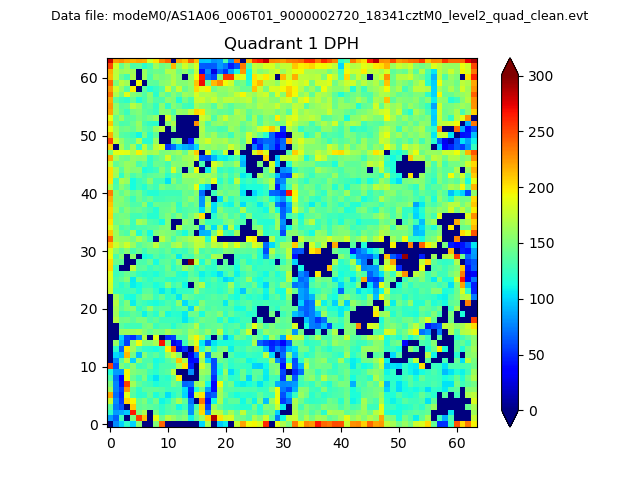 |
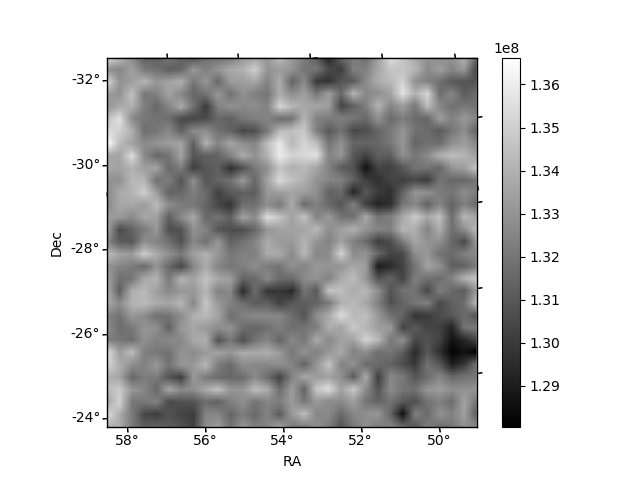
Quadrant B |
|---|---|---|---|
| Quadrant D | 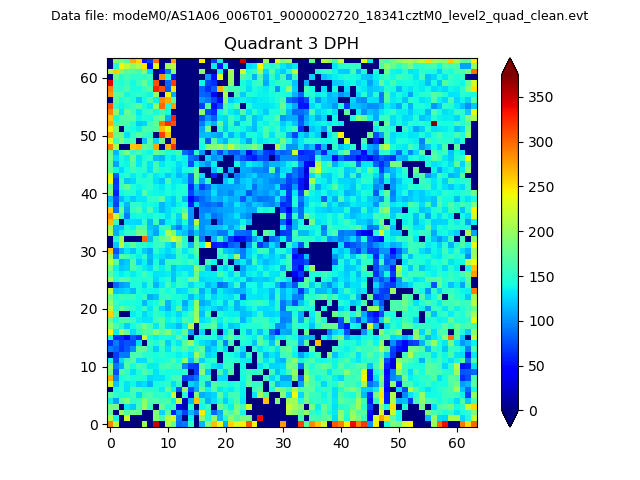 |
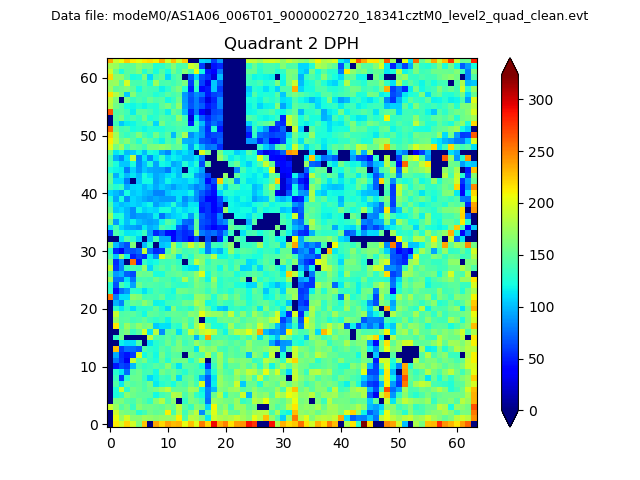 |
Quadrant C |
| Plot type | Count rate plots | Images |
|---|---|---|
| Comparison with Poisson distribution Blue bars denote a histogram of data divided into 1 sec bins. Red curve is a Poisson curve with rate = median count rate of data. |
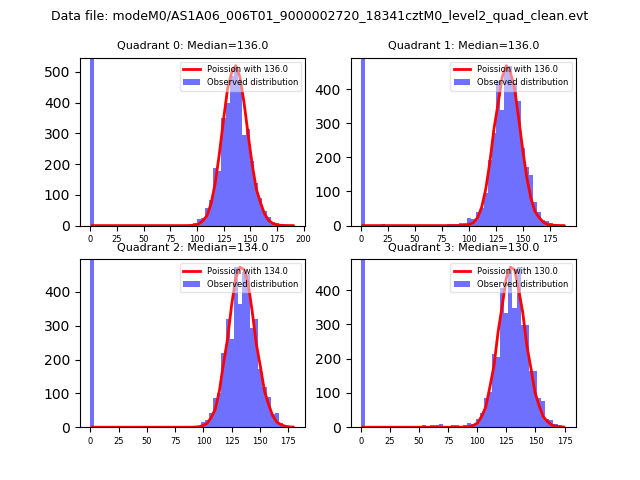 |
 |
| Quadrant-wise count rates Data is divided into 100 sec bins |
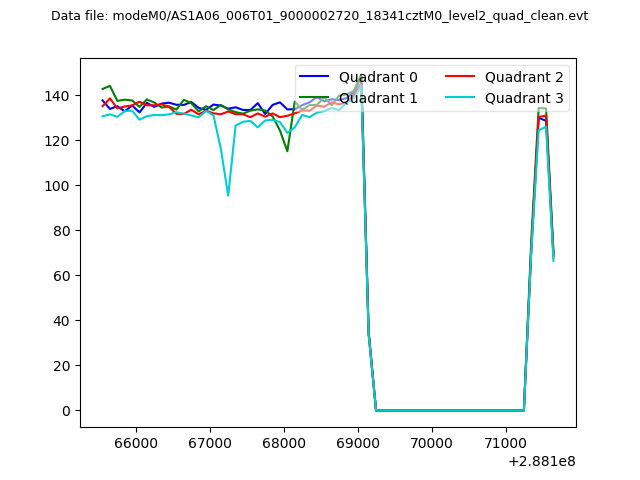 |
|
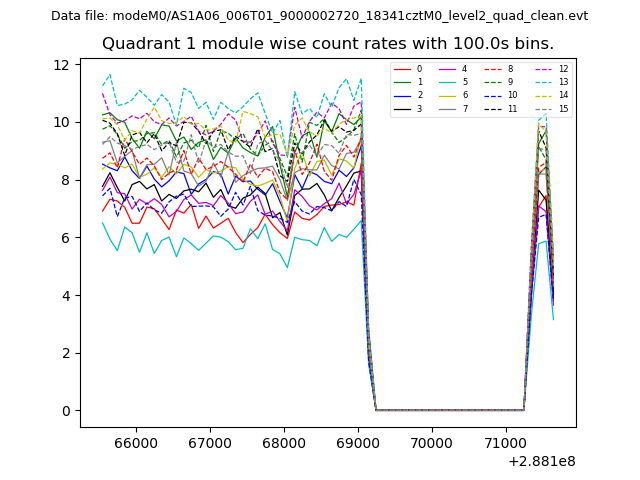
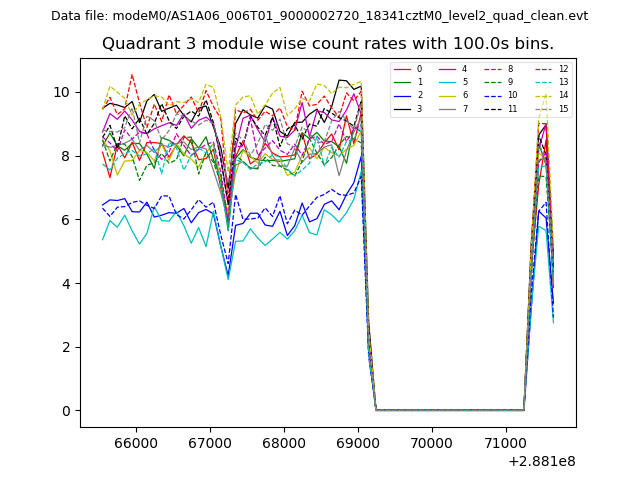
| Module-wise count rates for Quadrant A Data is divided into 100 sec bins |
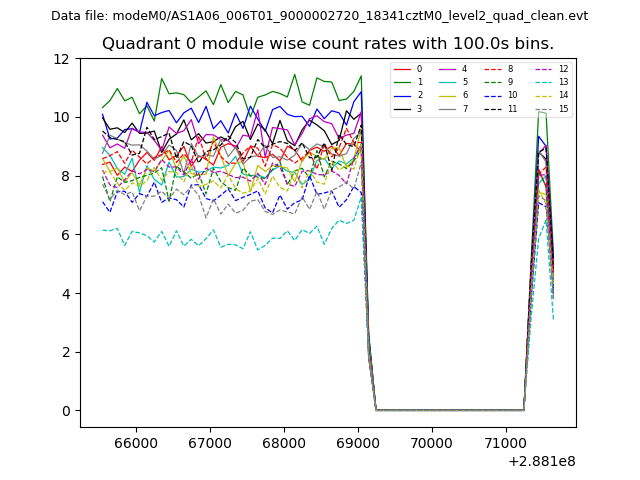 |
 |
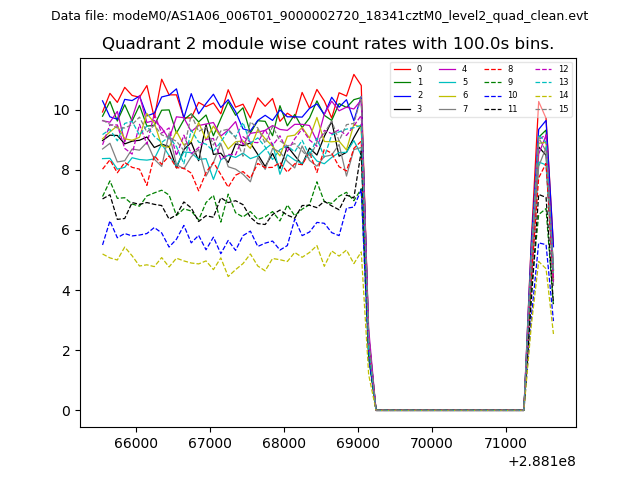
| Module-wise count rates for Quadrant B Data is divided into 100 sec bins |
 |
 |
| Module-wise count rates for Quadrant C Data is divided into 100 sec bins |
 |
 |
| Module-wise count rates for Quadrant D Data is divided into 100 sec bins |
 |
 |
| Parameter | Plot |
|---|---|
| CZT HV Monitor | 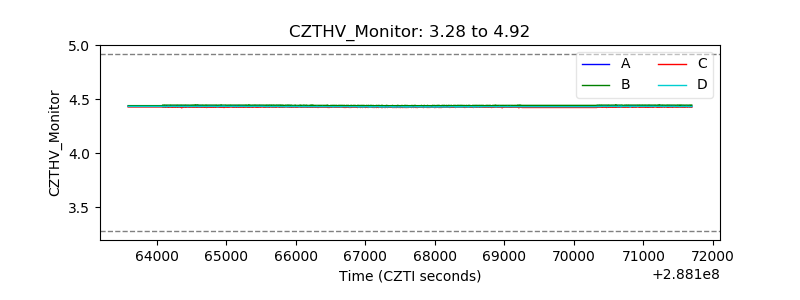 |
| D_VDD |  |
| Temperature 1 | 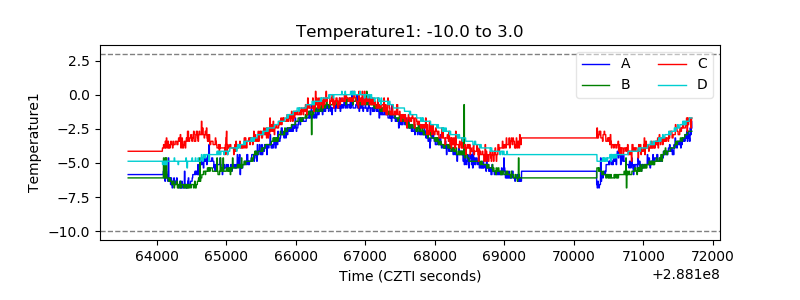 |
| Veto HV Monitor | 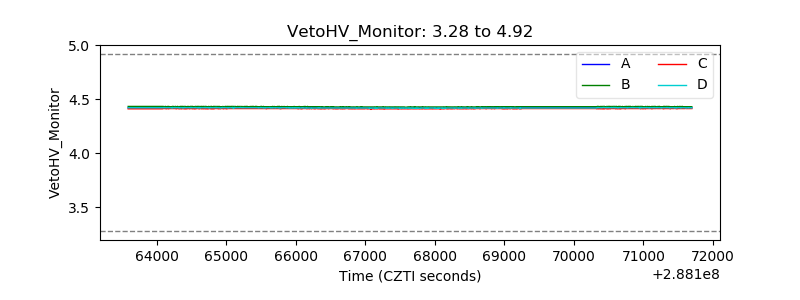 |
| Veto LLD | 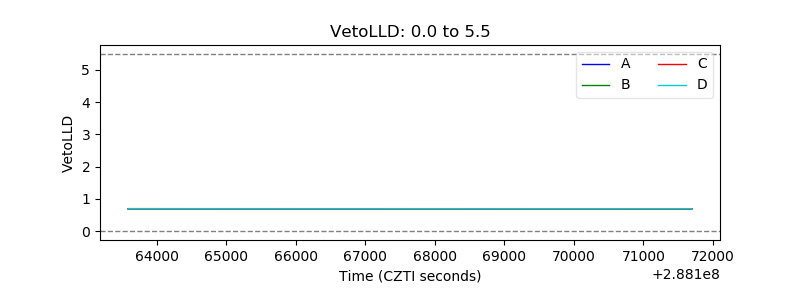 |
| Alpha Counter | 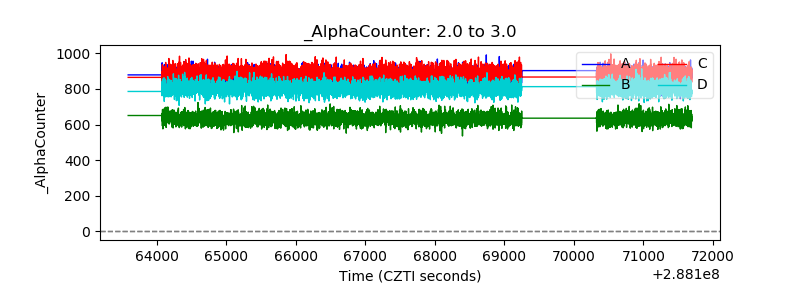 |
| _CPM_Rate | 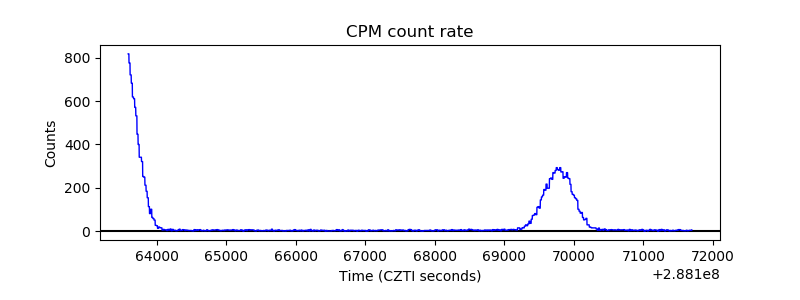 |
| CZT Counter | 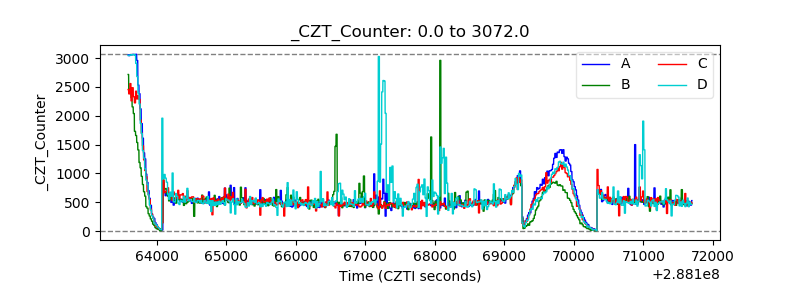 |
| +2.5 Volts monitor |  |
| +5 Volts monitor |  |
| _ROLL_ROT |  |
| _Roll_DEC | 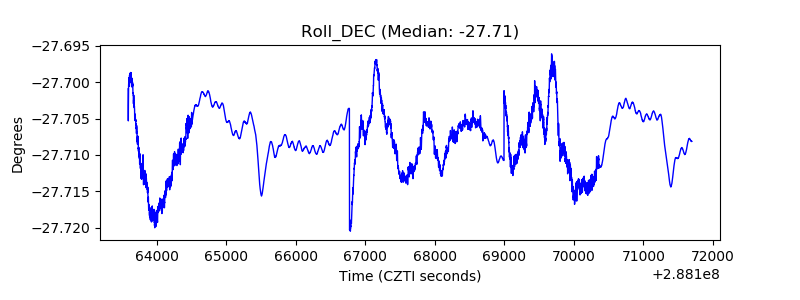 |
| _Roll_RA | 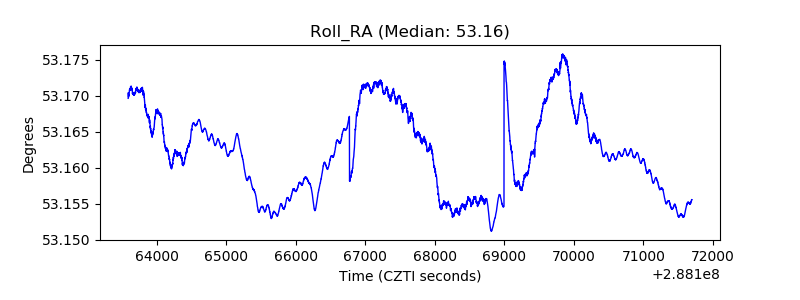 |
| Veto Counter |  |