| Param | Original file | Final file |
|---|---|---|
| Filename | modeM0/AS1A06_006T01_9000002720_18343cztM0_level2.evt | modeM0/AS1A06_006T01_9000002720_18343cztM0_level2_quad_clean.evt |
| Size (bytes) | 519,563,520 | 94,288,320 |
| Size | 495.5 MB | 89.9 MB |
| Events in quadrant A | 3,374,558 | 602,561 |
| Events in quadrant B | 3,746,777 | 602,680 |
| Events in quadrant C | 3,415,286 | 596,239 |
| Events in quadrant D | 4,726,467 | 569,869 |
| Mode SS | |||
|---|---|---|---|
| Quadrant | BADHDUFLAG | Total packets | Discarded packets |
| A | 0 | 140 | 0 |
| B | 0 | 140 | 0 |
| C | 0 | 140 | 0 |
| D | 0 | 140 | 0 |
| Mode M9 | |||
|---|---|---|---|
| Quadrant | BADHDUFLAG | Total packets | Discarded packets |
| A | 0 | 3 | 0 |
| B | 0 | 3 | 0 |
| C | 0 | 3 | 0 |
| D | 0 | 3 | 0 |
| Mode M0 | |||
|---|---|---|---|
| Quadrant | BADHDUFLAG | Total packets | Discarded packets |
| A | 0 | 14506 | 1 |
| B | 0 | 15393 | 1 |
| C | 0 | 14502 | 1 |
| D | 0 | 18646 | 1 |
| Quadrant | Total seconds | Saturated seconds | Saturation percentage |
|---|---|---|---|
| A | 6951 | 180 | 2.589555% |
| B | 6952 | 208 | 2.991945% |
| C | 6952 | 197 | 2.833717% |
| D | 6952 | 510 | 7.336018% |
Noise dominated data is calculated using 1-second bins in cleaned event files. If a bin has >2000 counts, and if more than 50% of those come from <1% of pixels, then it is considered to be noise-dominated and hence unusable.
| Quadrant | # 1 sec bins | Bins with >0 counts | Bins with >2000 counts | High rate bins dominated by noise | Noise dominated (total time) | Noise dominated (detector-on time) | Marked lightcurve |
|---|---|---|---|---|---|---|---|
| A | 7216 | 6952 | 16 | 16 | 0.22% | 0.23% | 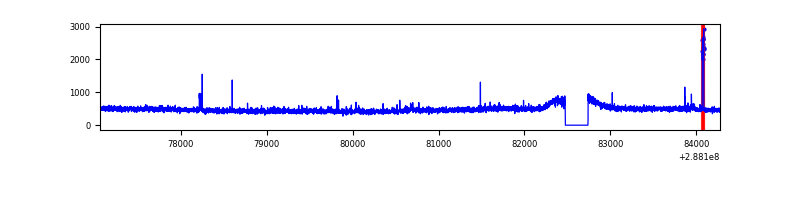 |
| B | 7217 | 6953 | 20 | 20 | 0.28% | 0.29% | 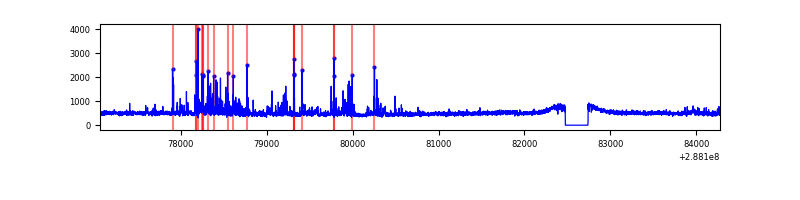 |
| C | 7217 | 6953 | 4 | 4 | 0.06% | 0.06% | 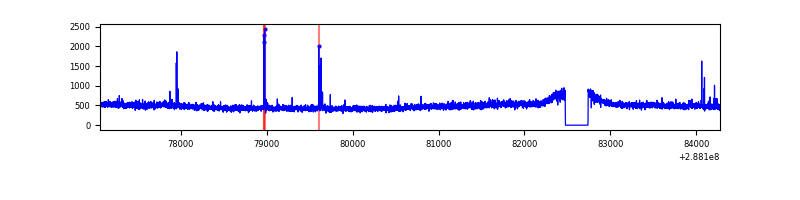 |
| D | 7217 | 6953 | 335 | 335 | 4.64% | 4.82% | 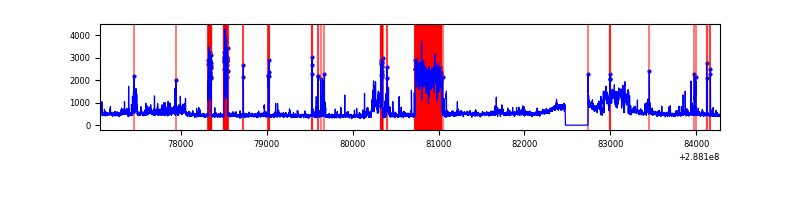 |
Top three noisy pixels from each quadrant. If the there are fewer than three noisy pixels in the level2.evt file, extra rows are filled as -1
| Pixel properties | Quadrant properties | ||||||
|---|---|---|---|---|---|---|---|
| Quadrant | DetID | PixID | Counts | Sigma | Mean | Median | Sigma |
| A | 15 | 174 | 63565 | 356.69 | 860 | 840 | 175.9 |
| A | 4 | 2 | 8036 | 40.92 | 860 | 840 | 175.9 |
| A | 0 | 226 | 7640 | 38.67 | 860 | 840 | 175.9 |
| B | 7 | 220 | 217513 | 1323.63 | 854 | 830 | 163.7 |
| B | 0 | 244 | 73725 | 445.29 | 854 | 830 | 163.7 |
| B | 0 | 229 | 24954 | 147.36 | 854 | 830 | 163.7 |
| C | 14 | 238 | 125737 | 644.95 | 824 | 829 | 193.7 |
| C | 0 | 207 | 39538 | 199.87 | 824 | 829 | 193.7 |
| C | 3 | 233 | 38788 | 196.0 | 824 | 829 | 193.7 |
| D | 1 | 52 | 1066107 | 5272.55 | 825 | 801 | 202.0 |
| D | 7 | 238 | 273944 | 1351.88 | 825 | 801 | 202.0 |
| D | 14 | 34 | 96850 | 475.38 | 825 | 801 | 202.0 |
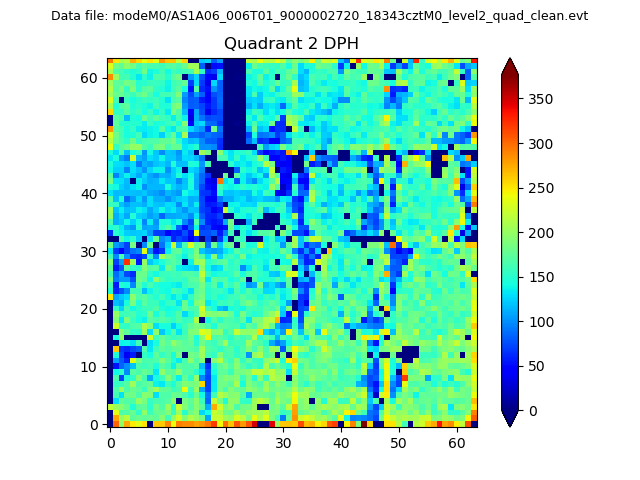
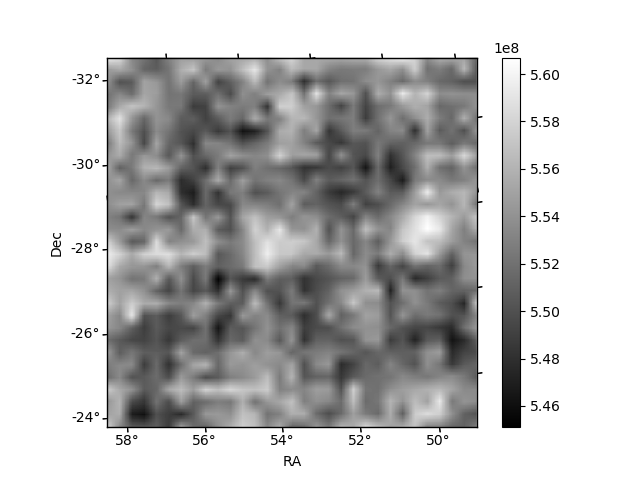
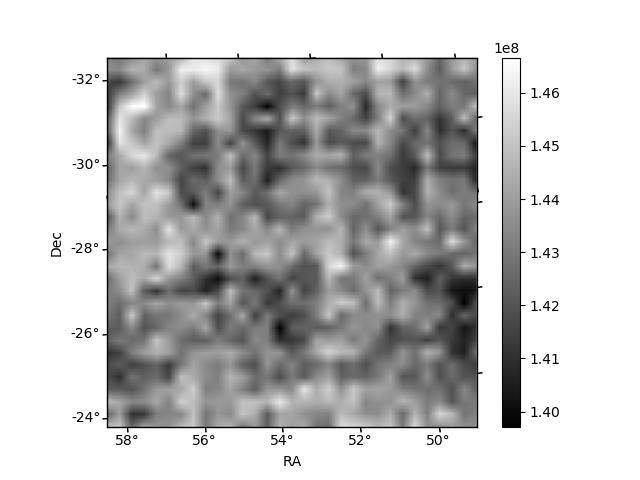
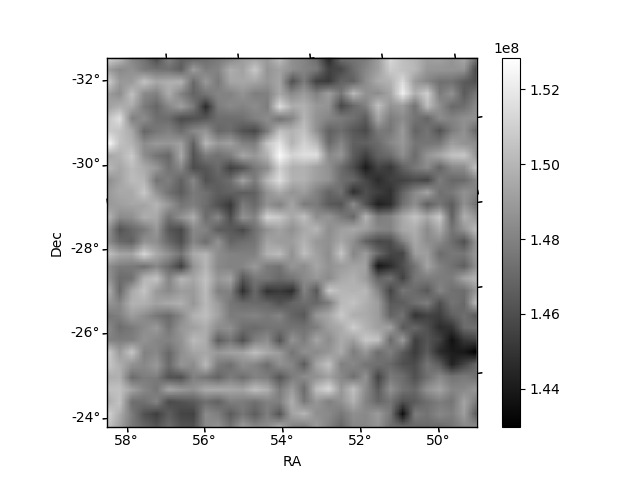
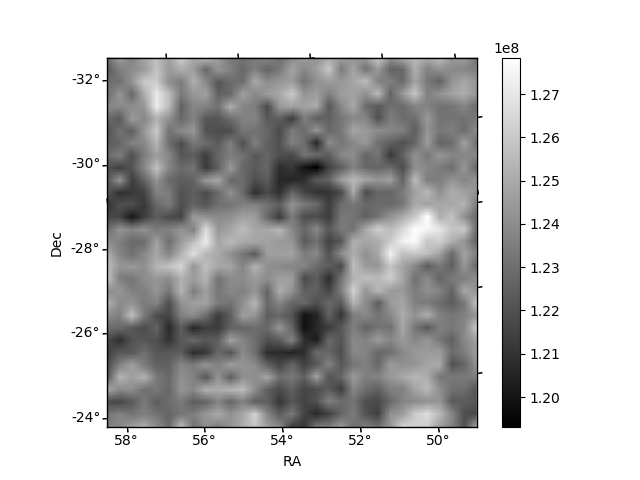
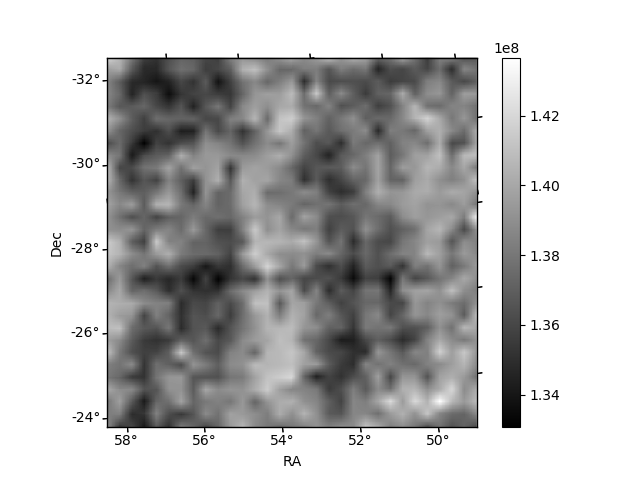
Histogram calculated using DETX and DETY for each event in the final _common_clean file
| Quadrant A | 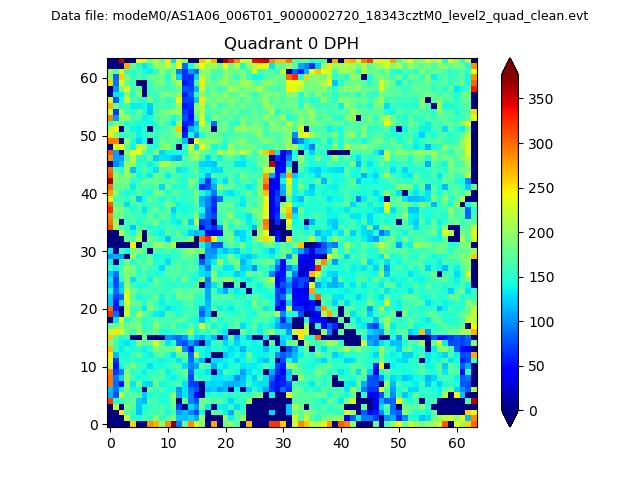 |
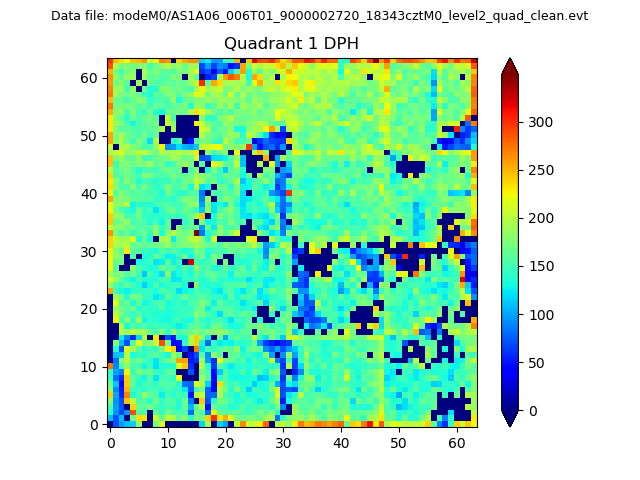 |
Quadrant B |
|---|---|---|---|
| Quadrant D | 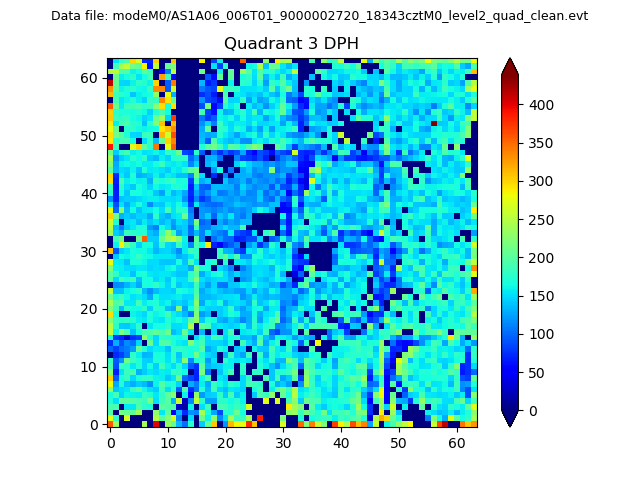 |
 |
Quadrant C |
| Plot type | Count rate plots | Images |
|---|---|---|
| Comparison with Poisson distribution Blue bars denote a histogram of data divided into 1 sec bins. Red curve is a Poisson curve with rate = median count rate of data. |
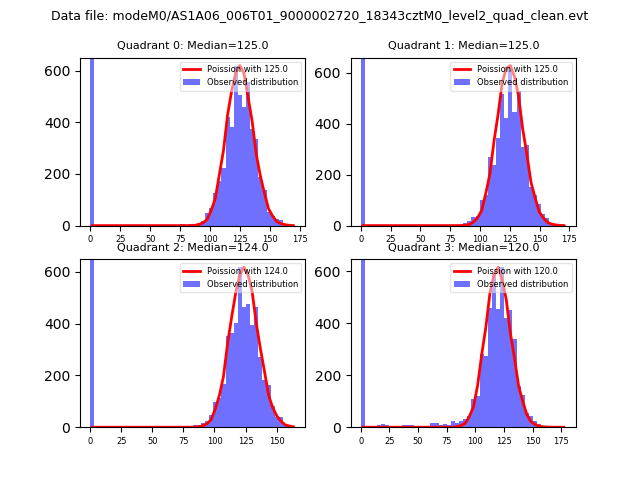 |
 |
| Quadrant-wise count rates Data is divided into 100 sec bins |
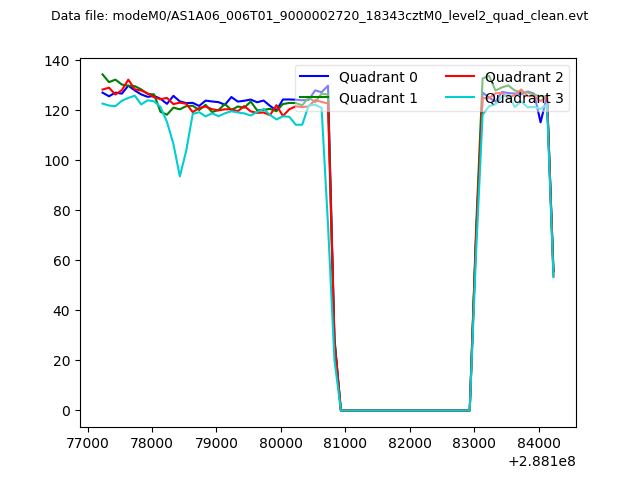 |
|
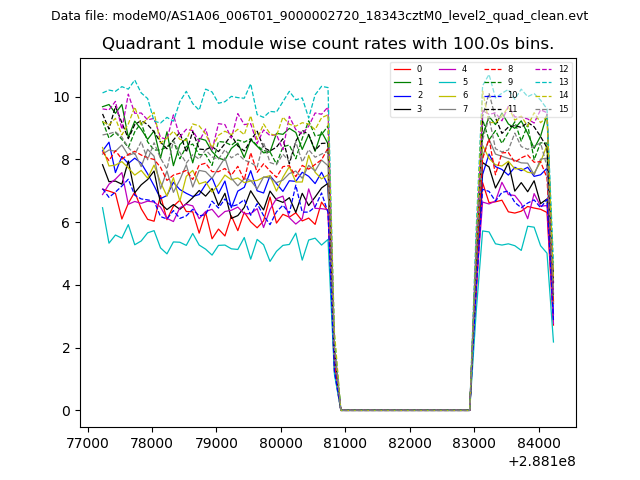
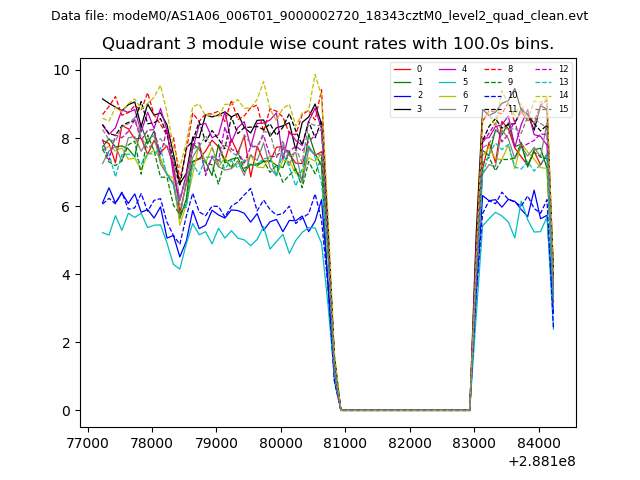
| Module-wise count rates for Quadrant A Data is divided into 100 sec bins |
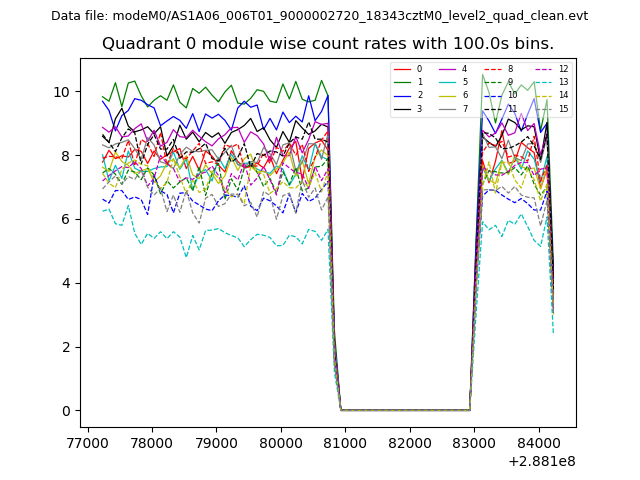 |
 |
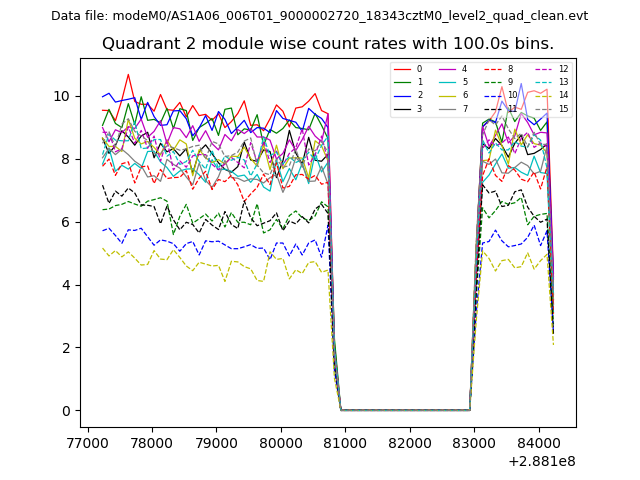
| Module-wise count rates for Quadrant B Data is divided into 100 sec bins |
 |
 |
| Module-wise count rates for Quadrant C Data is divided into 100 sec bins |
 |
 |
| Module-wise count rates for Quadrant D Data is divided into 100 sec bins |
 |
 |
| Parameter | Plot |
|---|---|
| CZT HV Monitor | 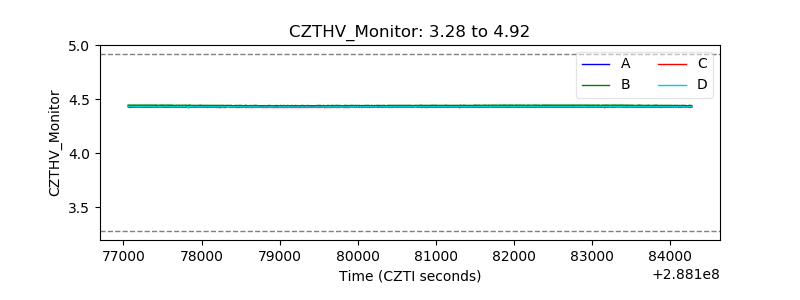 |
| D_VDD | 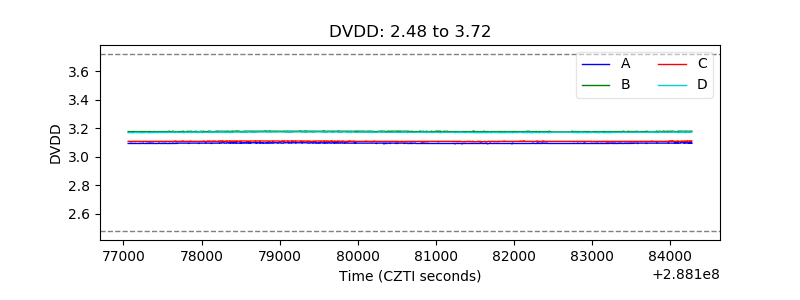 |
| Temperature 1 | 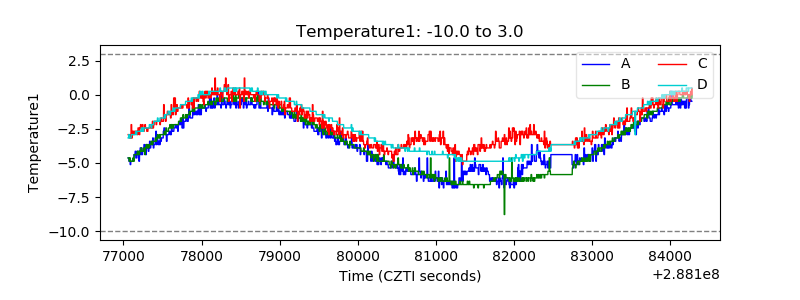 |
| Veto HV Monitor | 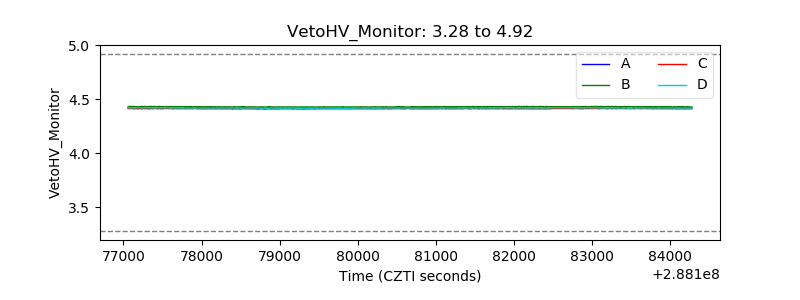 |
| Veto LLD | 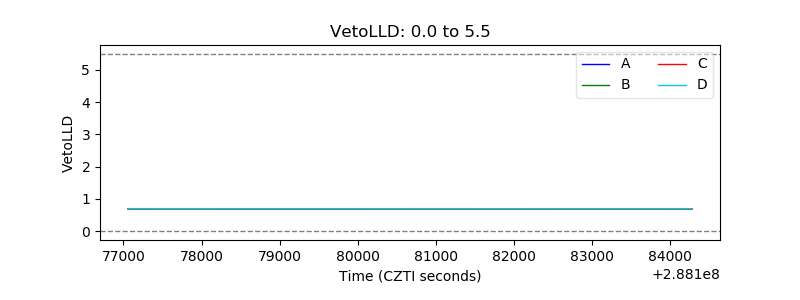 |
| Alpha Counter | 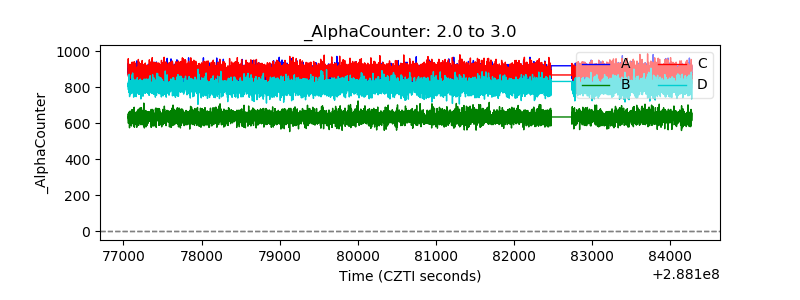 |
| _CPM_Rate | 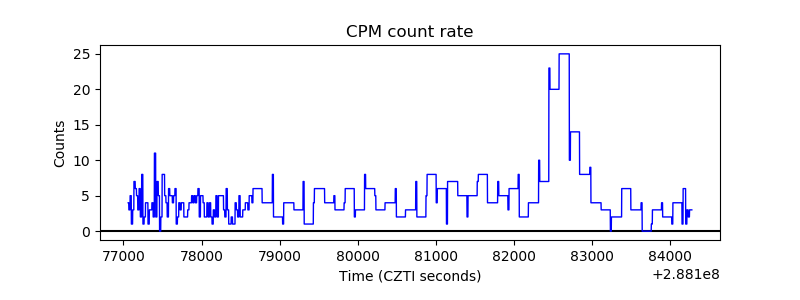 |
| CZT Counter | 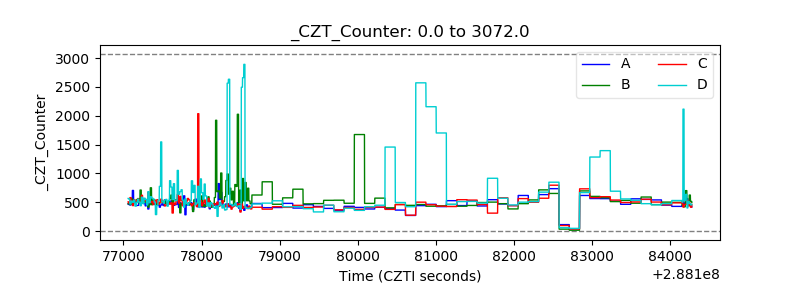 |
| +2.5 Volts monitor |  |
| +5 Volts monitor |  |
| _ROLL_ROT |  |
| _Roll_DEC |  |
| _Roll_RA | 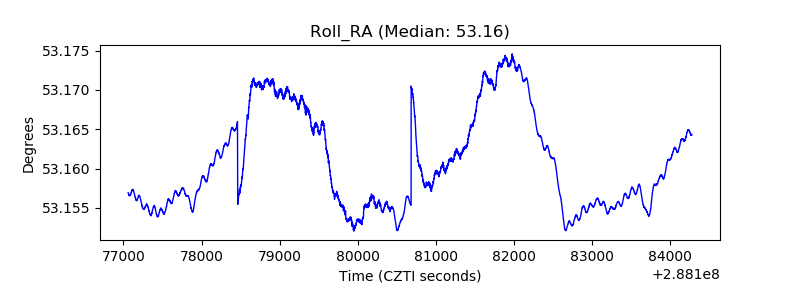 |
| Veto Counter |  |