| Param | Original file | Final file |
|---|---|---|
| Filename | modeM0/AS1A06_006T01_9000002720_18344cztM0_level2.evt | modeM0/AS1A06_006T01_9000002720_18344cztM0_level2_quad_clean.evt |
| Size (bytes) | 488,640,960 | 96,822,720 |
| Size | 466.0 MB | 92.3 MB |
| Events in quadrant A | 3,415,749 | 618,368 |
| Events in quadrant B | 3,610,387 | 619,537 |
| Events in quadrant C | 3,427,293 | 607,406 |
| Events in quadrant D | 3,866,751 | 596,831 |
| Mode SS | |||
|---|---|---|---|
| Quadrant | BADHDUFLAG | Total packets | Discarded packets |
| A | 0 | 140 | 0 |
| B | 0 | 140 | 0 |
| C | 0 | 140 | 0 |
| D | 0 | 140 | 0 |
| Mode M9 | |||
|---|---|---|---|
| Quadrant | BADHDUFLAG | Total packets | Discarded packets |
| A | 0 | 3 | 0 |
| B | 0 | 3 | 0 |
| C | 0 | 3 | 0 |
| D | 0 | 3 | 0 |
| Mode M0 | |||
|---|---|---|---|
| Quadrant | BADHDUFLAG | Total packets | Discarded packets |
| A | 0 | 14749 | 1 |
| B | 0 | 15135 | 1 |
| C | 0 | 14719 | 1 |
| D | 0 | 16126 | 1 |
| Quadrant | Total seconds | Saturated seconds | Saturation percentage |
|---|---|---|---|
| A | 7047 | 131 | 1.858947% |
| B | 7047 | 146 | 2.071804% |
| C | 7047 | 157 | 2.227898% |
| D | 7047 | 168 | 2.383993% |
Noise dominated data is calculated using 1-second bins in cleaned event files. If a bin has >2000 counts, and if more than 50% of those come from <1% of pixels, then it is considered to be noise-dominated and hence unusable.
| Quadrant | # 1 sec bins | Bins with >0 counts | Bins with >2000 counts | High rate bins dominated by noise | Noise dominated (total time) | Noise dominated (detector-on time) | Marked lightcurve |
|---|---|---|---|---|---|---|---|
| A | 7272 | 7048 | 16 | 16 | 0.22% | 0.23% | 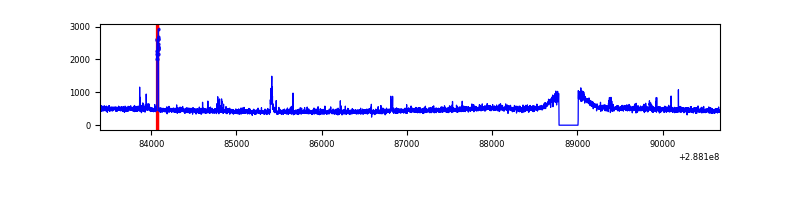 |
| B | 7272 | 7048 | 10 | 10 | 0.14% | 0.14% | 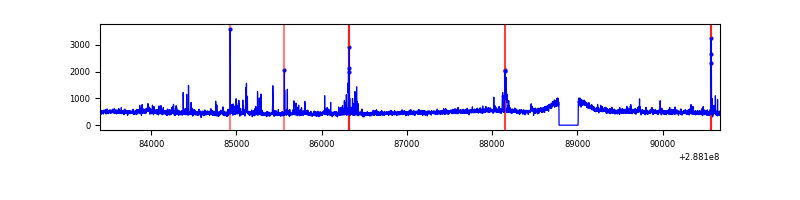 |
| C | 7272 | 7048 | 6 | 6 | 0.08% | 0.09% | 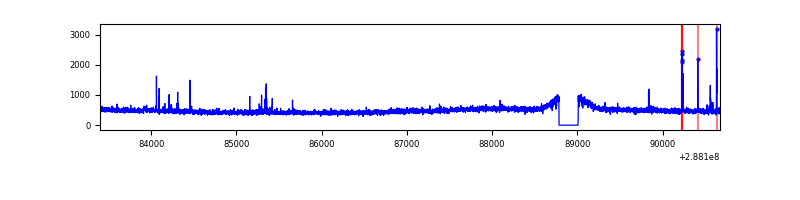 |
| D | 7272 | 7048 | 86 | 86 | 1.18% | 1.22% | 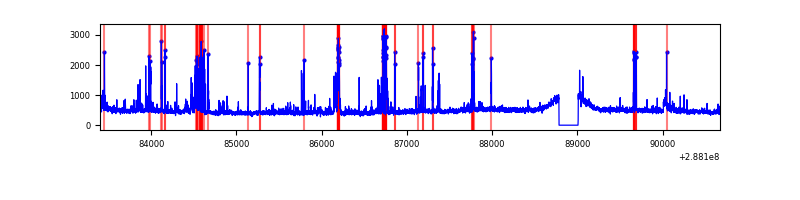 |
Top three noisy pixels from each quadrant. If the there are fewer than three noisy pixels in the level2.evt file, extra rows are filled as -1
| Pixel properties | Quadrant properties | ||||||
|---|---|---|---|---|---|---|---|
| Quadrant | DetID | PixID | Counts | Sigma | Mean | Median | Sigma |
| A | 15 | 174 | 65099 | 362.07 | 864 | 844 | 177.5 |
| A | 4 | 2 | 27171 | 148.35 | 864 | 844 | 177.5 |
| A | 0 | 226 | 7607 | 38.11 | 864 | 844 | 177.5 |
| B | 0 | 244 | 62664 | 372.29 | 863 | 842 | 166.1 |
| B | 3 | 64 | 46632 | 275.75 | 863 | 842 | 166.1 |
| B | 4 | 216 | 26645 | 155.39 | 863 | 842 | 166.1 |
| C | 14 | 238 | 125973 | 641.03 | 826 | 830 | 195.2 |
| C | 0 | 207 | 58783 | 296.86 | 826 | 830 | 195.2 |
| C | 3 | 233 | 24500 | 121.25 | 826 | 830 | 195.2 |
| D | 1 | 52 | 216600 | 1045.52 | 843 | 818 | 206.4 |
| D | 2 | 33 | 177432 | 855.74 | 843 | 818 | 206.4 |
| D | 12 | 110 | 82776 | 397.11 | 843 | 818 | 206.4 |
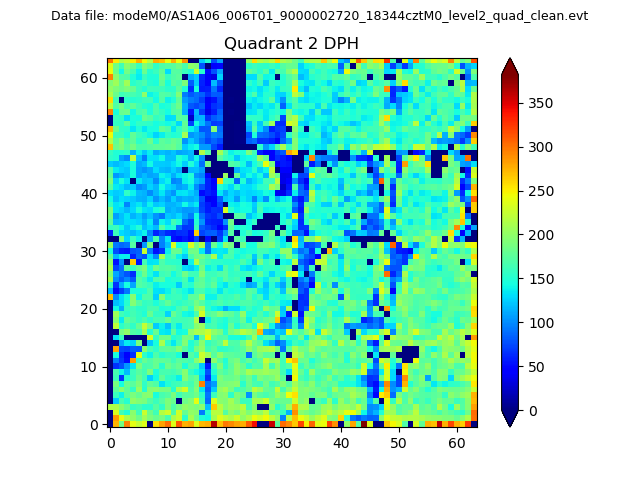
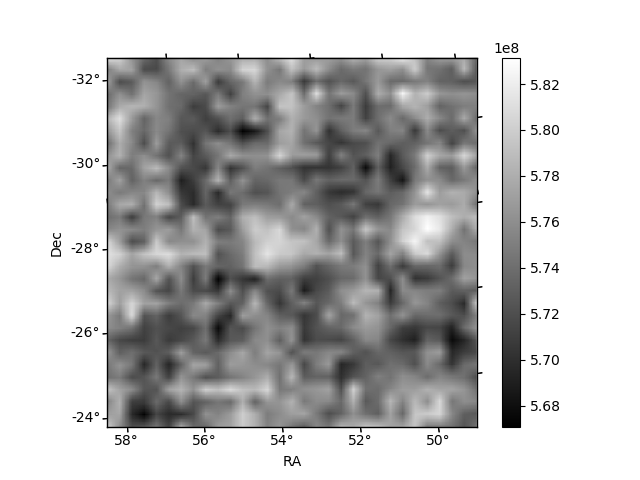
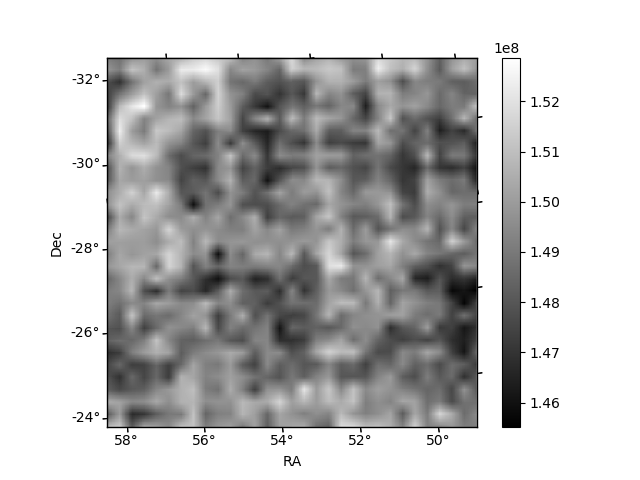
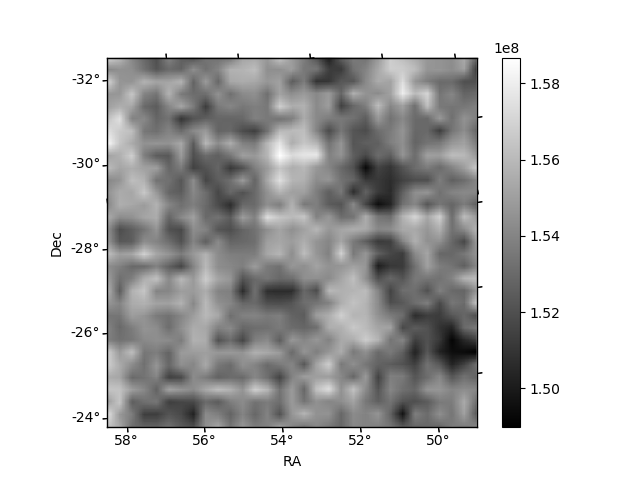
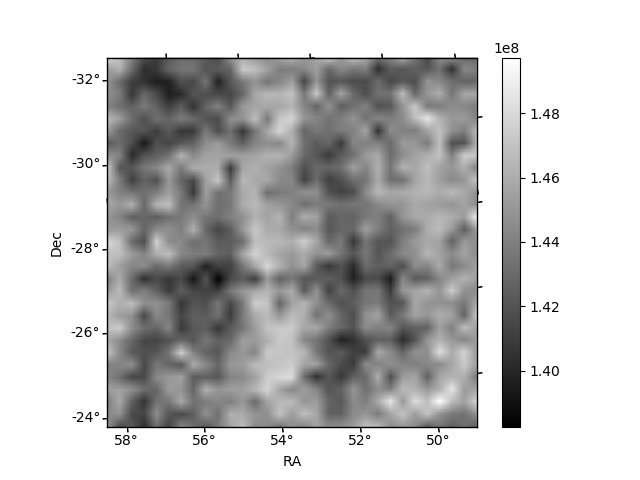
Histogram calculated using DETX and DETY for each event in the final _common_clean file
| Quadrant A | 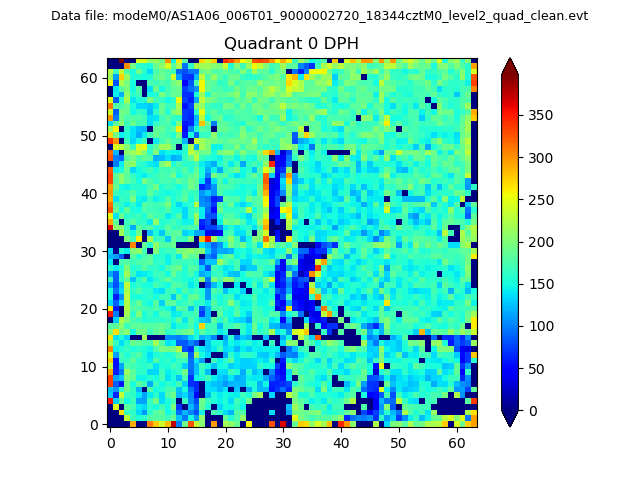 |
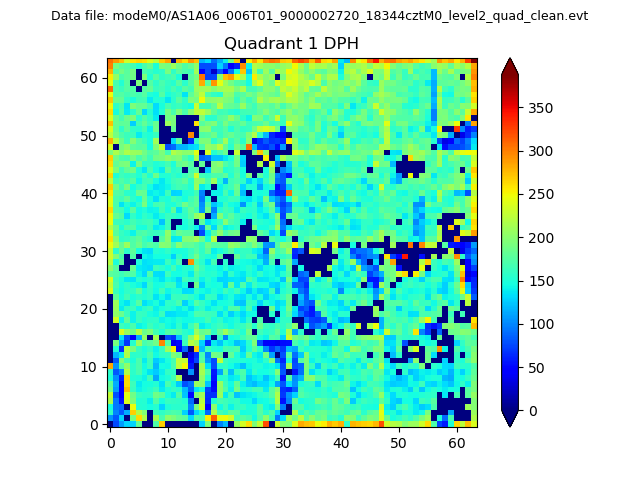 |
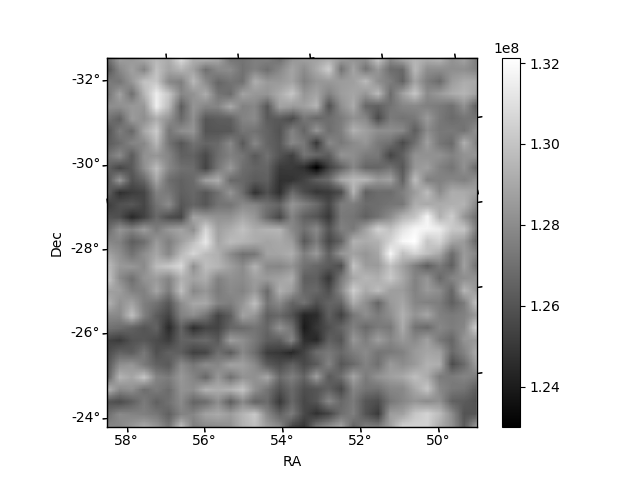
Quadrant B |
|---|---|---|---|
| Quadrant D | 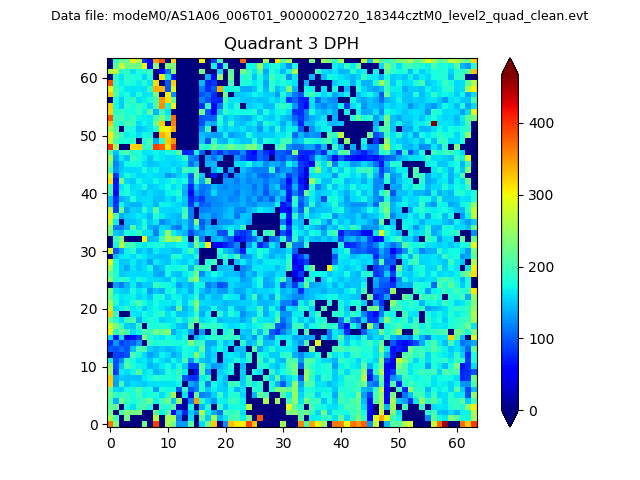 |
 |
Quadrant C |
| Plot type | Count rate plots | Images |
|---|---|---|
| Comparison with Poisson distribution Blue bars denote a histogram of data divided into 1 sec bins. Red curve is a Poisson curve with rate = median count rate of data. |
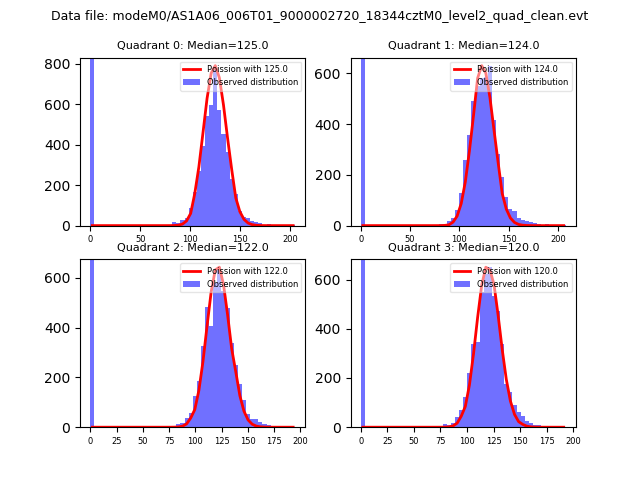 |
 |
| Quadrant-wise count rates Data is divided into 100 sec bins |
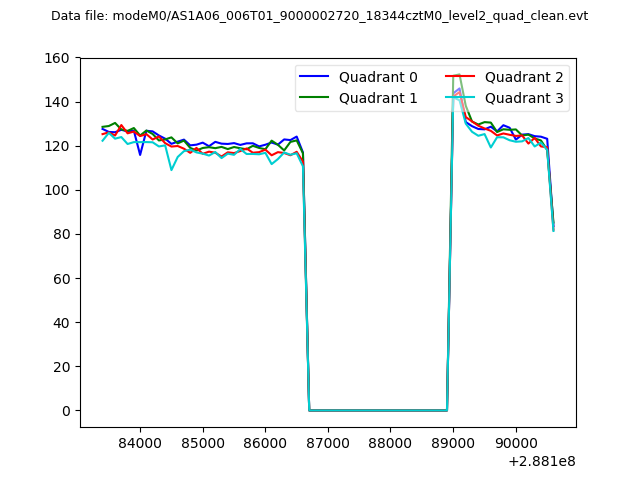 |
|
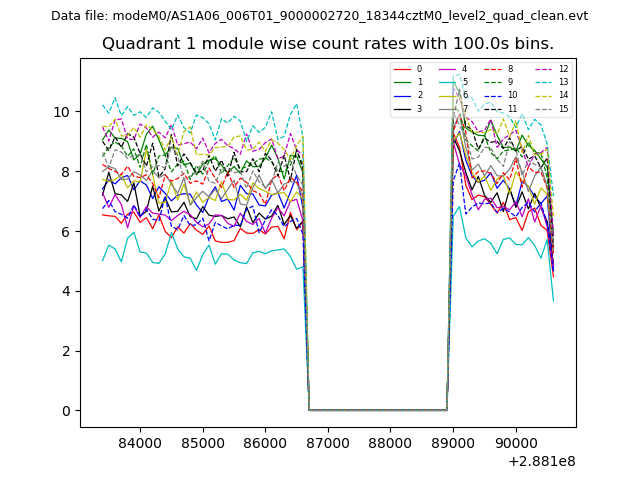
| Module-wise count rates for Quadrant A Data is divided into 100 sec bins |
 |
 |
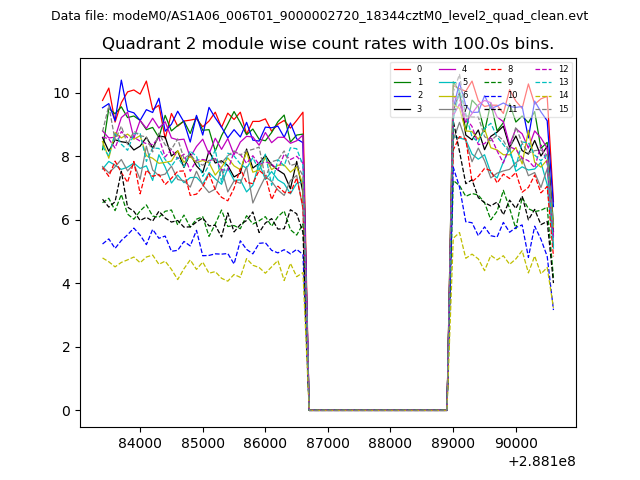
| Module-wise count rates for Quadrant B Data is divided into 100 sec bins |
 |
 |
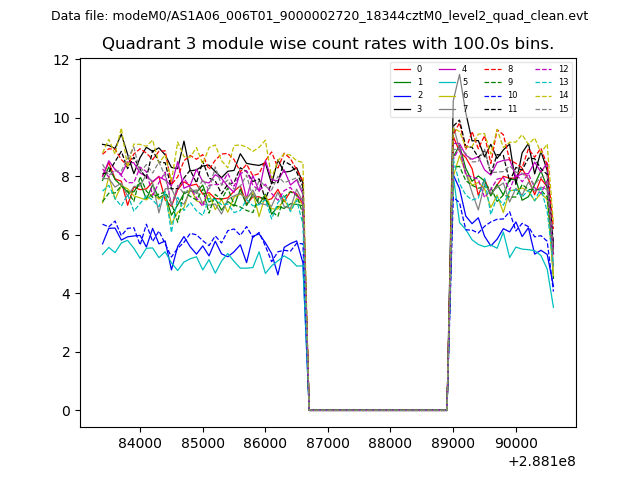
| Module-wise count rates for Quadrant C Data is divided into 100 sec bins |
 |
 |
| Module-wise count rates for Quadrant D Data is divided into 100 sec bins |
 |
 |
| Parameter | Plot |
|---|---|
| CZT HV Monitor | 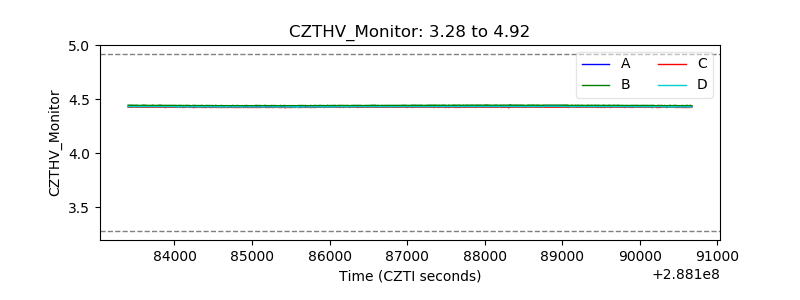 |
| D_VDD | 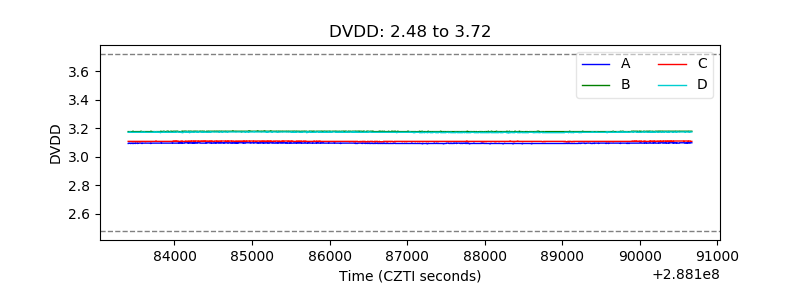 |
| Temperature 1 | 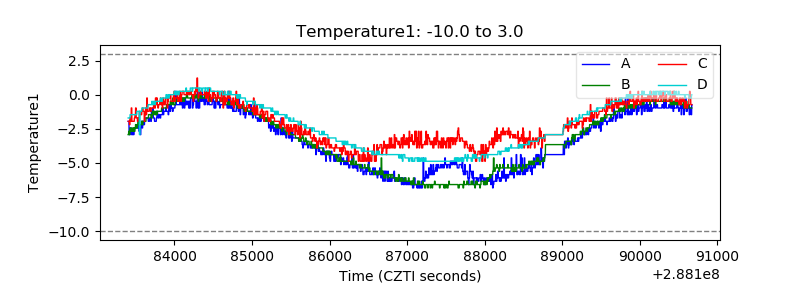 |
| Veto HV Monitor | 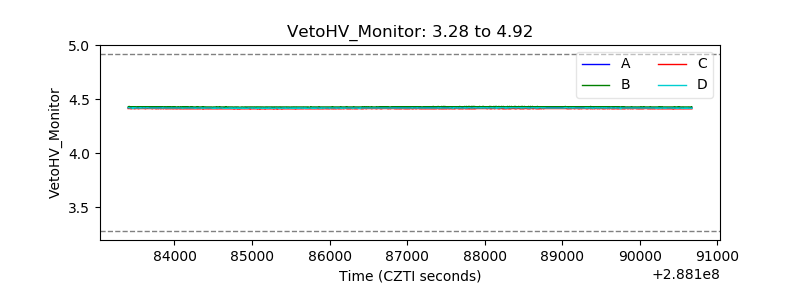 |
| Veto LLD | 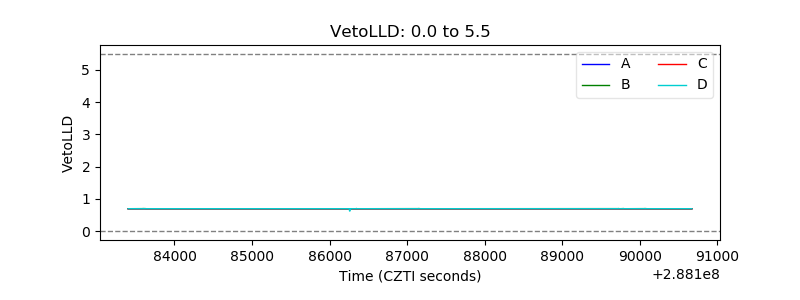 |
| Alpha Counter | 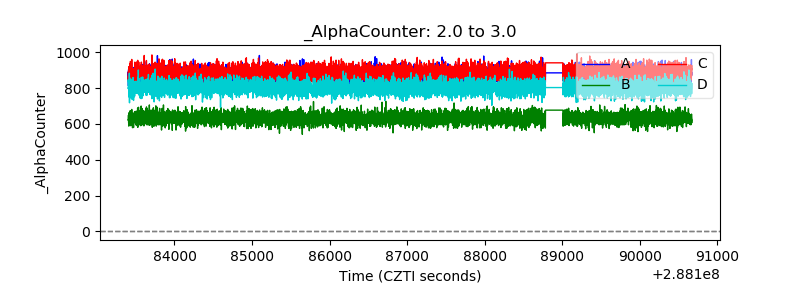 |
| _CPM_Rate | 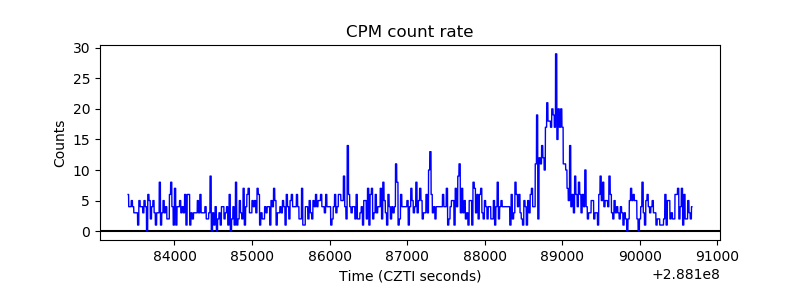 |
| CZT Counter | 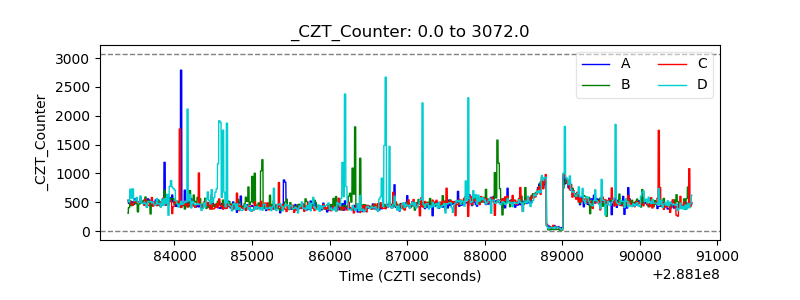 |
| +2.5 Volts monitor |  |
| +5 Volts monitor |  |
| _ROLL_ROT | 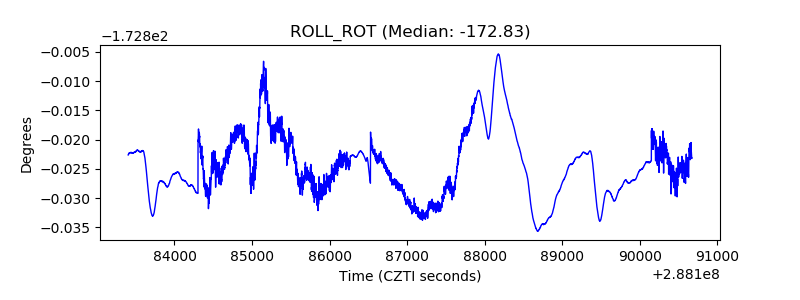 |
| _Roll_DEC | 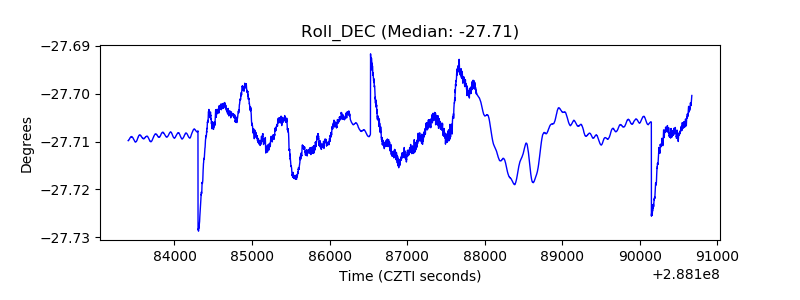 |
| _Roll_RA | 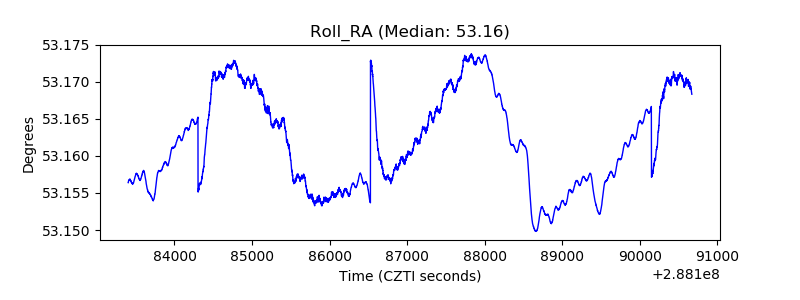 |
| Veto Counter | 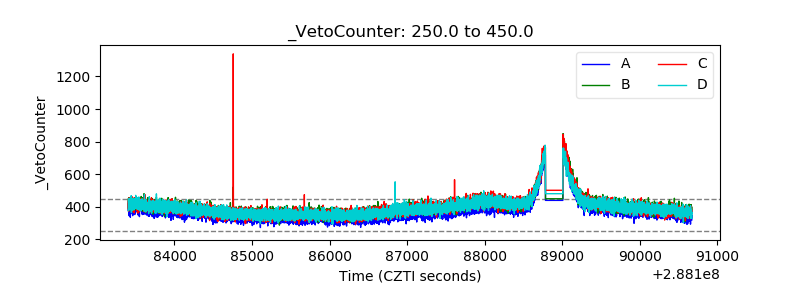 |