| Param | Original file | Final file |
|---|---|---|
| Filename | modeM0/AS1A06_006T01_9000002720_18347cztM0_level2.evt | modeM0/AS1A06_006T01_9000002720_18347cztM0_level2_quad_clean.evt |
| Size (bytes) | 1,258,894,080 | 221,829,120 |
| Size | 1.2 GB | 211.6 MB |
| Events in quadrant A | 8,421,066 | 1,397,476 |
| Events in quadrant B | 9,015,296 | 1,399,177 |
| Events in quadrant C | 8,513,004 | 1,365,633 |
| Events in quadrant D | 10,961,253 | 1,317,613 |
| Mode SS | |||
|---|---|---|---|
| Quadrant | BADHDUFLAG | Total packets | Discarded packets |
| A | 0 | 366 | 0 |
| B | 0 | 366 | 0 |
| C | 0 | 366 | 0 |
| D | 0 | 366 | 0 |
| Mode M9 | |||
|---|---|---|---|
| Quadrant | BADHDUFLAG | Total packets | Discarded packets |
| A | 0 | 17 | 0 |
| B | 0 | 17 | 0 |
| C | 0 | 17 | 0 |
| D | 0 | 17 | 0 |
| Mode M0 | |||
|---|---|---|---|
| Quadrant | BADHDUFLAG | Total packets | Discarded packets |
| A | 0 | 37043 | 3 |
| B | 0 | 38444 | 3 |
| C | 0 | 37140 | 3 |
| D | 0 | 45206 | 3 |
| Quadrant | Total seconds | Saturated seconds | Saturation percentage |
|---|---|---|---|
| A | 17964 | 104 | 0.578936% |
| B | 17965 | 174 | 0.968550% |
| C | 17965 | 172 | 0.957417% |
| D | 17965 | 1058 | 5.889229% |
Noise dominated data is calculated using 1-second bins in cleaned event files. If a bin has >2000 counts, and if more than 50% of those come from <1% of pixels, then it is considered to be noise-dominated and hence unusable.
| Quadrant | # 1 sec bins | Bins with >0 counts | Bins with >2000 counts | High rate bins dominated by noise | Noise dominated (total time) | Noise dominated (detector-on time) | Marked lightcurve |
|---|---|---|---|---|---|---|---|
| A | 19724 | 17967 | 6 | 6 | 0.03% | 0.03% | 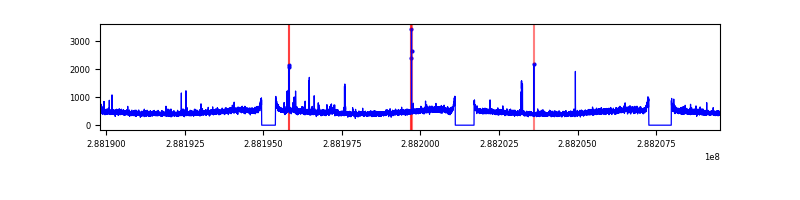 |
| B | 19725 | 17968 | 28 | 28 | 0.14% | 0.16% | 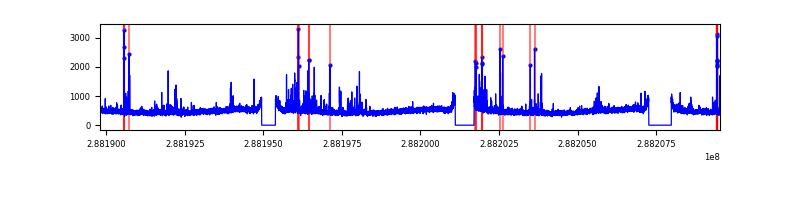 |
| C | 19725 | 17968 | 10 | 10 | 0.05% | 0.06% | 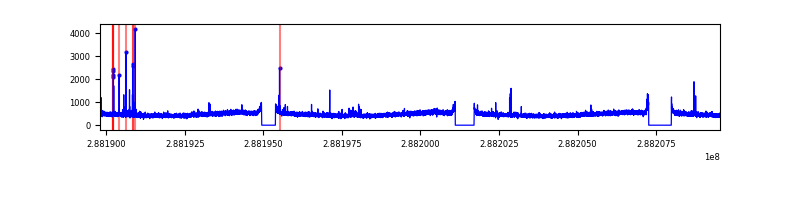 |
| D | 19725 | 17968 | 636 | 636 | 3.22% | 3.54% | 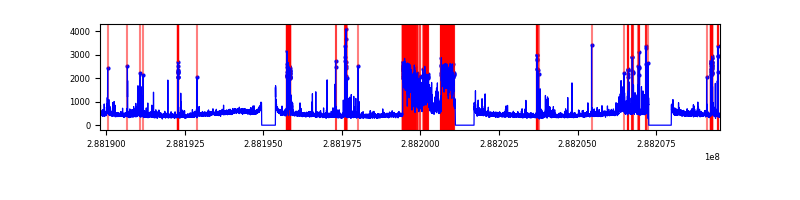 |
Top three noisy pixels from each quadrant. If the there are fewer than three noisy pixels in the level2.evt file, extra rows are filled as -1
| Pixel properties | Quadrant properties | ||||||
|---|---|---|---|---|---|---|---|
| Quadrant | DetID | PixID | Counts | Sigma | Mean | Median | Sigma |
| A | 15 | 174 | 116754 | 263.36 | 2147 | 2097 | 435.4 |
| A | 4 | 2 | 37200 | 80.63 | 2147 | 2097 | 435.4 |
| A | 0 | 226 | 19019 | 38.87 | 2147 | 2097 | 435.4 |
| B | 7 | 220 | 272128 | 654.24 | 2151 | 2099 | 412.7 |
| B | 4 | 216 | 69430 | 163.13 | 2151 | 2099 | 412.7 |
| B | 0 | 197 | 66392 | 155.77 | 2151 | 2099 | 412.7 |
| C | 14 | 238 | 312197 | 642.72 | 2055 | 2066 | 482.5 |
| C | 0 | 207 | 93775 | 190.06 | 2055 | 2066 | 482.5 |
| C | 3 | 233 | 80424 | 162.39 | 2055 | 2066 | 482.5 |
| D | 1 | 52 | 2395282 | 4807.37 | 2048 | 1990 | 497.8 |
| D | 7 | 238 | 211952 | 421.75 | 2048 | 1990 | 497.8 |
| D | 14 | 34 | 134218 | 265.6 | 2048 | 1990 | 497.8 |
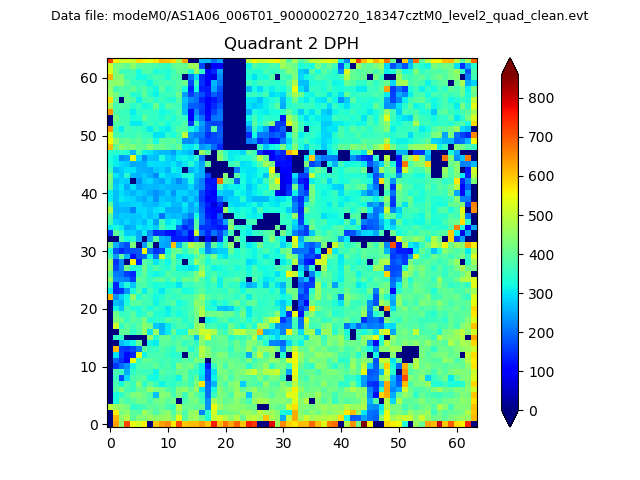
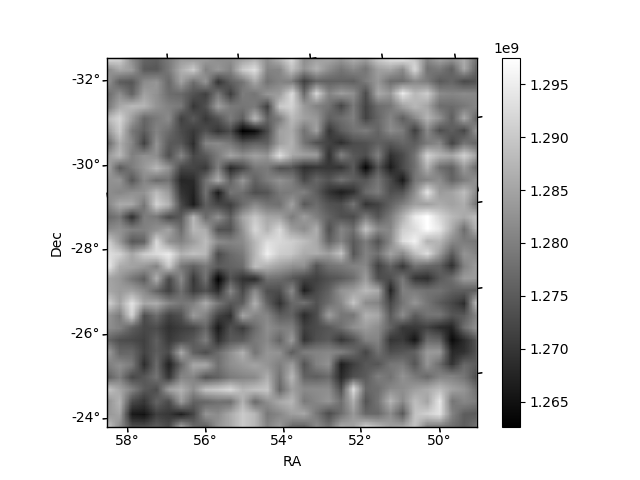
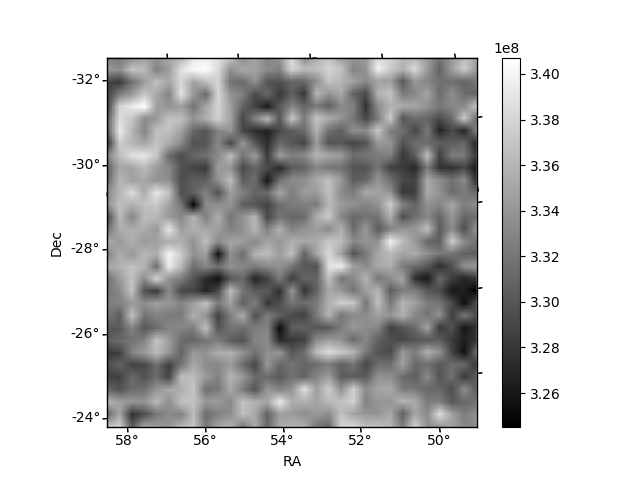
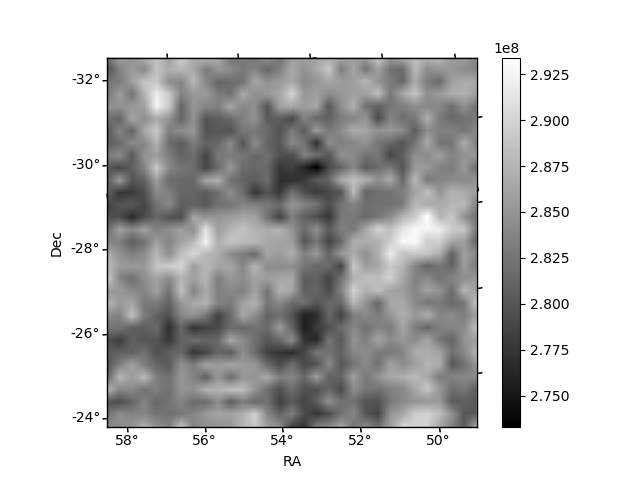
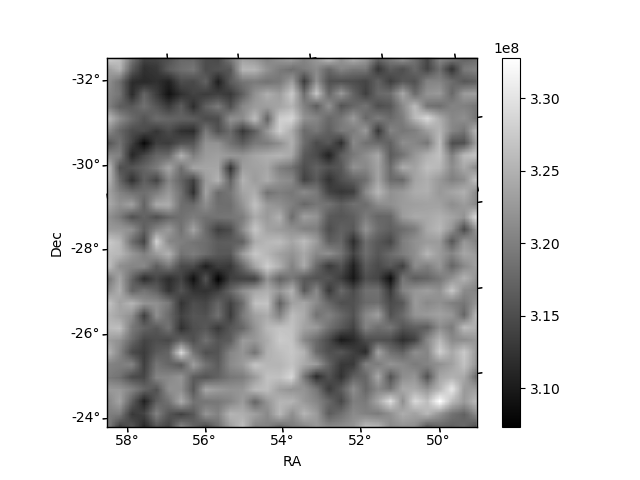
Histogram calculated using DETX and DETY for each event in the final _common_clean file
| Quadrant A | 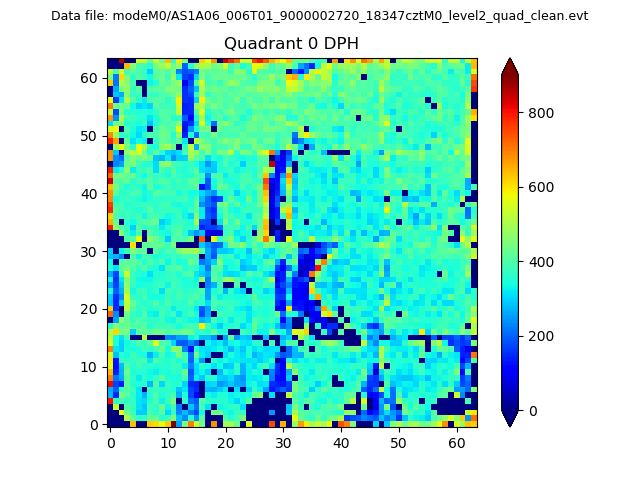 |
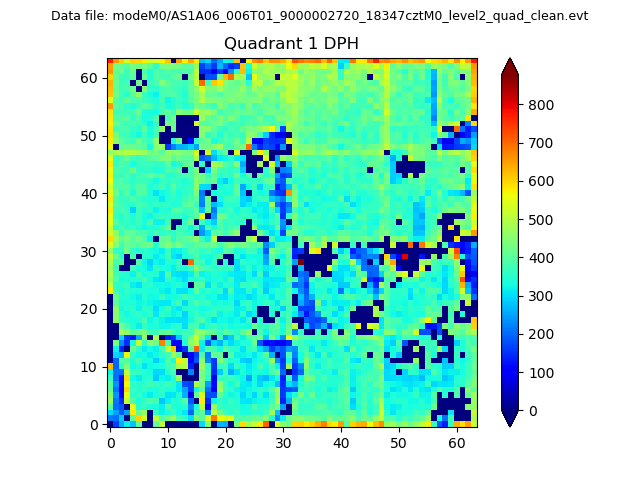 |
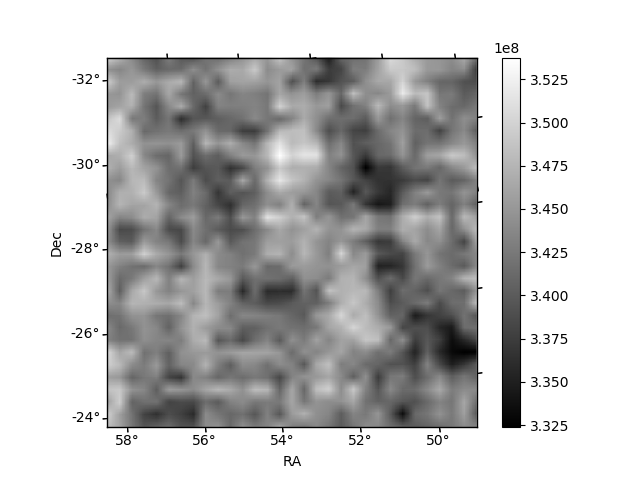
Quadrant B |
|---|---|---|---|
| Quadrant D | 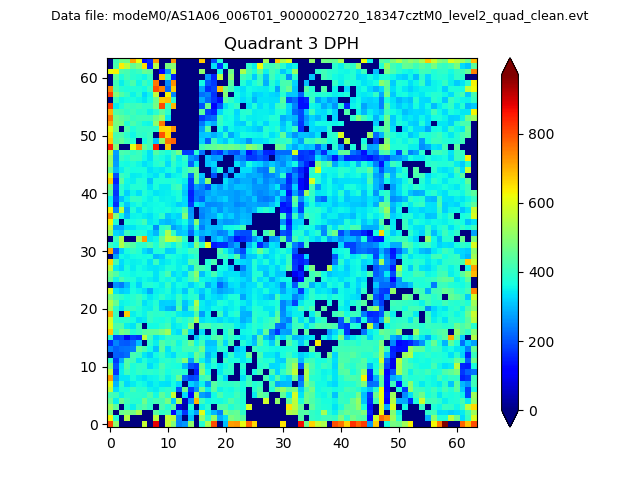 |
 |
Quadrant C |
| Plot type | Count rate plots | Images |
|---|---|---|
| Comparison with Poisson distribution Blue bars denote a histogram of data divided into 1 sec bins. Red curve is a Poisson curve with rate = median count rate of data. |
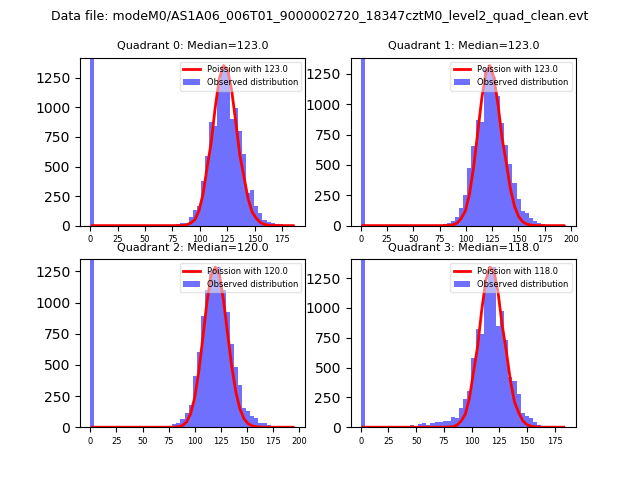 |
 |
| Quadrant-wise count rates Data is divided into 100 sec bins |
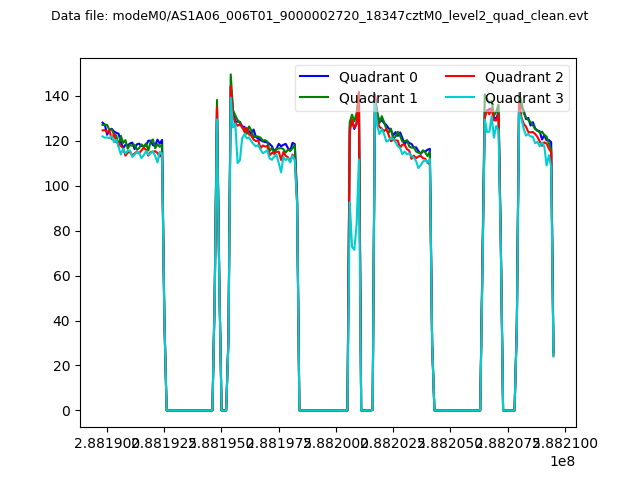 |
|
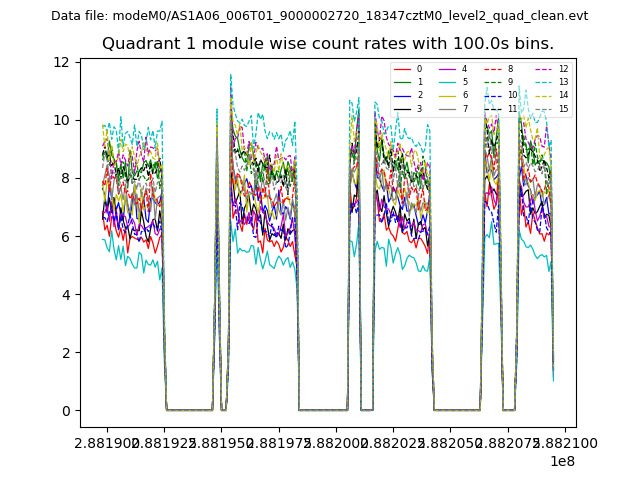
| Module-wise count rates for Quadrant A Data is divided into 100 sec bins |
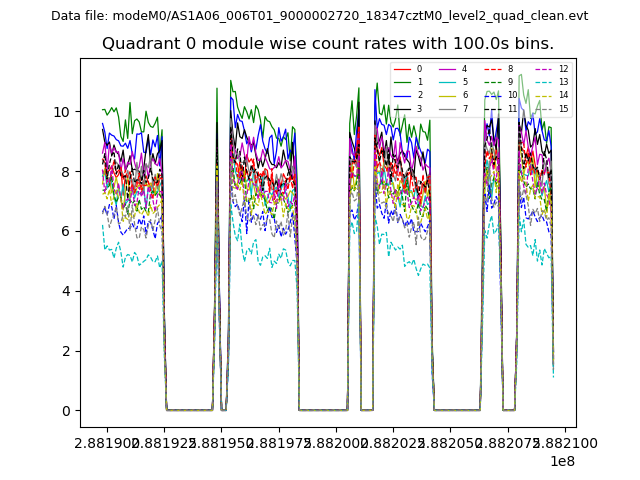 |
 |
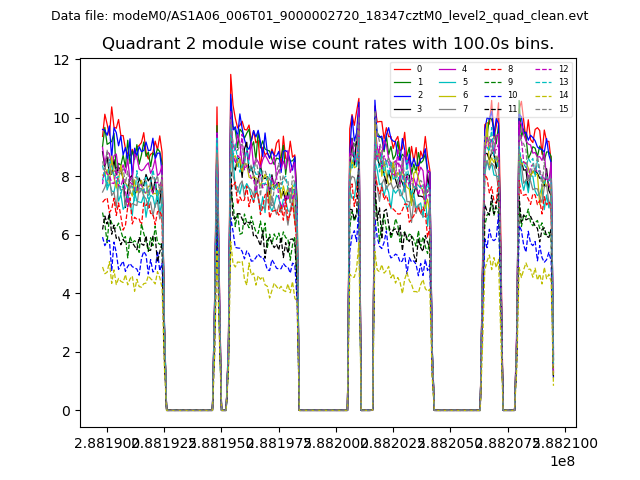
| Module-wise count rates for Quadrant B Data is divided into 100 sec bins |
 |
 |
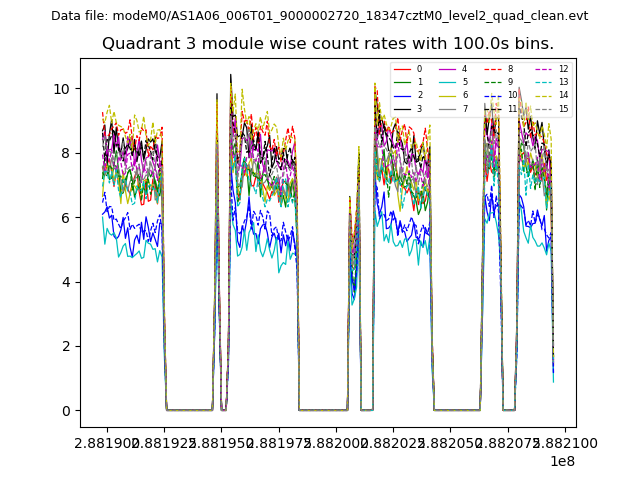
| Module-wise count rates for Quadrant C Data is divided into 100 sec bins |
 |
 |
| Module-wise count rates for Quadrant D Data is divided into 100 sec bins |
 |
 |
| Parameter | Plot |
|---|---|
| CZT HV Monitor | 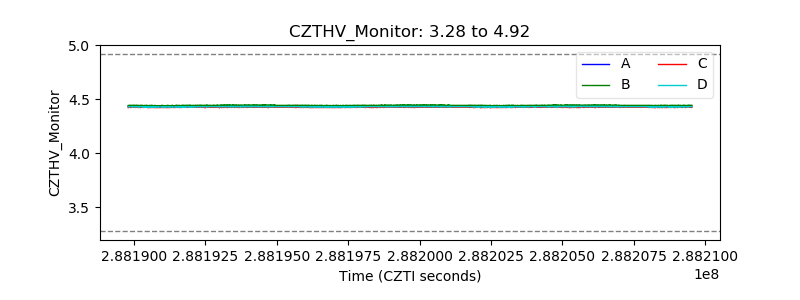 |
| D_VDD | 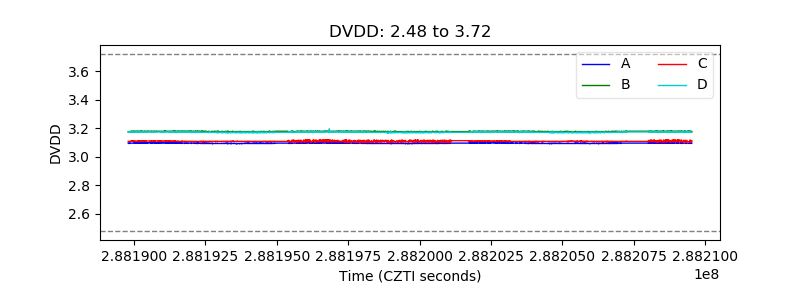 |
| Temperature 1 | 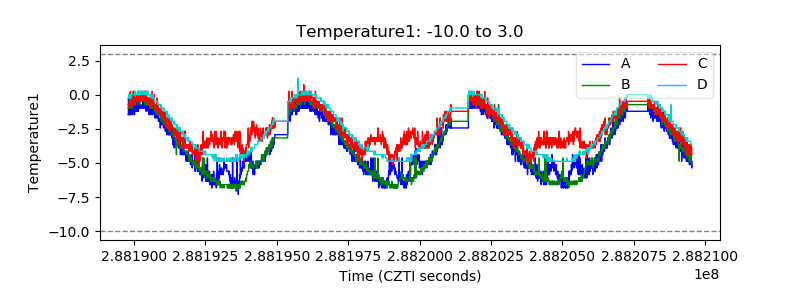 |
| Veto HV Monitor | 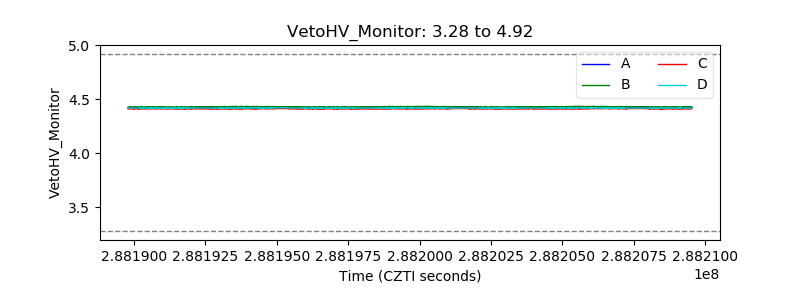 |
| Veto LLD | 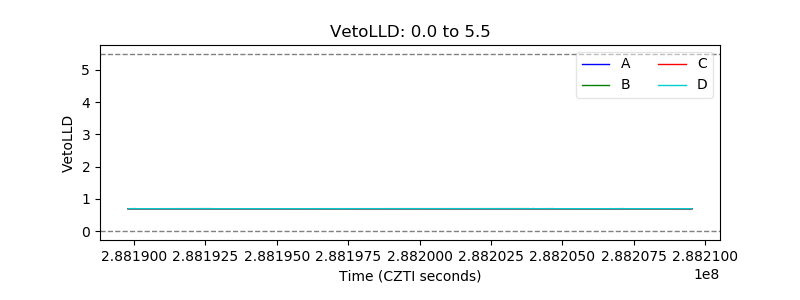 |
| Alpha Counter | 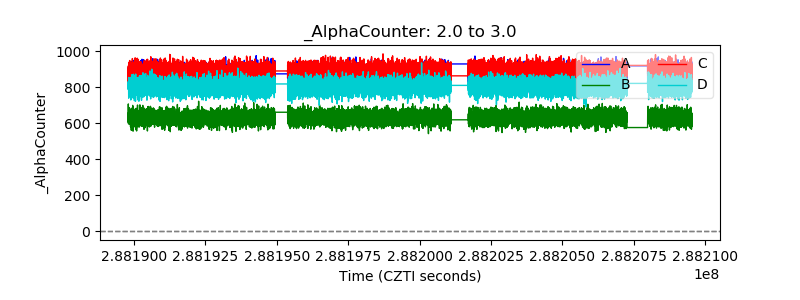 |
| _CPM_Rate | 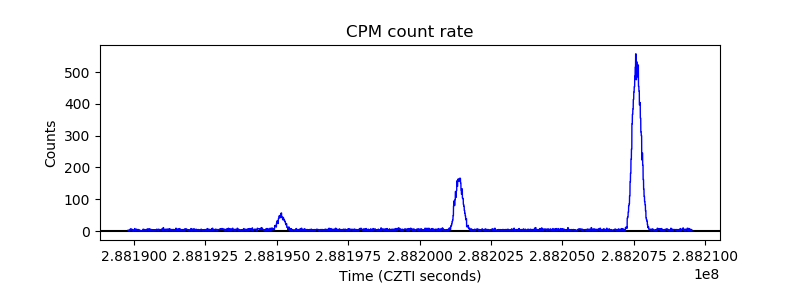 |
| CZT Counter | 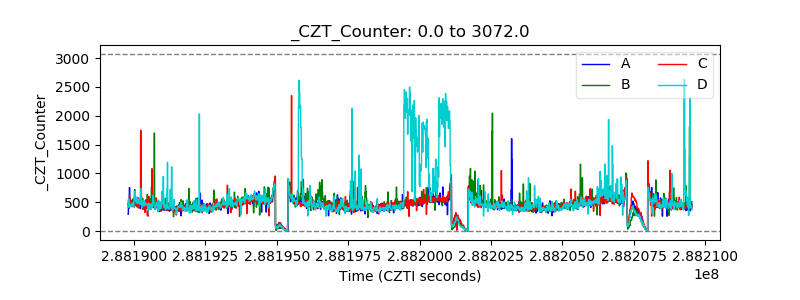 |
| +2.5 Volts monitor |  |
| +5 Volts monitor |  |
| _ROLL_ROT | 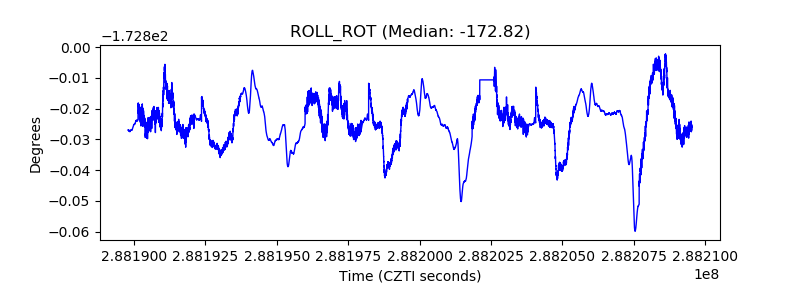 |
| _Roll_DEC | 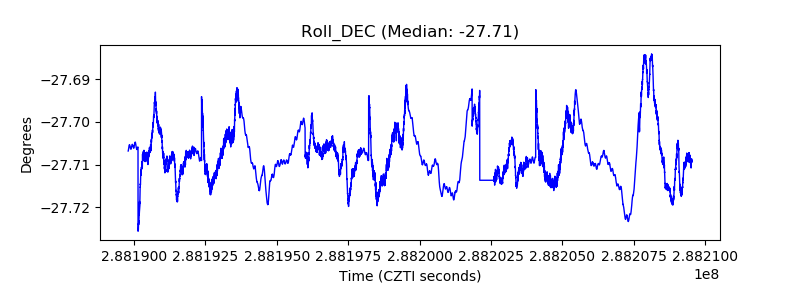 |
| _Roll_RA | 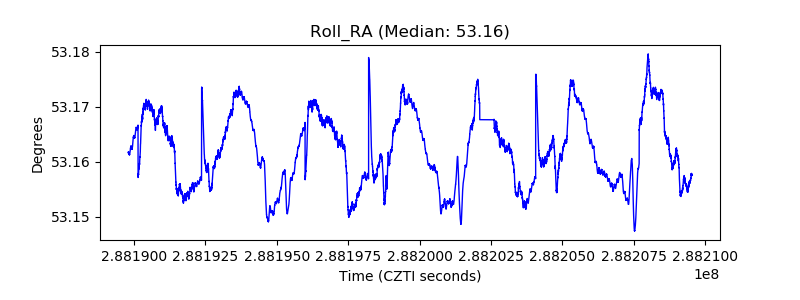 |
| Veto Counter | 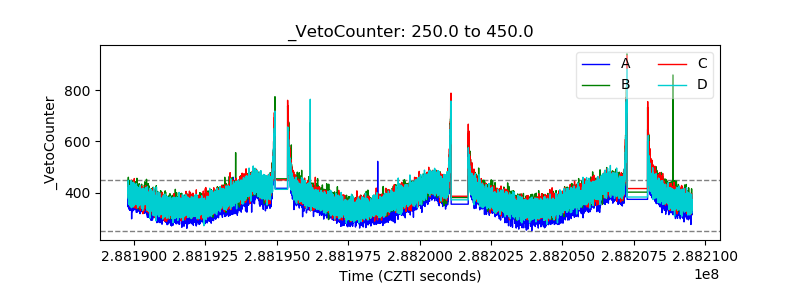 |