| Param | Original file | Final file |
|---|---|---|
| Filename | modeM0/AS1A06_006T01_9000002720_18348cztM0_level2.evt | modeM0/AS1A06_006T01_9000002720_18348cztM0_level2_quad_clean.evt |
| Size (bytes) | 487,857,600 | 91,716,480 |
| Size | 465.3 MB | 87.5 MB |
| Events in quadrant A | 3,171,490 | 587,392 |
| Events in quadrant B | 3,364,205 | 589,556 |
| Events in quadrant C | 3,254,170 | 572,227 |
| Events in quadrant D | 4,524,750 | 556,148 |
| Mode SS | |||
|---|---|---|---|
| Quadrant | BADHDUFLAG | Total packets | Discarded packets |
| A | 0 | 138 | 0 |
| B | 0 | 138 | 0 |
| C | 0 | 138 | 0 |
| D | 0 | 138 | 0 |
| Mode M9 | |||
|---|---|---|---|
| Quadrant | BADHDUFLAG | Total packets | Discarded packets |
| A | 0 | 17 | 0 |
| B | 0 | 17 | 0 |
| C | 0 | 17 | 0 |
| D | 0 | 17 | 0 |
| Mode M0 | |||
|---|---|---|---|
| Quadrant | BADHDUFLAG | Total packets | Discarded packets |
| A | 0 | 13921 | 2 |
| B | 0 | 14302 | 3 |
| C | 0 | 14118 | 2 |
| D | 0 | 18174 | 2 |
| Quadrant | Total seconds | Saturated seconds | Saturation percentage |
|---|---|---|---|
| A | 6780 | 42 | 0.619469% |
| B | 6779 | 62 | 0.914589% |
| C | 6780 | 67 | 0.988201% |
| D | 6780 | 374 | 5.516224% |
Noise dominated data is calculated using 1-second bins in cleaned event files. If a bin has >2000 counts, and if more than 50% of those come from <1% of pixels, then it is considered to be noise-dominated and hence unusable.
| Quadrant | # 1 sec bins | Bins with >0 counts | Bins with >2000 counts | High rate bins dominated by noise | Noise dominated (total time) | Noise dominated (detector-on time) | Marked lightcurve |
|---|---|---|---|---|---|---|---|
| A | 8420 | 6782 | 2 | 2 | 0.02% | 0.03% | 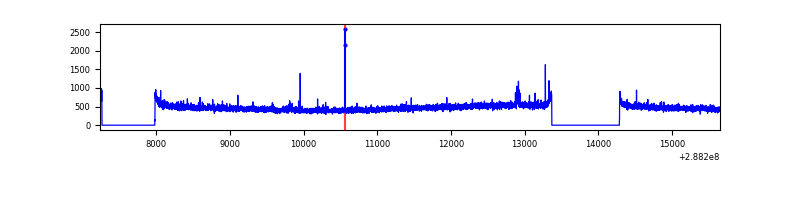 |
| B | 8419 | 6781 | 10 | 10 | 0.12% | 0.15% | 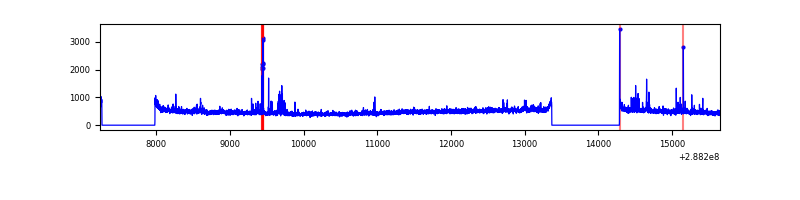 |
| C | 8420 | 6782 | 1 | 1 | 0.01% | 0.01% | 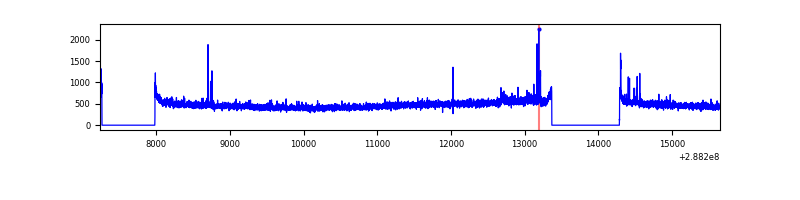 |
| D | 8420 | 6782 | 326 | 326 | 3.87% | 4.81% | 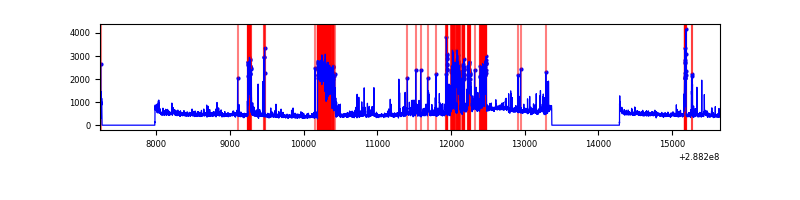 |
Top three noisy pixels from each quadrant. If the there are fewer than three noisy pixels in the level2.evt file, extra rows are filled as -1
| Pixel properties | Quadrant properties | ||||||
|---|---|---|---|---|---|---|---|
| Quadrant | DetID | PixID | Counts | Sigma | Mean | Median | Sigma |
| A | 15 | 174 | 24571 | 142.73 | 814 | 796 | 166.6 |
| A | 4 | 2 | 15023 | 85.41 | 814 | 796 | 166.6 |
| A | 0 | 226 | 7190 | 38.39 | 814 | 796 | 166.6 |
| B | 7 | 220 | 47370 | 294.28 | 818 | 797 | 158.3 |
| B | 0 | 197 | 26875 | 164.78 | 818 | 797 | 158.3 |
| B | 4 | 48 | 25165 | 153.97 | 818 | 797 | 158.3 |
| C | 14 | 238 | 119361 | 643.24 | 778 | 783 | 184.3 |
| C | 3 | 233 | 47337 | 252.54 | 778 | 783 | 184.3 |
| C | 0 | 207 | 41930 | 223.21 | 778 | 783 | 184.3 |
| D | 1 | 52 | 1147090 | 5976.68 | 777 | 754 | 191.8 |
| D | 2 | 69 | 151148 | 784.11 | 777 | 754 | 191.8 |
| D | 2 | 33 | 78886 | 407.36 | 777 | 754 | 191.8 |
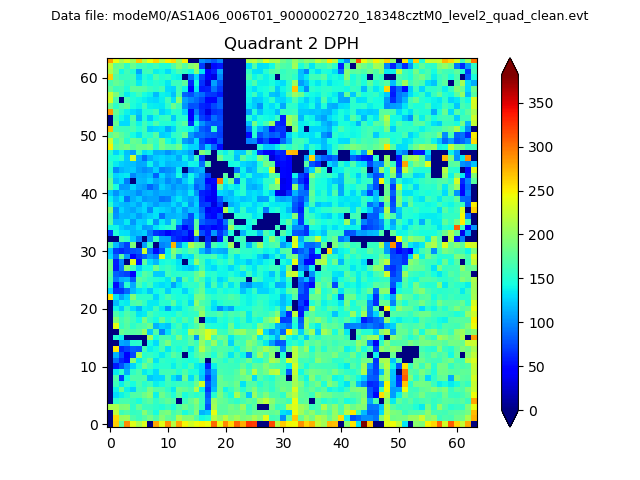
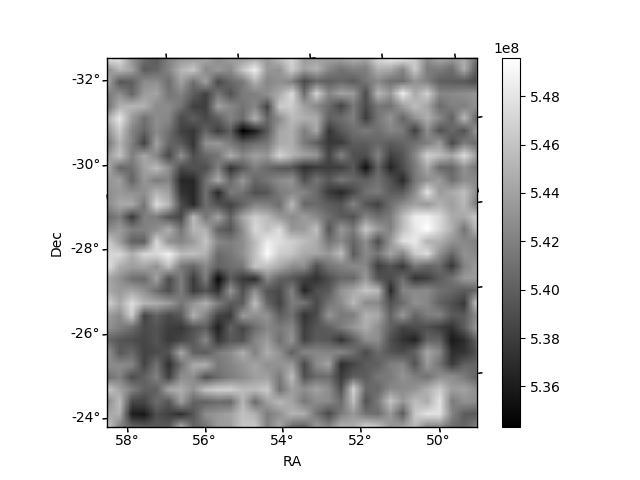
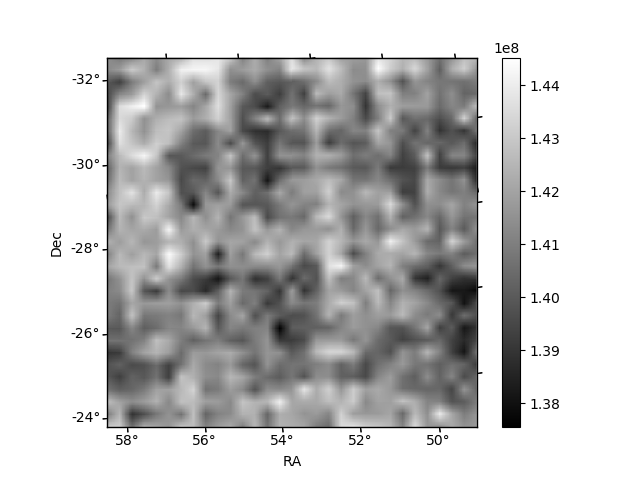
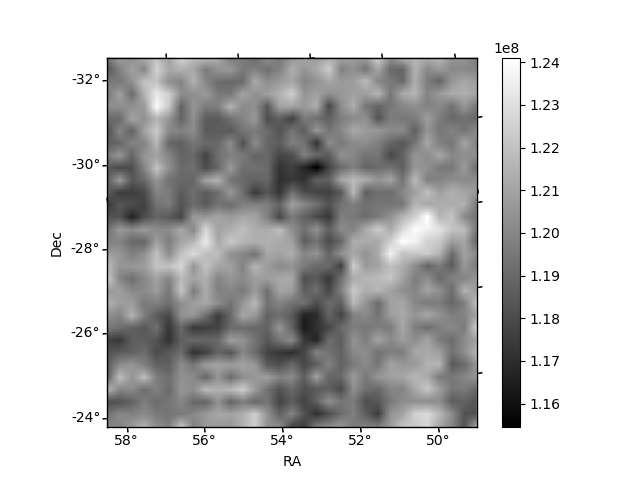
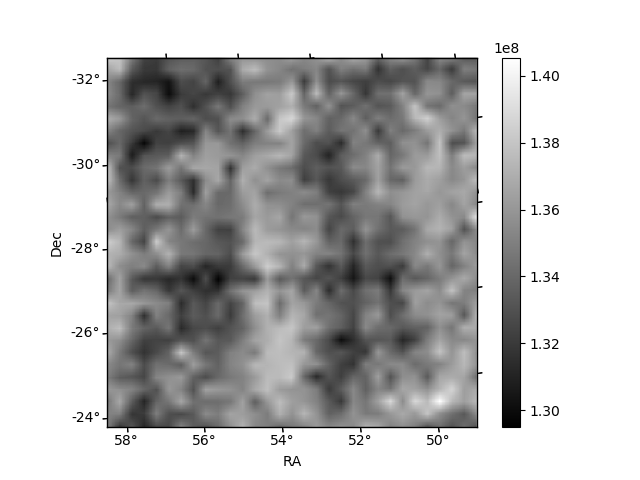
Histogram calculated using DETX and DETY for each event in the final _common_clean file
| Quadrant A | 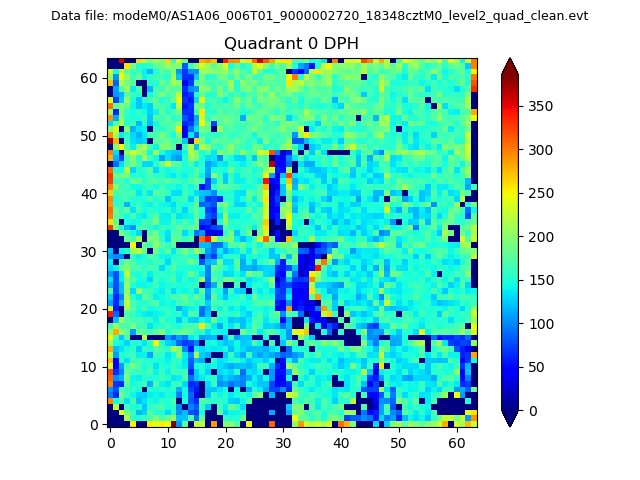 |
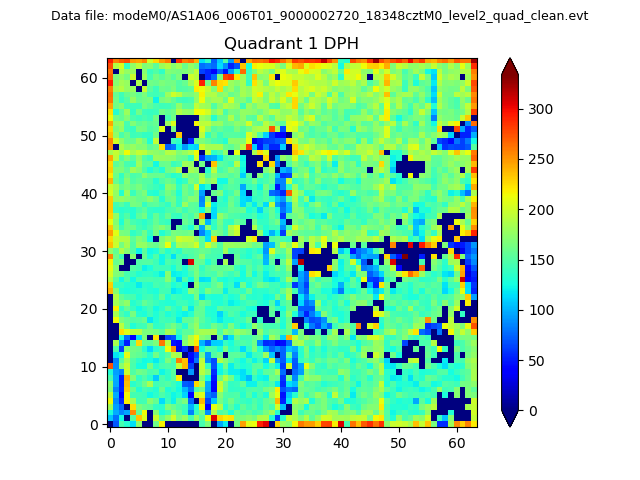 |
Quadrant B |
|---|---|---|---|
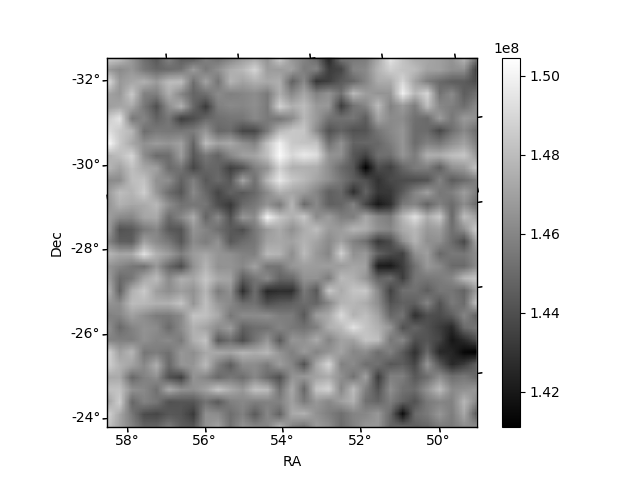
| Quadrant D | 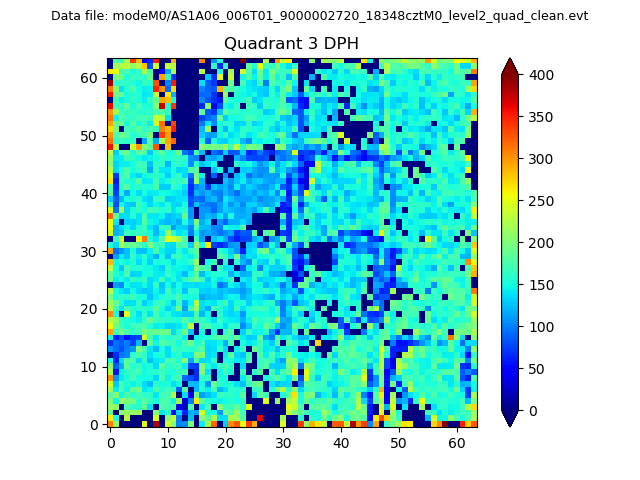 |
 |
Quadrant C |
| Plot type | Count rate plots | Images |
|---|---|---|
| Comparison with Poisson distribution Blue bars denote a histogram of data divided into 1 sec bins. Red curve is a Poisson curve with rate = median count rate of data. |
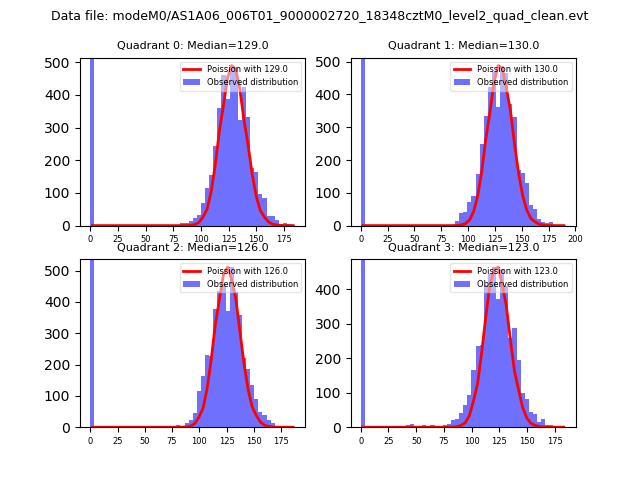 |
 |
| Quadrant-wise count rates Data is divided into 100 sec bins |
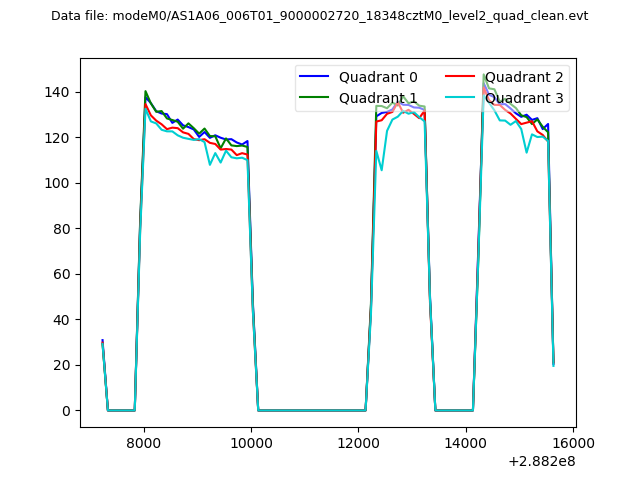 |
|
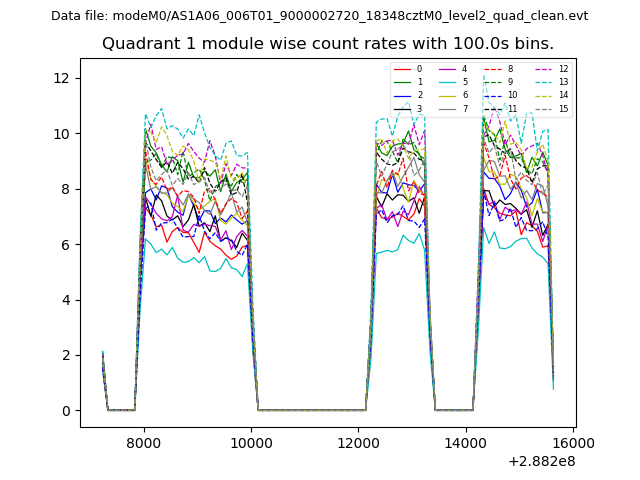
| Module-wise count rates for Quadrant A Data is divided into 100 sec bins |
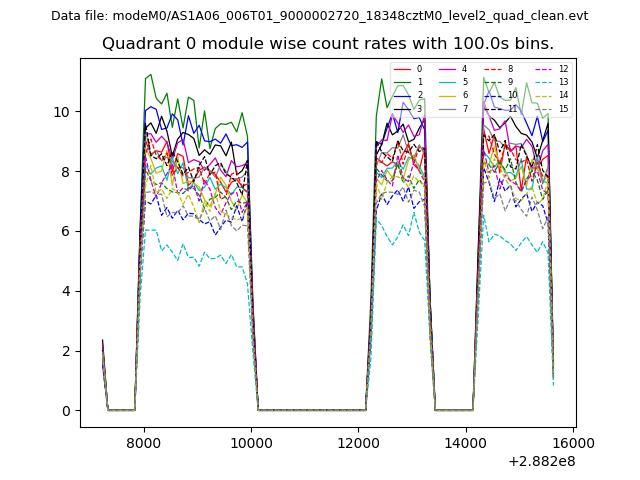 |
 |
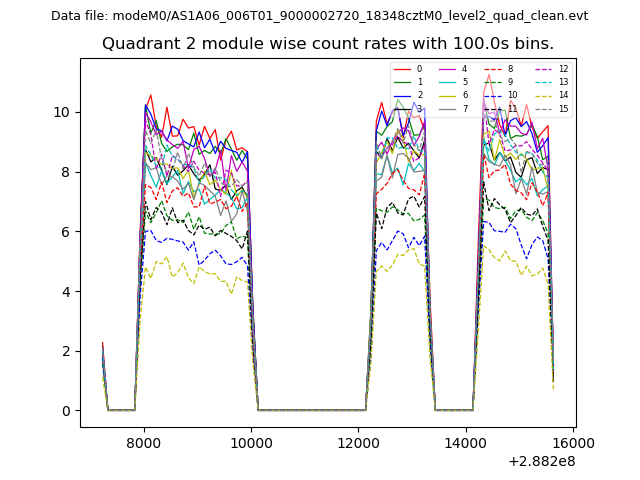
| Module-wise count rates for Quadrant B Data is divided into 100 sec bins |
 |
 |
| Module-wise count rates for Quadrant C Data is divided into 100 sec bins |
 |
 |
| Module-wise count rates for Quadrant D Data is divided into 100 sec bins |
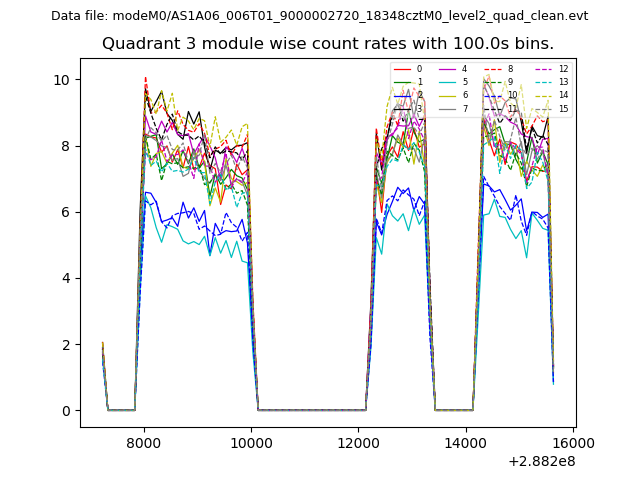 |
 |
| Parameter | Plot |
|---|---|
| CZT HV Monitor | 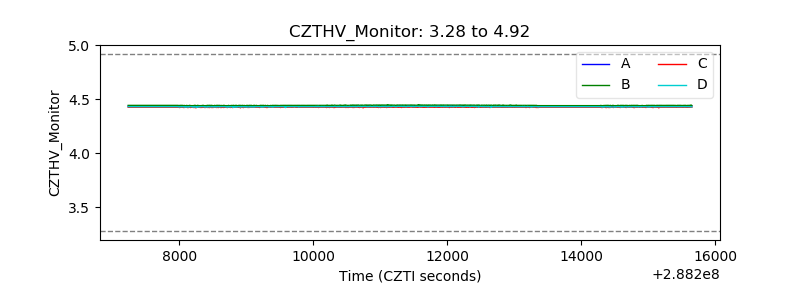 |
| D_VDD | 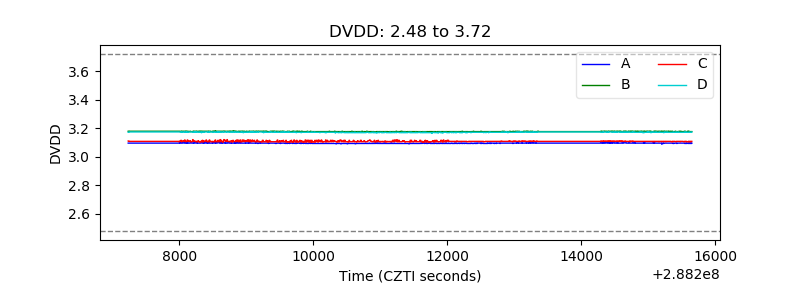 |
| Temperature 1 | 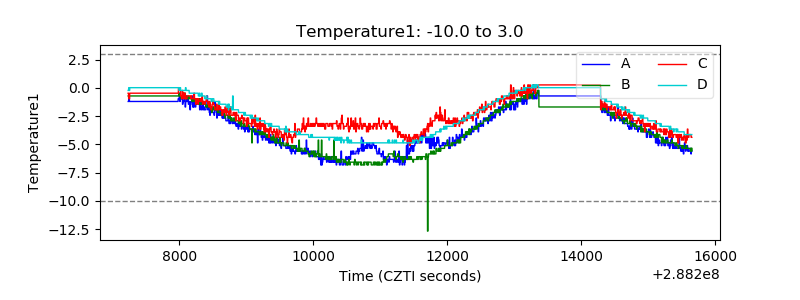 |
| Veto HV Monitor | 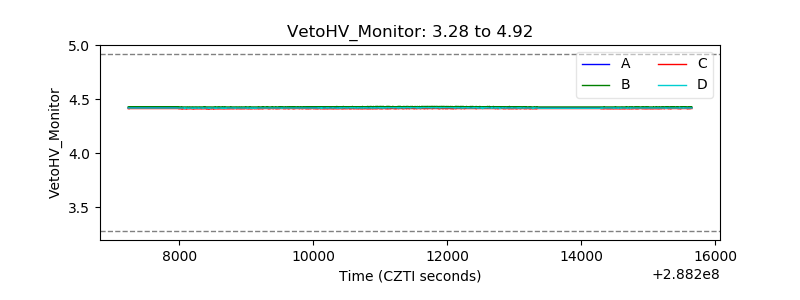 |
| Veto LLD | 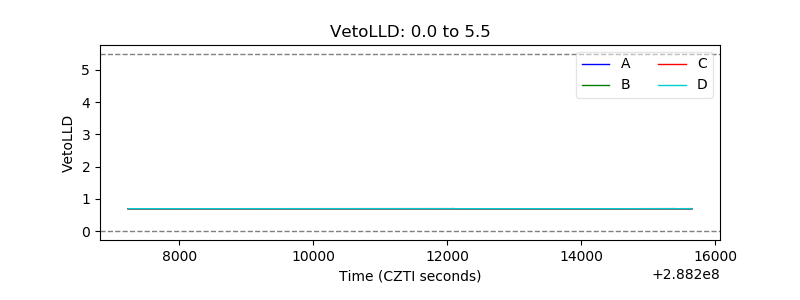 |
| Alpha Counter | 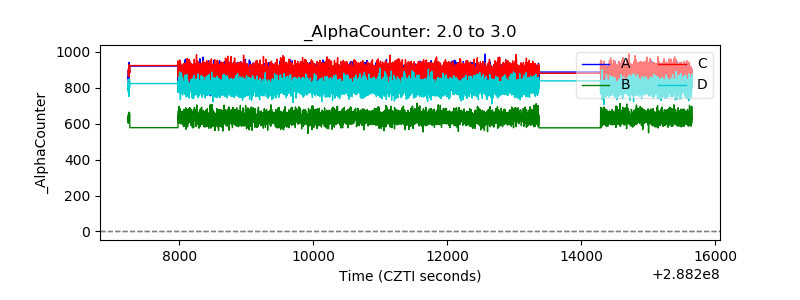 |
| _CPM_Rate | 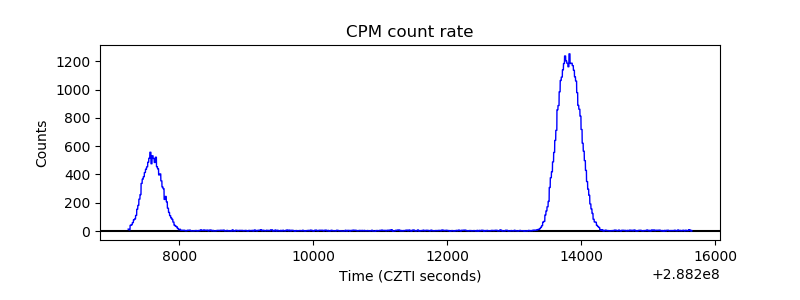 |
| CZT Counter | 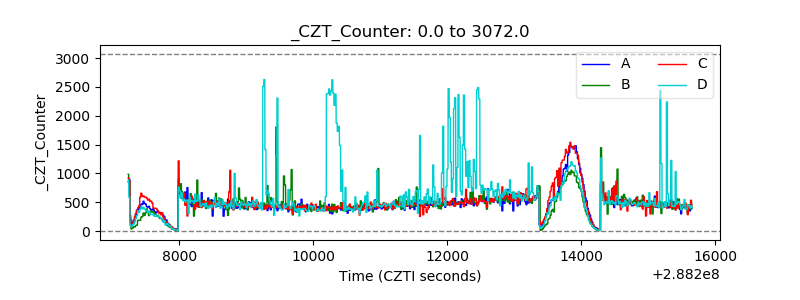 |
| +2.5 Volts monitor | 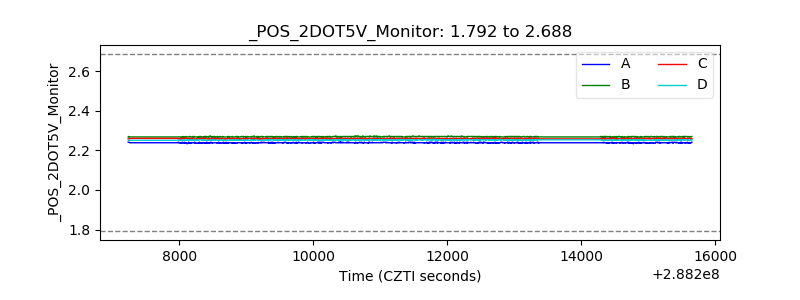 |
| +5 Volts monitor |  |
| _ROLL_ROT | 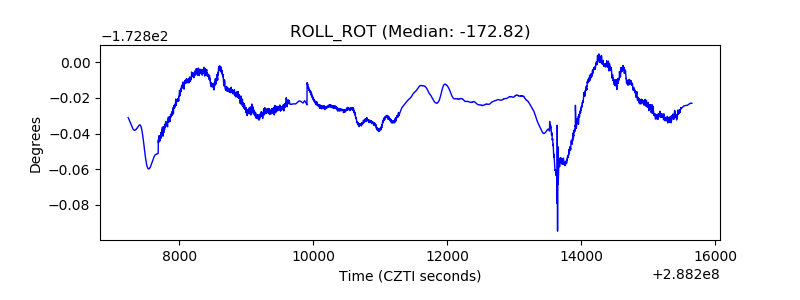 |
| _Roll_DEC | 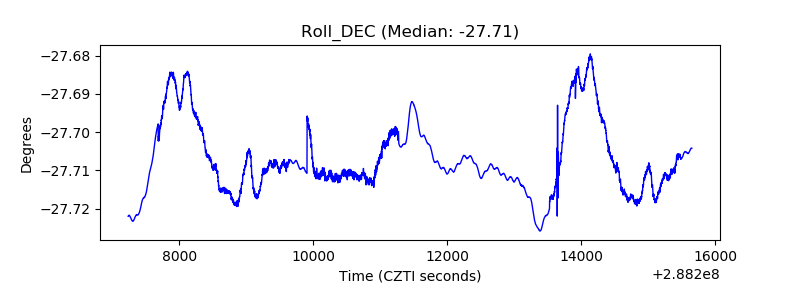 |
| _Roll_RA | 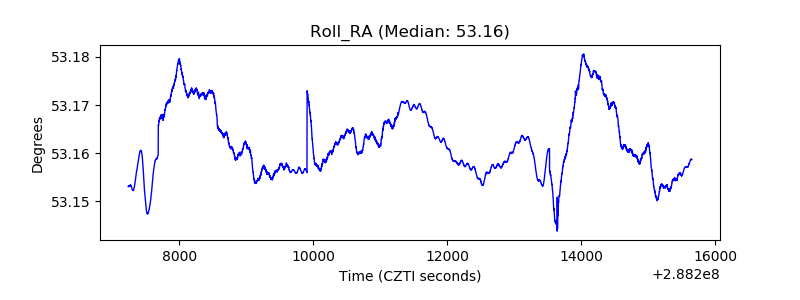 |
| Veto Counter | 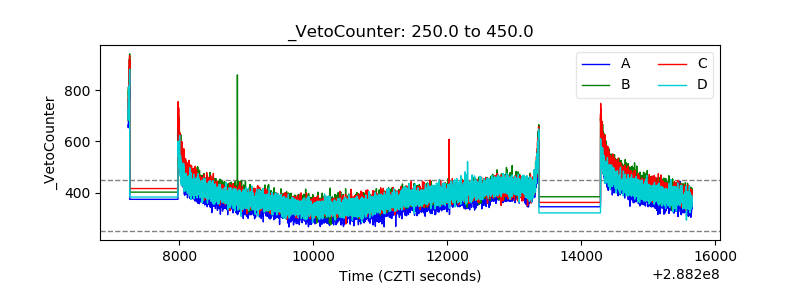 |