| Param | Original file | Final file |
|---|---|---|
| Filename | modeM0/AS1A06_006T01_9000002720_18349cztM0_level2.evt | modeM0/AS1A06_006T01_9000002720_18349cztM0_level2_quad_clean.evt |
| Size (bytes) | 452,214,720 | 89,035,200 |
| Size | 431.3 MB | 84.9 MB |
| Events in quadrant A | 3,099,707 | 565,877 |
| Events in quadrant B | 3,331,721 | 573,419 |
| Events in quadrant C | 3,272,841 | 555,285 |
| Events in quadrant D | 3,540,407 | 539,298 |
| Mode SS | |||
|---|---|---|---|
| Quadrant | BADHDUFLAG | Total packets | Discarded packets |
| A | 0 | 134 | 0 |
| B | 0 | 134 | 0 |
| C | 0 | 134 | 0 |
| D | 0 | 134 | 0 |
| Mode M9 | |||
|---|---|---|---|
| Quadrant | BADHDUFLAG | Total packets | Discarded packets |
| A | 0 | 17 | 0 |
| B | 0 | 18 | 0 |
| C | 0 | 18 | 0 |
| D | 0 | 18 | 0 |
| Mode M0 | |||
|---|---|---|---|
| Quadrant | BADHDUFLAG | Total packets | Discarded packets |
| A | 0 | 13493 | 2 |
| B | 0 | 14080 | 2 |
| C | 0 | 13968 | 2 |
| D | 0 | 15013 | 2 |
| Quadrant | Total seconds | Saturated seconds | Saturation percentage |
|---|---|---|---|
| A | 6633 | 22 | 0.331675% |
| B | 6633 | 44 | 0.663350% |
| C | 6633 | 61 | 0.919644% |
| D | 6633 | 33 | 0.497512% |
Noise dominated data is calculated using 1-second bins in cleaned event files. If a bin has >2000 counts, and if more than 50% of those come from <1% of pixels, then it is considered to be noise-dominated and hence unusable.
| Quadrant | # 1 sec bins | Bins with >0 counts | Bins with >2000 counts | High rate bins dominated by noise | Noise dominated (total time) | Noise dominated (detector-on time) | Marked lightcurve |
|---|---|---|---|---|---|---|---|
| A | 7688 | 6634 | 0 | 0 | 0.00% | 0.00% | 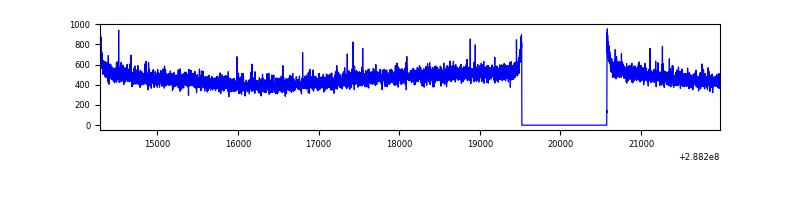 |
| B | 7688 | 6634 | 6 | 6 | 0.08% | 0.09% | 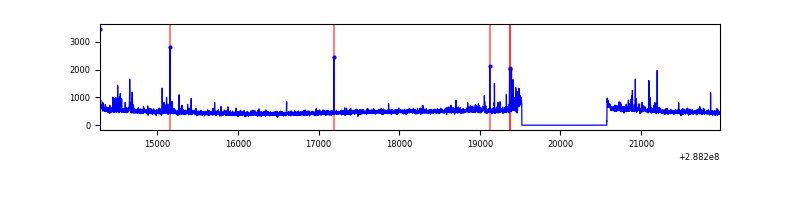 |
| C | 7688 | 6634 | 12 | 12 | 0.16% | 0.18% | 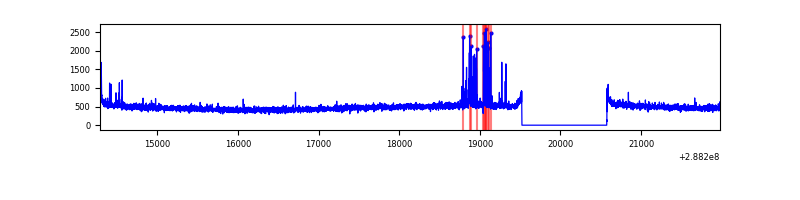 |
| D | 7688 | 6634 | 23 | 23 | 0.30% | 0.35% | 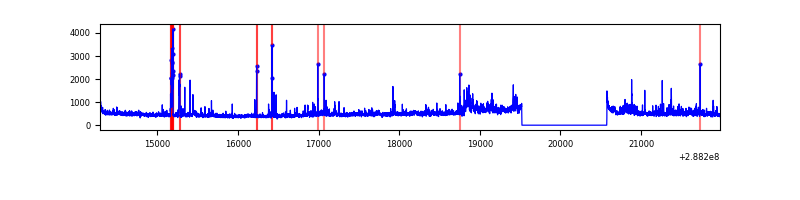 |
Top three noisy pixels from each quadrant. If the there are fewer than three noisy pixels in the level2.evt file, extra rows are filled as -1
| Pixel properties | Quadrant properties | ||||||
|---|---|---|---|---|---|---|---|
| Quadrant | DetID | PixID | Counts | Sigma | Mean | Median | Sigma |
| A | 0 | 226 | 6881 | 37.51 | 803 | 785 | 162.5 |
| A | 12 | 194 | 5815 | 30.95 | 803 | 785 | 162.5 |
| A | 3 | 137 | 5772 | 30.69 | 803 | 785 | 162.5 |
| B | 7 | 220 | 41690 | 263.06 | 812 | 793 | 155.5 |
| B | 4 | 48 | 32561 | 204.34 | 812 | 793 | 155.5 |
| B | 0 | 197 | 22815 | 141.65 | 812 | 793 | 155.5 |
| C | 0 | 207 | 138906 | 763.25 | 772 | 777 | 181.0 |
| C | 14 | 238 | 118989 | 653.19 | 772 | 777 | 181.0 |
| C | 3 | 233 | 5525 | 26.24 | 772 | 777 | 181.0 |
| D | 7 | 238 | 143560 | 747.06 | 778 | 757 | 191.2 |
| D | 11 | 176 | 119993 | 623.77 | 778 | 757 | 191.2 |
| D | 2 | 33 | 77016 | 398.94 | 778 | 757 | 191.2 |
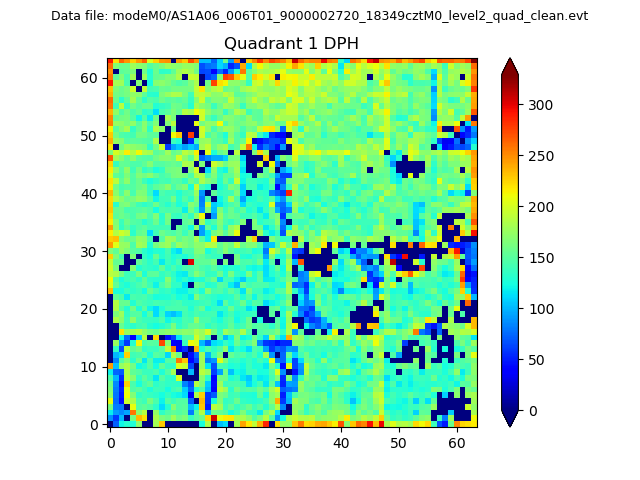
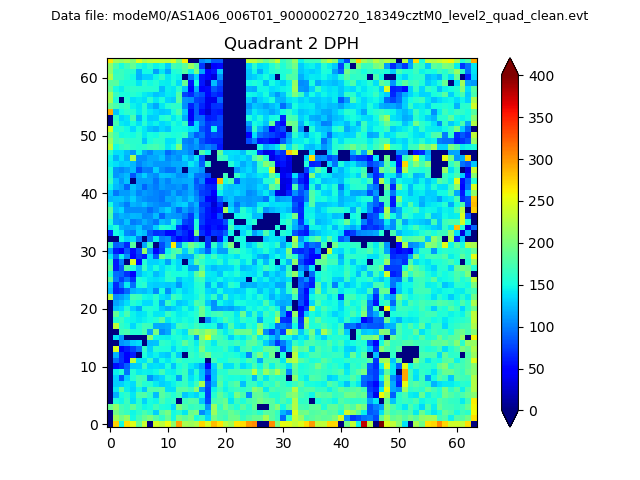
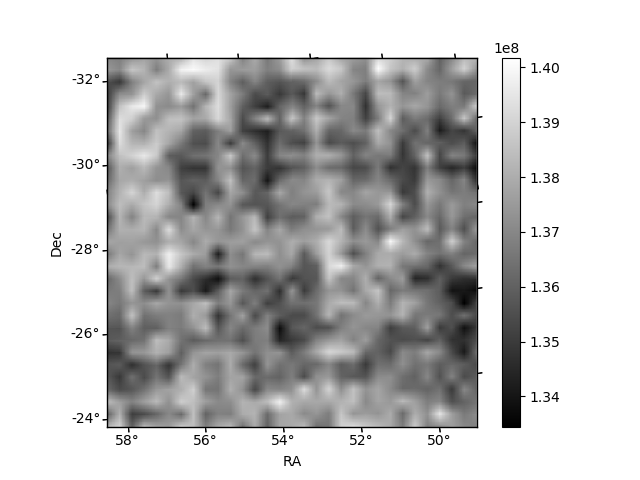
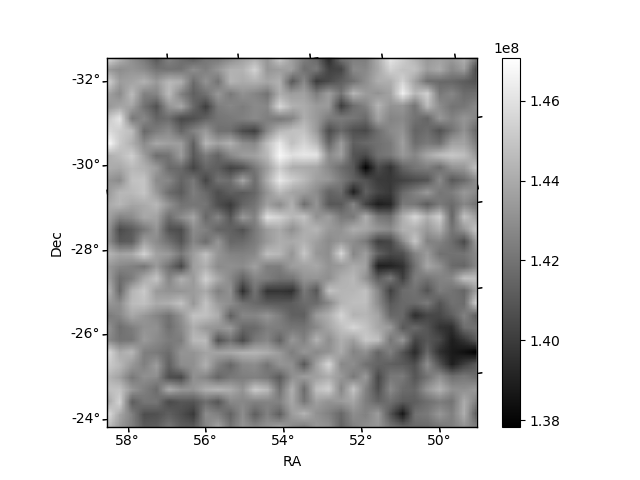
Histogram calculated using DETX and DETY for each event in the final _common_clean file
| Quadrant A |  |
 |
Quadrant B |
|---|---|---|---|
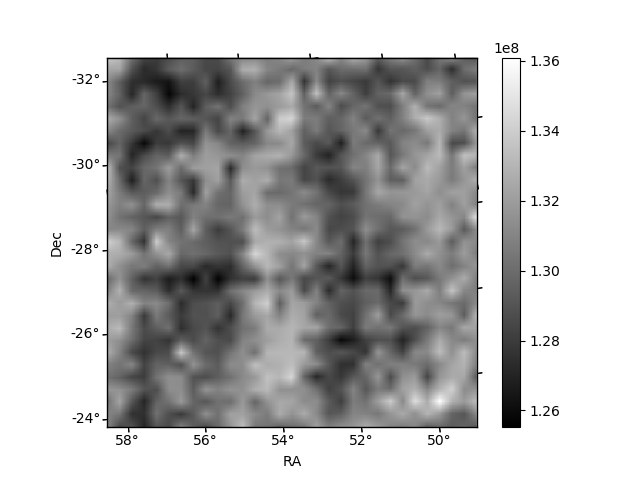
| Quadrant D |  |
 |
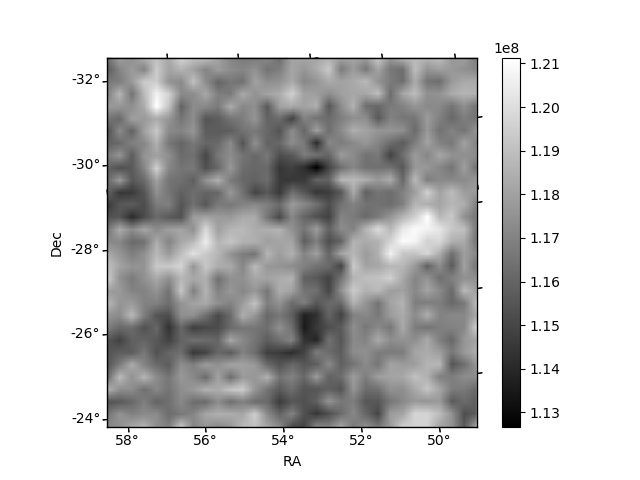
Quadrant C |
| Plot type | Count rate plots | Images |
|---|---|---|
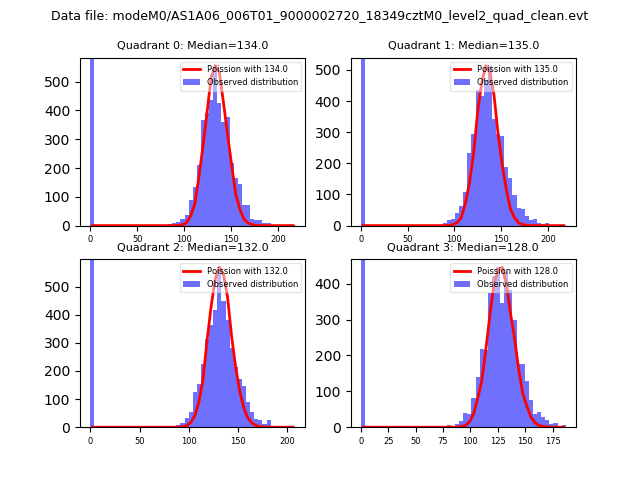
| Comparison with Poisson distribution Blue bars denote a histogram of data divided into 1 sec bins. Red curve is a Poisson curve with rate = median count rate of data. |
 |
 |
| Quadrant-wise count rates Data is divided into 100 sec bins |
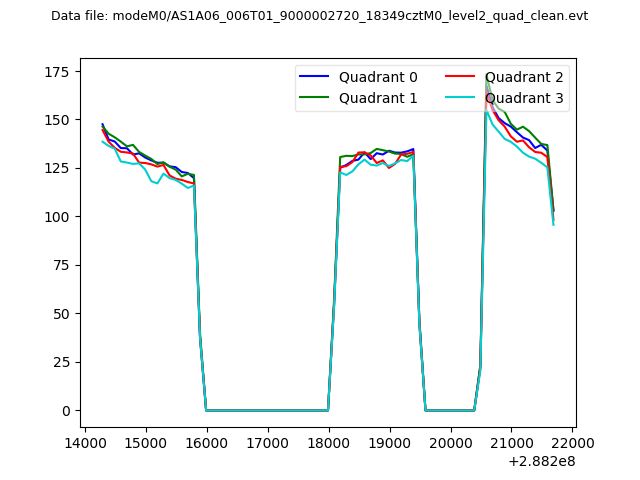 |
|
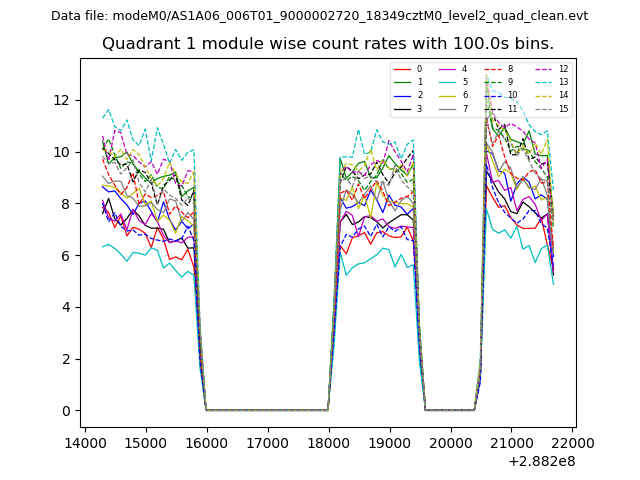
| Module-wise count rates for Quadrant A Data is divided into 100 sec bins |
 |
 |
| Module-wise count rates for Quadrant B Data is divided into 100 sec bins |
 |
 |
| Module-wise count rates for Quadrant C Data is divided into 100 sec bins |
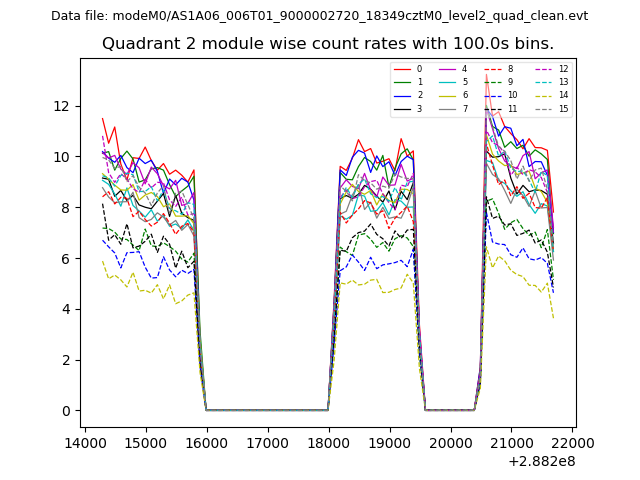 |
 |
| Module-wise count rates for Quadrant D Data is divided into 100 sec bins |
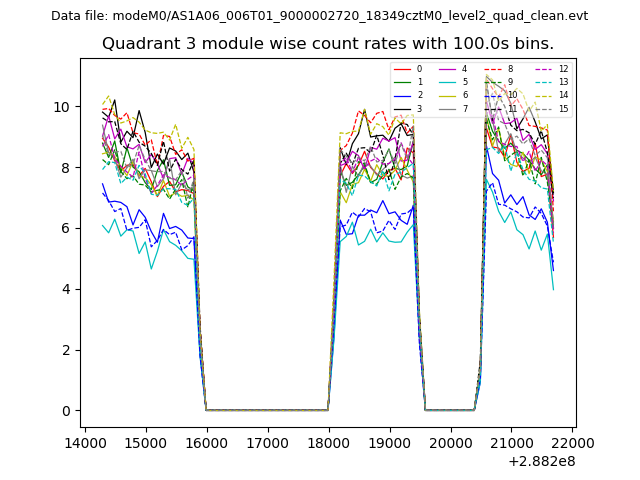 |
 |
| Parameter | Plot |
|---|---|
| CZT HV Monitor |  |
| D_VDD | 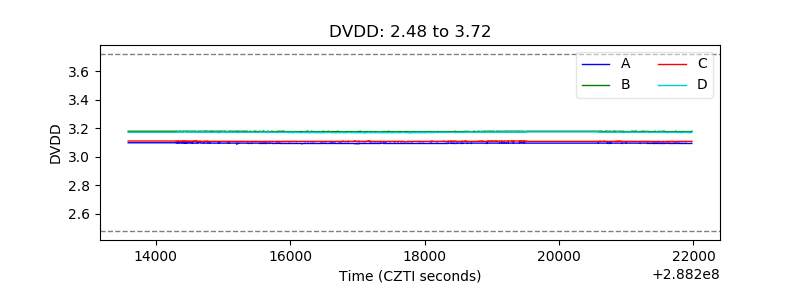 |
| Temperature 1 | 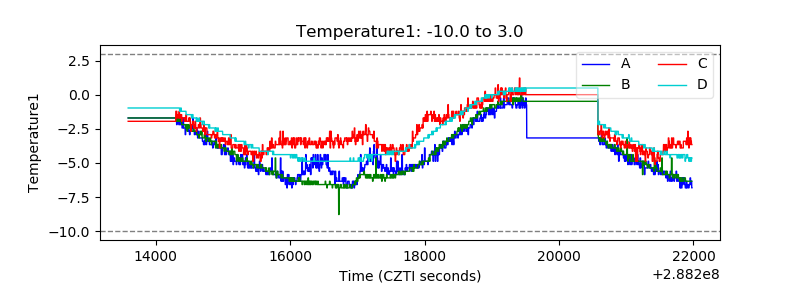 |
| Veto HV Monitor | 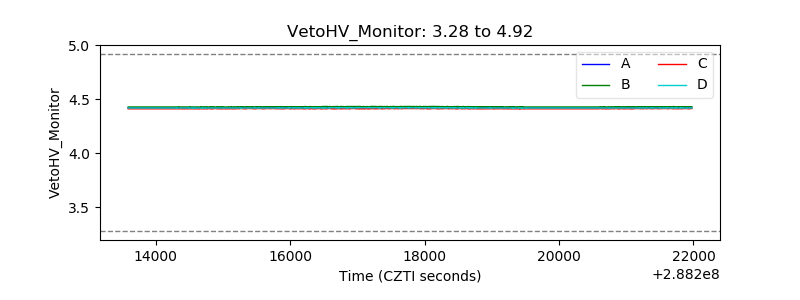 |
| Veto LLD | 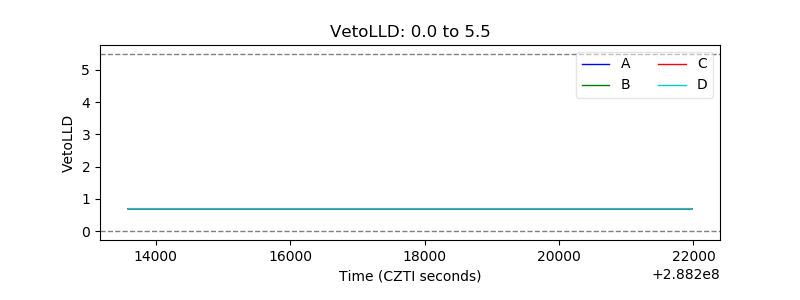 |
| Alpha Counter | 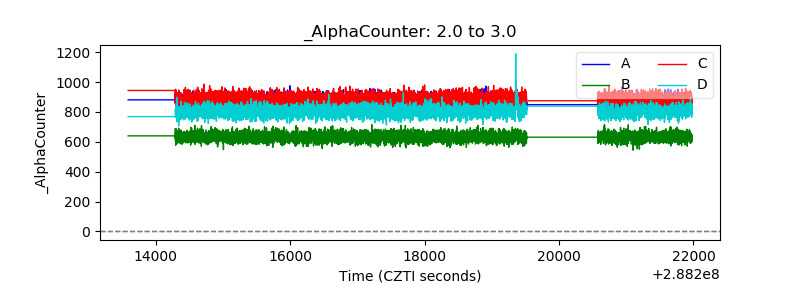 |
| _CPM_Rate | 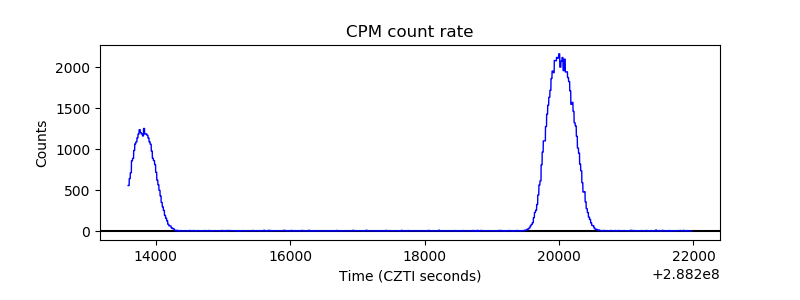 |
| CZT Counter | 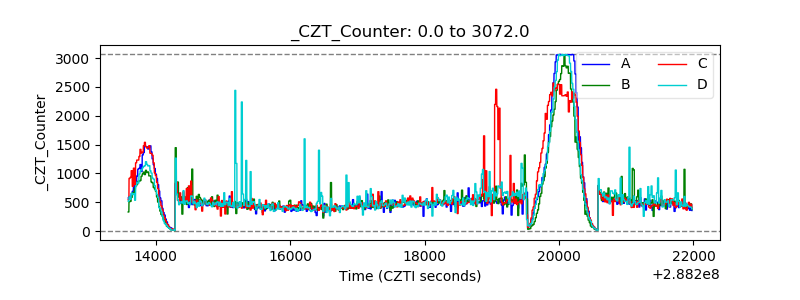 |
| +2.5 Volts monitor |  |
| +5 Volts monitor |  |
| _ROLL_ROT |  |
| _Roll_DEC | 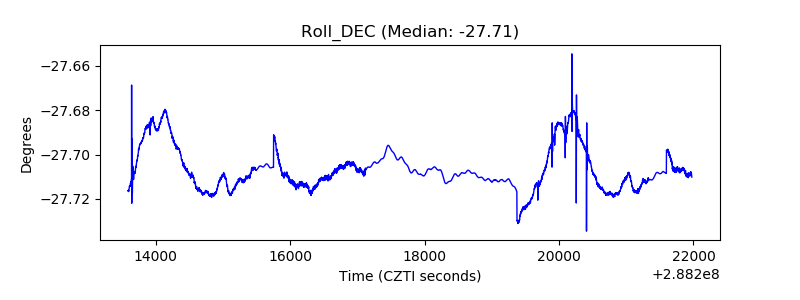 |
| _Roll_RA | 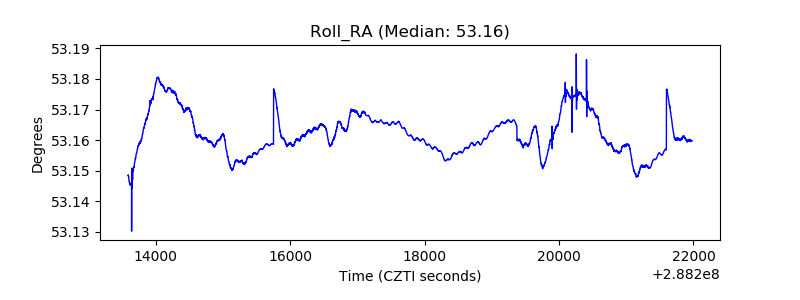 |
| Veto Counter | 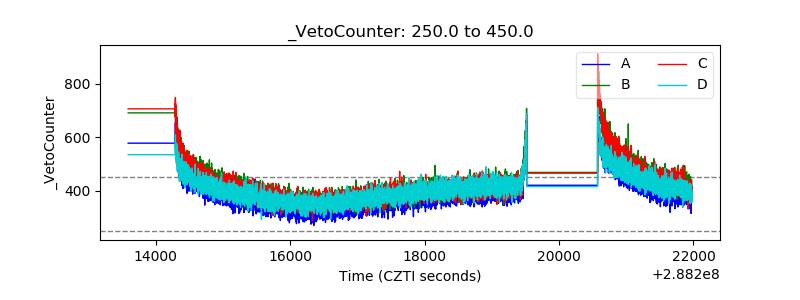 |