| Param | Original file | Final file |
|---|---|---|
| Filename | modeM0/AS1A06_006T01_9000002720_18351cztM0_level2.evt | modeM0/AS1A06_006T01_9000002720_18351cztM0_level2_quad_clean.evt |
| Size (bytes) | 467,288,640 | 83,632,320 |
| Size | 445.6 MB | 79.8 MB |
| Events in quadrant A | 3,250,063 | 521,892 |
| Events in quadrant B | 3,493,513 | 533,925 |
| Events in quadrant C | 3,327,056 | 512,846 |
| Events in quadrant D | 3,629,104 | 499,769 |
| Mode SS | |||
|---|---|---|---|
| Quadrant | BADHDUFLAG | Total packets | Discarded packets |
| A | 0 | 136 | 0 |
| B | 0 | 136 | 0 |
| C | 0 | 136 | 0 |
| D | 0 | 136 | 0 |
| Mode M9 | |||
|---|---|---|---|
| Quadrant | BADHDUFLAG | Total packets | Discarded packets |
| A | 0 | 15 | 0 |
| B | 0 | 16 | 0 |
| C | 0 | 16 | 0 |
| D | 0 | 16 | 0 |
| Mode M0 | |||
|---|---|---|---|
| Quadrant | BADHDUFLAG | Total packets | Discarded packets |
| A | 0 | 13786 | 3 |
| B | 0 | 14514 | 2 |
| C | 0 | 13912 | 2 |
| D | 0 | 14971 | 2 |
| Quadrant | Total seconds | Saturated seconds | Saturation percentage |
|---|---|---|---|
| A | 6654 | 23 | 0.345657% |
| B | 6654 | 52 | 0.781485% |
| C | 6654 | 53 | 0.796513% |
| D | 6654 | 28 | 0.420800% |
Noise dominated data is calculated using 1-second bins in cleaned event files. If a bin has >2000 counts, and if more than 50% of those come from <1% of pixels, then it is considered to be noise-dominated and hence unusable.
| Quadrant | # 1 sec bins | Bins with >0 counts | Bins with >2000 counts | High rate bins dominated by noise | Noise dominated (total time) | Noise dominated (detector-on time) | Marked lightcurve |
|---|---|---|---|---|---|---|---|
| A | 7824 | 6655 | 1 | 1 | 0.01% | 0.02% | 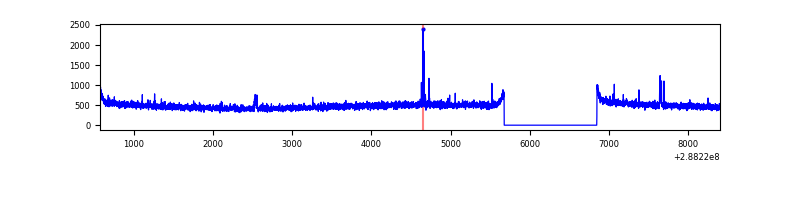 |
| B | 7824 | 6655 | 1 | 1 | 0.01% | 0.02% | 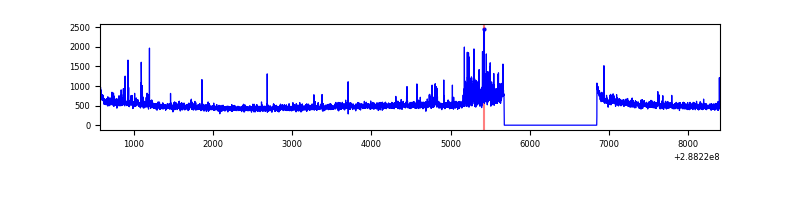 |
| C | 7824 | 6655 | 7 | 7 | 0.09% | 0.11% | 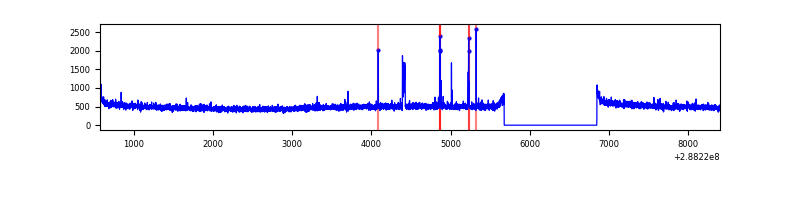 |
| D | 7824 | 6655 | 17 | 17 | 0.22% | 0.26% | 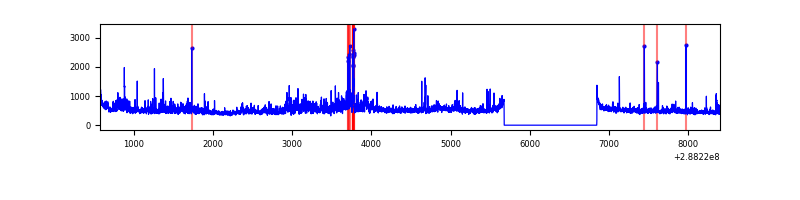 |
Top three noisy pixels from each quadrant. If the there are fewer than three noisy pixels in the level2.evt file, extra rows are filled as -1
| Pixel properties | Quadrant properties | ||||||
|---|---|---|---|---|---|---|---|
| Quadrant | DetID | PixID | Counts | Sigma | Mean | Median | Sigma |
| A | 15 | 174 | 50365 | 296.42 | 832 | 816 | 167.2 |
| A | 0 | 226 | 7274 | 38.63 | 832 | 816 | 167.2 |
| A | 12 | 194 | 5975 | 30.86 | 832 | 816 | 167.2 |
| B | 7 | 220 | 97443 | 603.73 | 843 | 823 | 160.0 |
| B | 0 | 197 | 23790 | 143.51 | 843 | 823 | 160.0 |
| B | 4 | 216 | 18696 | 111.68 | 843 | 823 | 160.0 |
| C | 14 | 238 | 124906 | 662.05 | 804 | 811 | 187.4 |
| C | 3 | 233 | 40144 | 209.84 | 804 | 811 | 187.4 |
| C | 0 | 207 | 28778 | 149.2 | 804 | 811 | 187.4 |
| D | 14 | 34 | 199064 | 1007.71 | 806 | 783 | 196.8 |
| D | 11 | 176 | 81092 | 408.15 | 806 | 783 | 196.8 |
| D | 1 | 52 | 79510 | 400.11 | 806 | 783 | 196.8 |
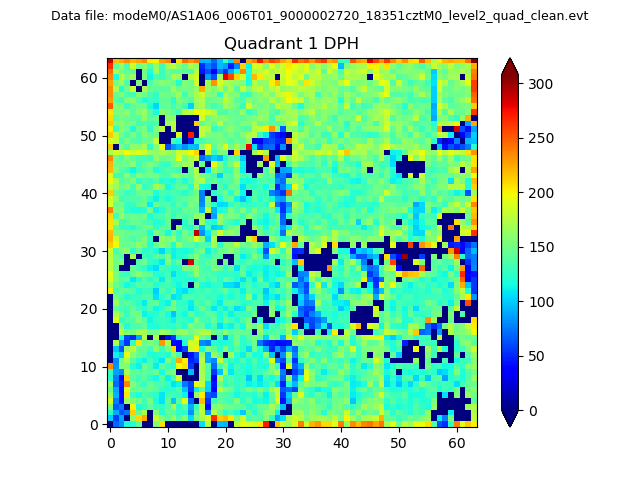
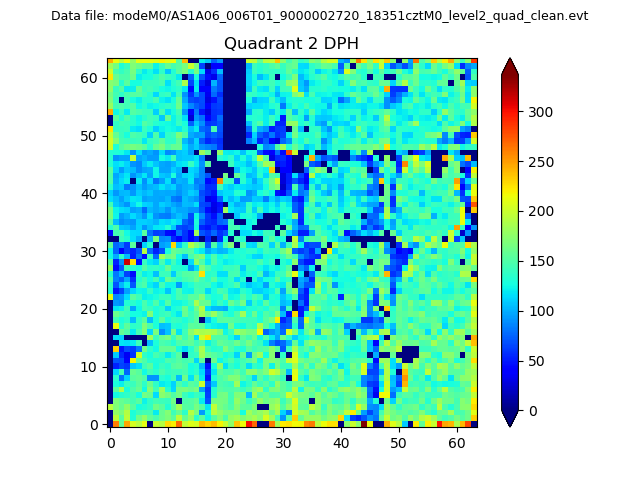
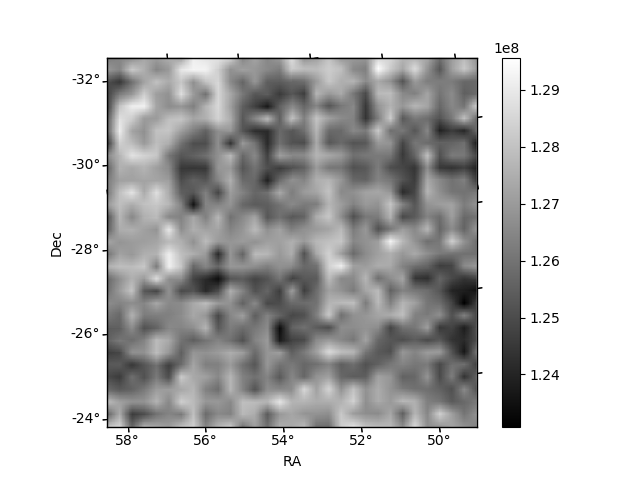
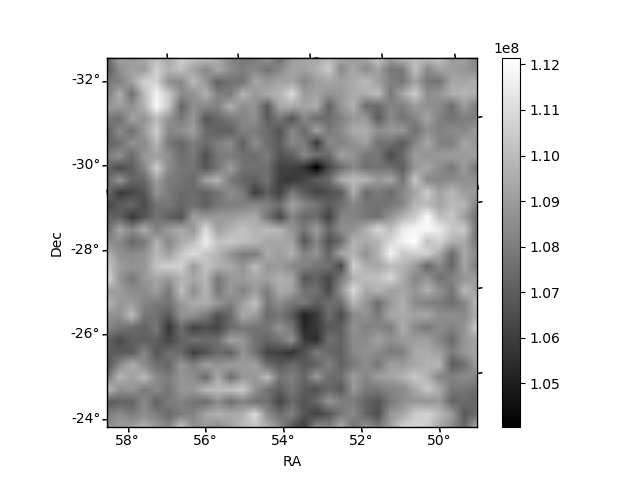
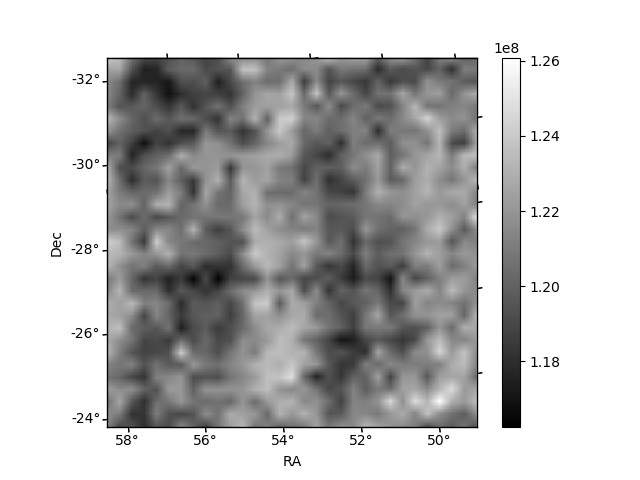
Histogram calculated using DETX and DETY for each event in the final _common_clean file
| Quadrant A |  |
 |
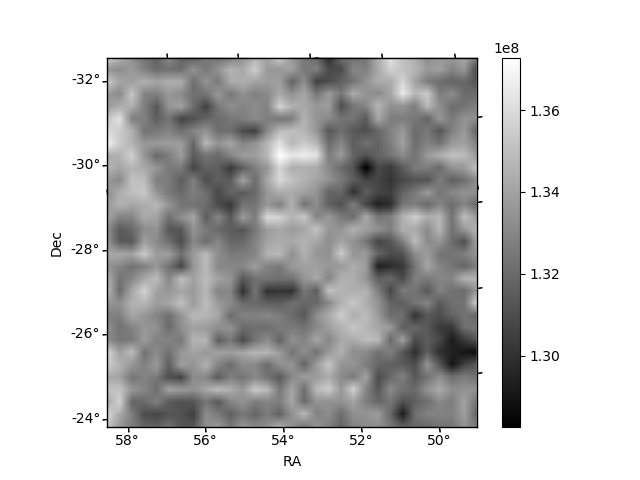
Quadrant B |
|---|---|---|---|
| Quadrant D |  |
 |
Quadrant C |
| Plot type | Count rate plots | Images |
|---|---|---|
| Comparison with Poisson distribution Blue bars denote a histogram of data divided into 1 sec bins. Red curve is a Poisson curve with rate = median count rate of data. |
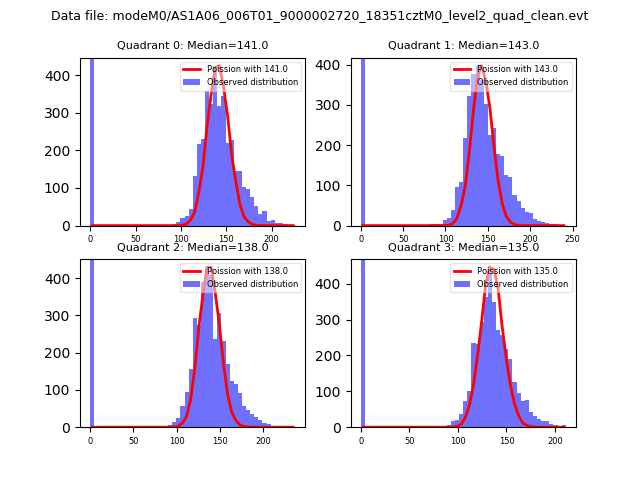 |
 |
| Quadrant-wise count rates Data is divided into 100 sec bins |
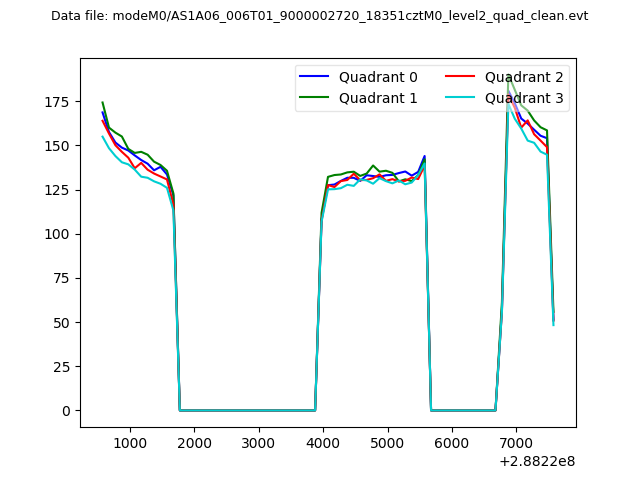 |
|
| Module-wise count rates for Quadrant A Data is divided into 100 sec bins |
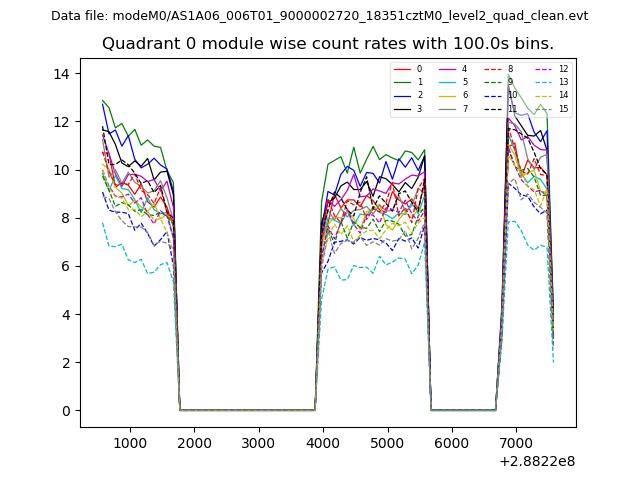 |
 |
| Module-wise count rates for Quadrant B Data is divided into 100 sec bins |
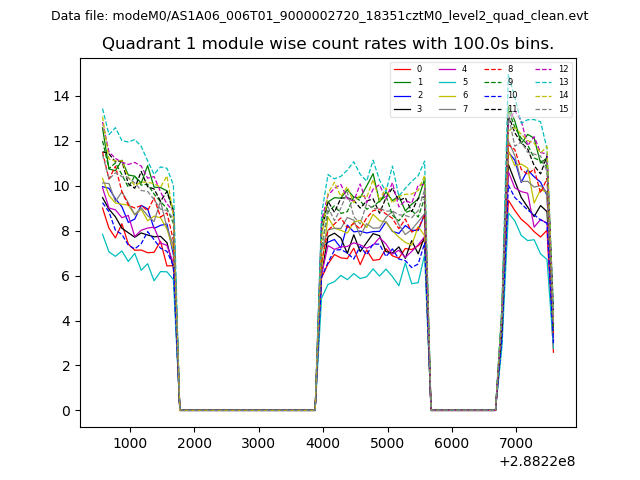 |
 |
| Module-wise count rates for Quadrant C Data is divided into 100 sec bins |
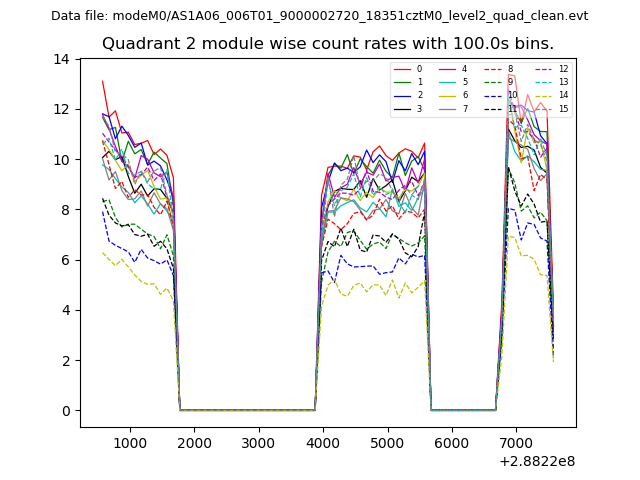 |
 |
| Module-wise count rates for Quadrant D Data is divided into 100 sec bins |
 |
 |
| Parameter | Plot |
|---|---|
| CZT HV Monitor |  |
| D_VDD | 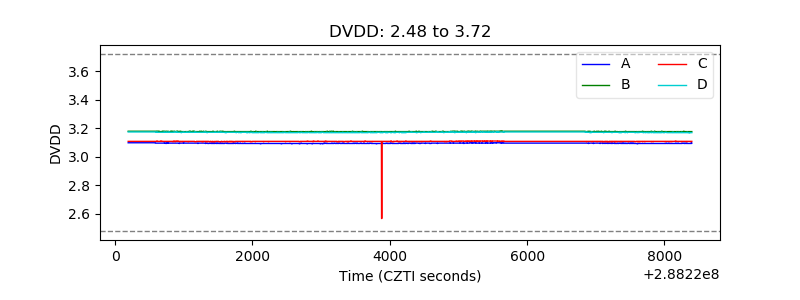 |
| Temperature 1 | 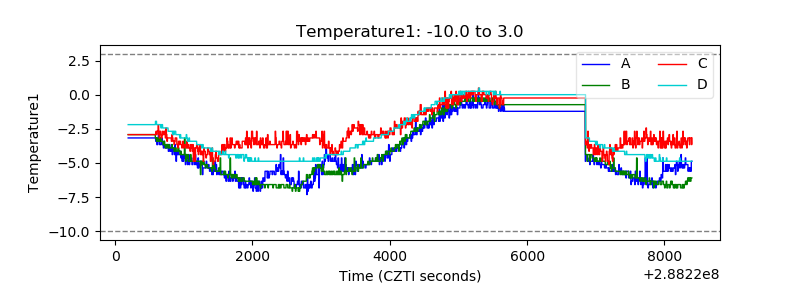 |
| Veto HV Monitor | 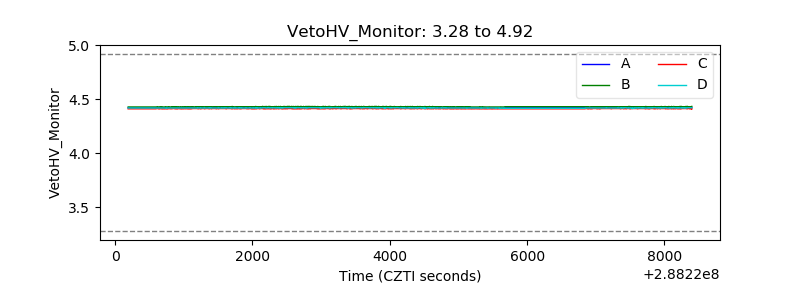 |
| Veto LLD | 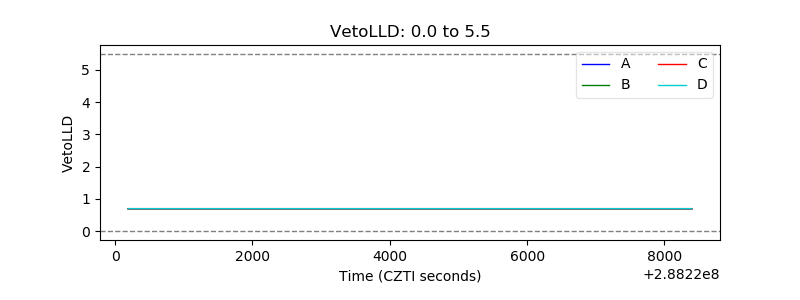 |
| Alpha Counter | 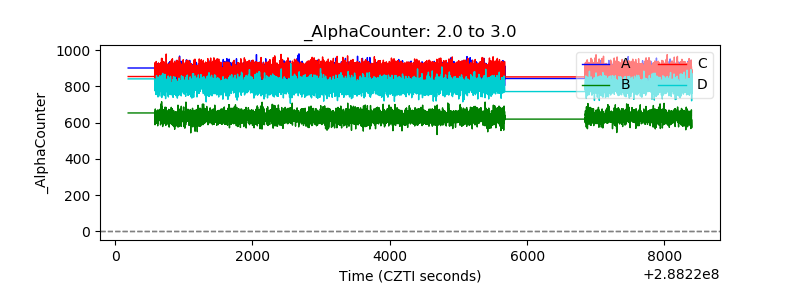 |
| _CPM_Rate | 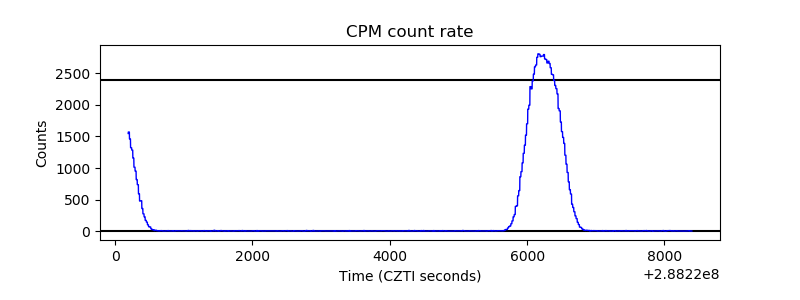 |
| CZT Counter | 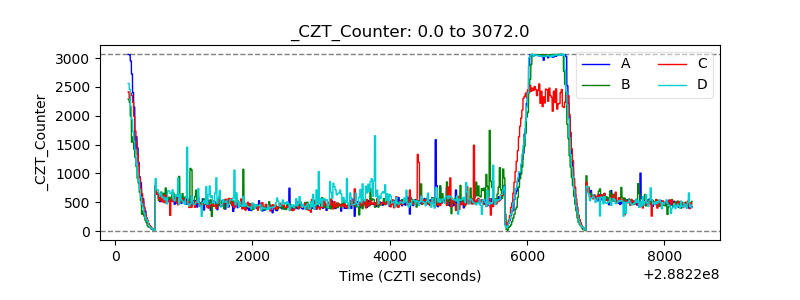 |
| +2.5 Volts monitor |  |
| +5 Volts monitor |  |
| _ROLL_ROT |  |
| _Roll_DEC | 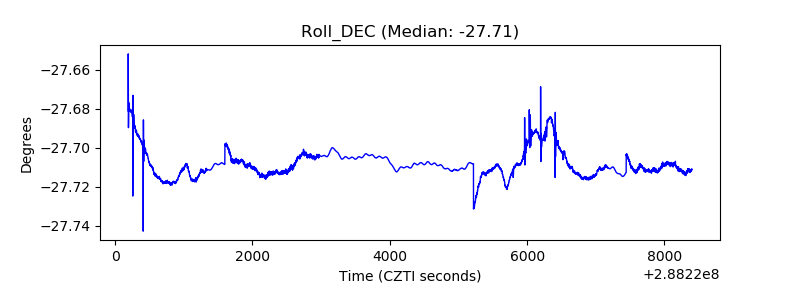 |
| _Roll_RA | 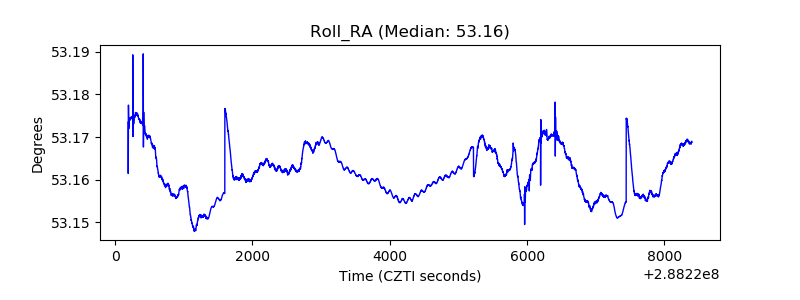 |
| Veto Counter | 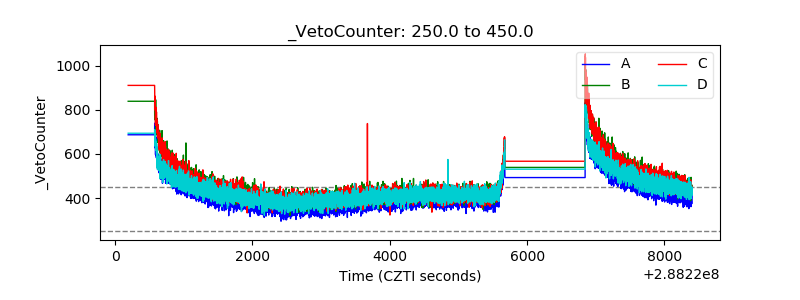 |