| Param | Original file | Final file |
|---|---|---|
| Filename | modeM0/AS1A06_006T01_9000002720_18353cztM0_level2.evt | modeM0/AS1A06_006T01_9000002720_18353cztM0_level2_quad_clean.evt |
| Size (bytes) | 449,536,320 | 56,154,240 |
| Size | 428.7 MB | 53.6 MB |
| Events in quadrant A | 2,975,783 | 327,471 |
| Events in quadrant B | 3,171,615 | 332,237 |
| Events in quadrant C | 3,630,875 | 318,558 |
| Events in quadrant D | 3,440,972 | 315,010 |
| Mode SS | |||
|---|---|---|---|
| Quadrant | BADHDUFLAG | Total packets | Discarded packets |
| A | 0 | 120 | 0 |
| B | 0 | 120 | 0 |
| C | 0 | 120 | 0 |
| D | 0 | 120 | 0 |
| Mode M9 | |||
|---|---|---|---|
| Quadrant | BADHDUFLAG | Total packets | Discarded packets |
| A | 0 | 13 | 0 |
| B | 0 | 13 | 0 |
| C | 0 | 13 | 0 |
| D | 0 | 13 | 0 |
| Mode M0 | |||
|---|---|---|---|
| Quadrant | BADHDUFLAG | Total packets | Discarded packets |
| A | 0 | 12088 | 1 |
| B | 0 | 12740 | 1 |
| C | 0 | 14263 | 1 |
| D | 0 | 13784 | 1 |
| Quadrant | Total seconds | Saturated seconds | Saturation percentage |
|---|---|---|---|
| A | 5812 | 27 | 0.464556% |
| B | 5813 | 40 | 0.688113% |
| C | 5812 | 194 | 3.337922% |
| D | 5812 | 95 | 1.634549% |
Noise dominated data is calculated using 1-second bins in cleaned event files. If a bin has >2000 counts, and if more than 50% of those come from <1% of pixels, then it is considered to be noise-dominated and hence unusable.
| Quadrant | # 1 sec bins | Bins with >0 counts | Bins with >2000 counts | High rate bins dominated by noise | Noise dominated (total time) | Noise dominated (detector-on time) | Marked lightcurve |
|---|---|---|---|---|---|---|---|
| A | 7142 | 5813 | 0 | 0 | 0.00% | 0.00% | 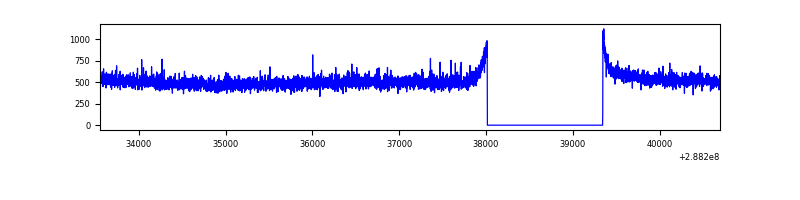 |
| B | 7143 | 5814 | 1 | 1 | 0.01% | 0.02% | 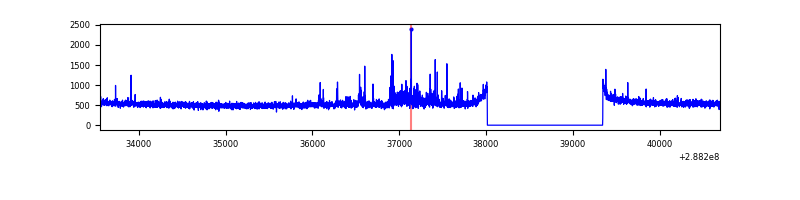 |
| C | 7142 | 5813 | 63 | 63 | 0.88% | 1.08% | 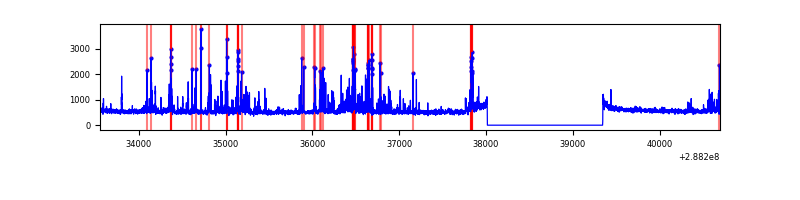 |
| D | 7142 | 5813 | 23 | 23 | 0.32% | 0.40% | 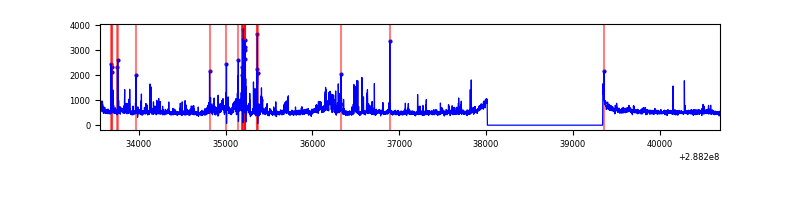 |
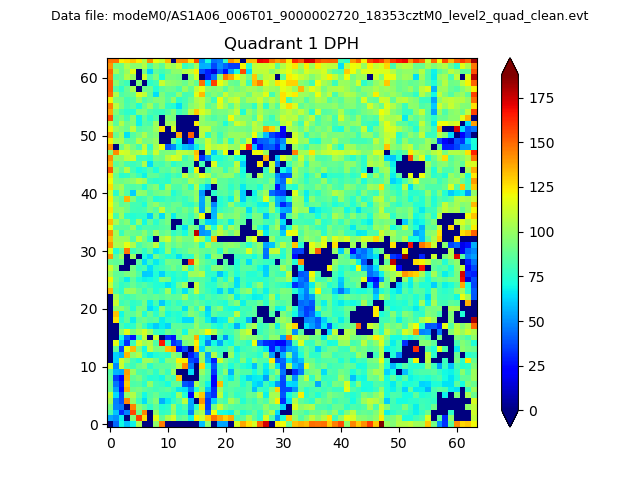
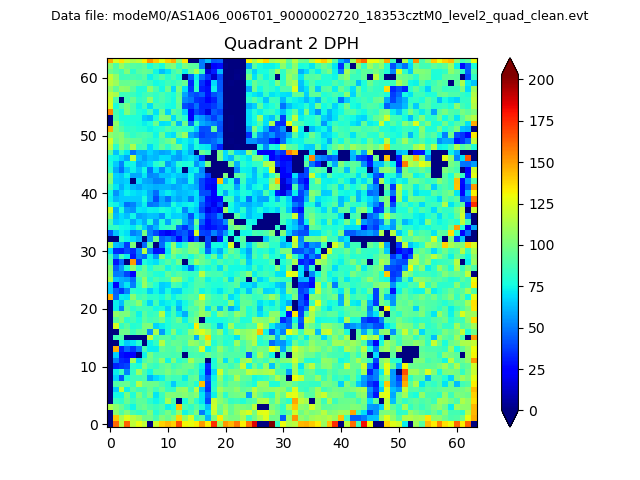
Top three noisy pixels from each quadrant. If the there are fewer than three noisy pixels in the level2.evt file, extra rows are filled as -1
| Pixel properties | Quadrant properties | ||||||
|---|---|---|---|---|---|---|---|
| Quadrant | DetID | PixID | Counts | Sigma | Mean | Median | Sigma |
| A | 0 | 226 | 6850 | 39.18 | 773 | 759 | 155.5 |
| A | 12 | 194 | 5652 | 31.47 | 773 | 759 | 155.5 |
| A | 3 | 137 | 5223 | 28.71 | 773 | 759 | 155.5 |
| B | 7 | 220 | 84510 | 567.91 | 781 | 763 | 147.5 |
| B | 12 | 111 | 16027 | 103.51 | 781 | 763 | 147.5 |
| B | 0 | 198 | 15342 | 98.86 | 781 | 763 | 147.5 |
| C | 4 | 254 | 478410 | 2787.89 | 745 | 754 | 171.3 |
| C | 14 | 238 | 117140 | 679.3 | 745 | 754 | 171.3 |
| C | 0 | 207 | 98350 | 569.63 | 745 | 754 | 171.3 |
| D | 1 | 52 | 488913 | 2691.57 | 751 | 730 | 181.4 |
| D | 11 | 176 | 45599 | 247.38 | 751 | 730 | 181.4 |
| D | 2 | 234 | 25636 | 137.32 | 751 | 730 | 181.4 |
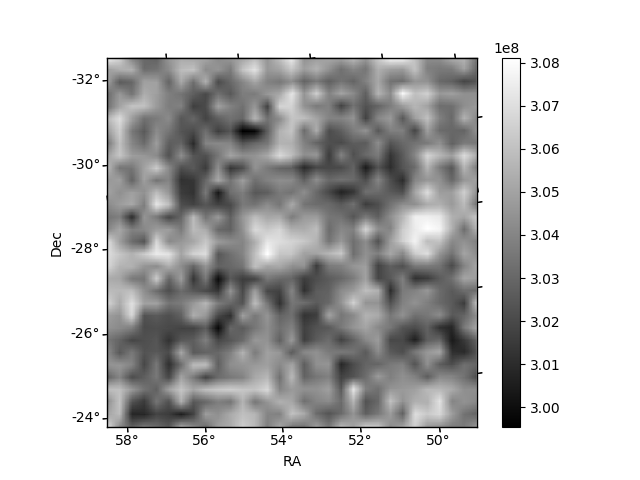
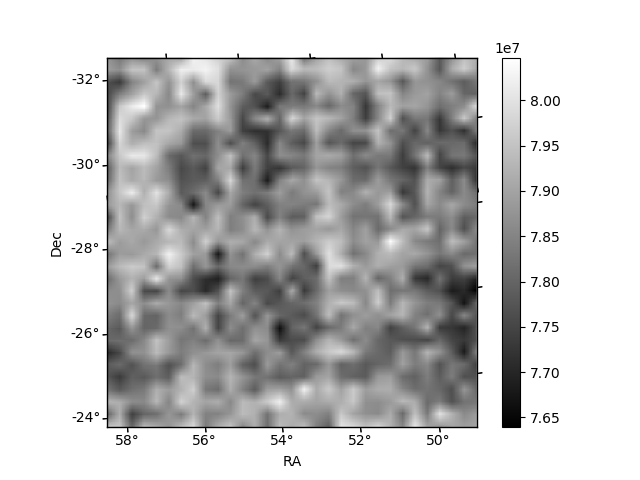
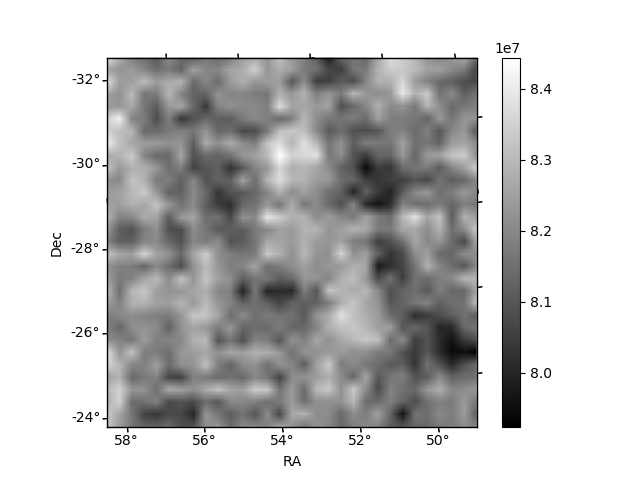
Histogram calculated using DETX and DETY for each event in the final _common_clean file
| Quadrant A | 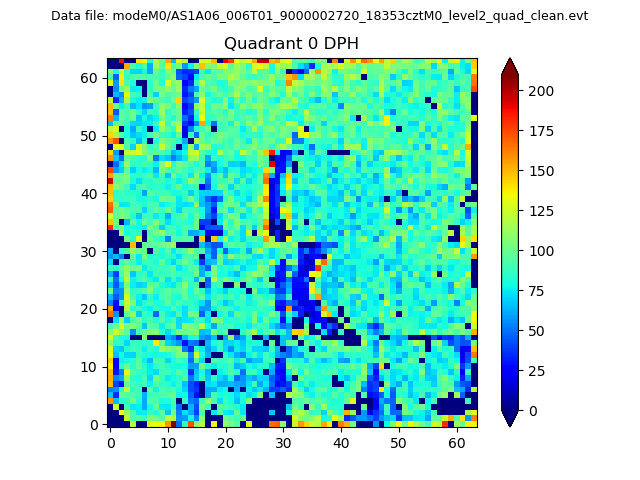 |
 |
Quadrant B |
|---|---|---|---|
| Quadrant D | 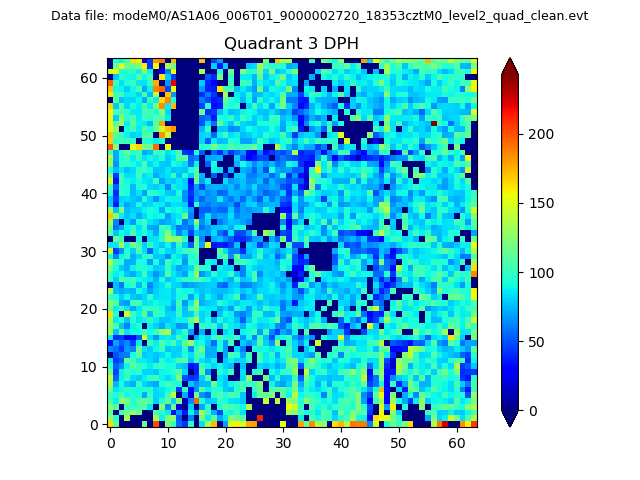 |
 |
Quadrant C |
| Plot type | Count rate plots | Images |
|---|---|---|
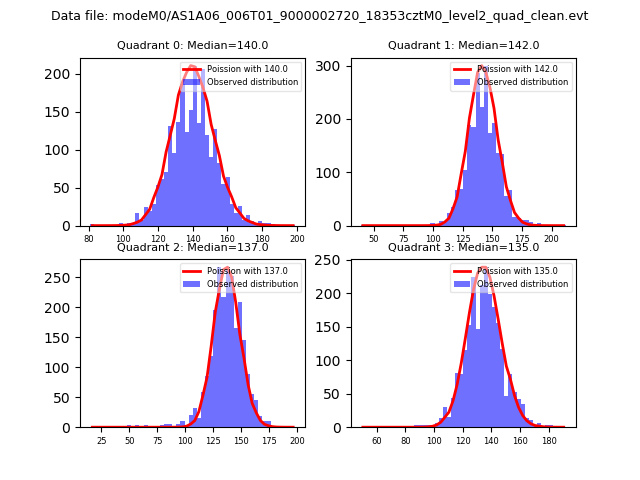
| Comparison with Poisson distribution Blue bars denote a histogram of data divided into 1 sec bins. Red curve is a Poisson curve with rate = median count rate of data. |
 |
 |
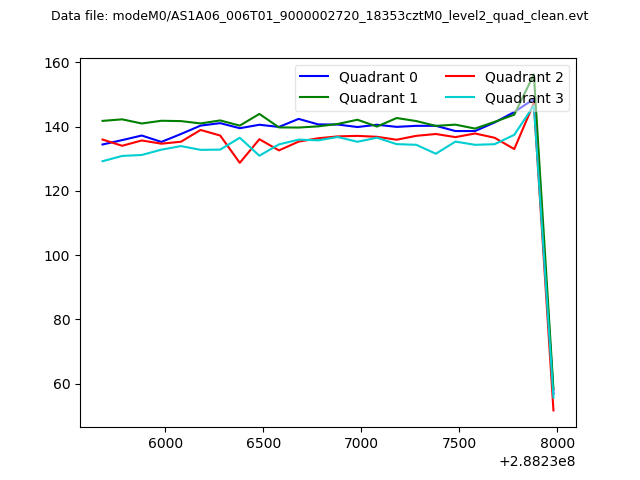
| Quadrant-wise count rates Data is divided into 100 sec bins |
 |
|
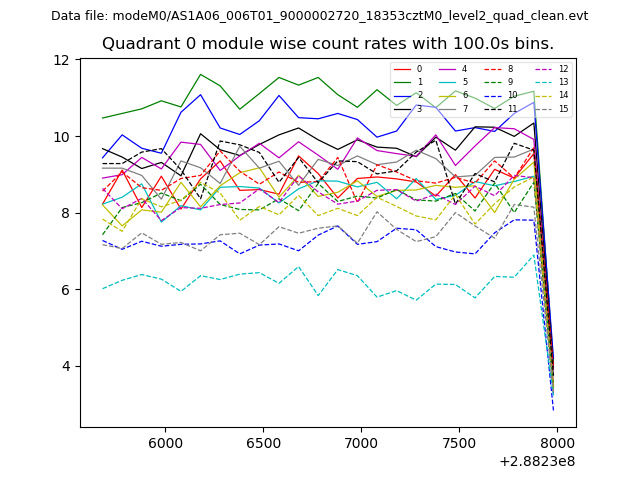
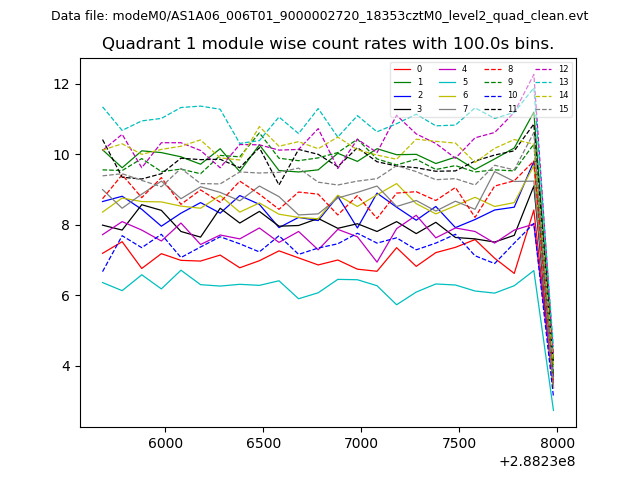
| Module-wise count rates for Quadrant A Data is divided into 100 sec bins |
 |
 |
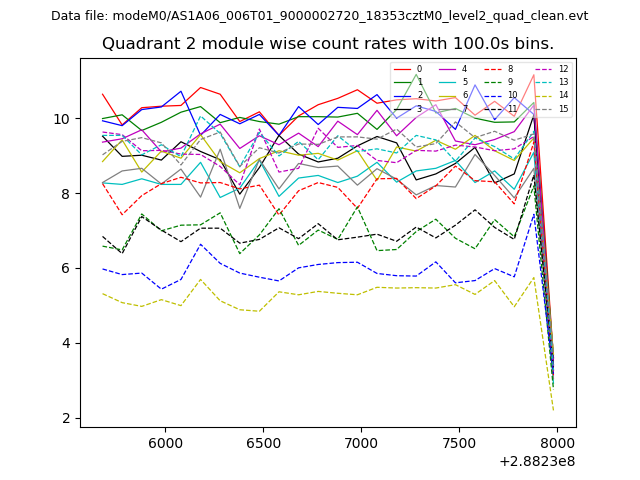
| Module-wise count rates for Quadrant B Data is divided into 100 sec bins |
 |
 |
| Module-wise count rates for Quadrant C Data is divided into 100 sec bins |
 |
 |
| Module-wise count rates for Quadrant D Data is divided into 100 sec bins |
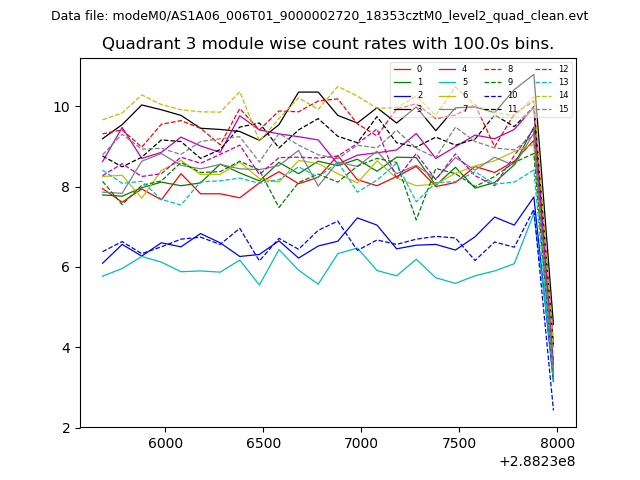 |
 |
| Parameter | Plot |
|---|---|
| CZT HV Monitor | 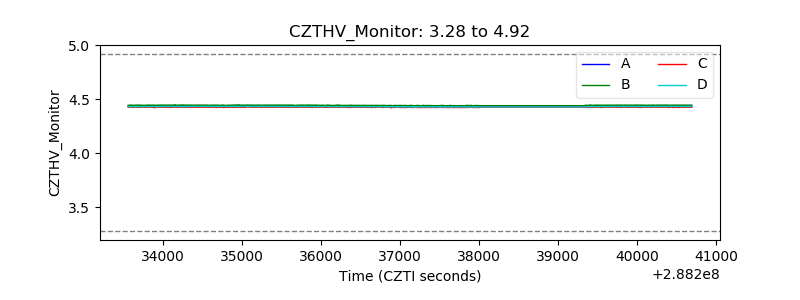 |
| D_VDD | 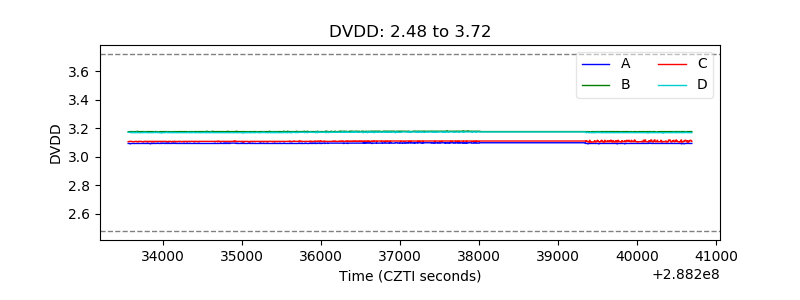 |
| Temperature 1 | 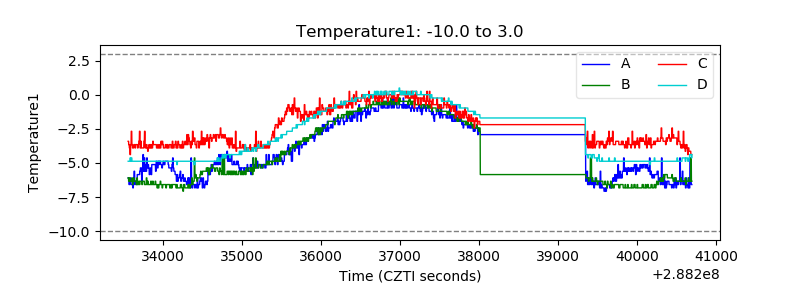 |
| Veto HV Monitor | 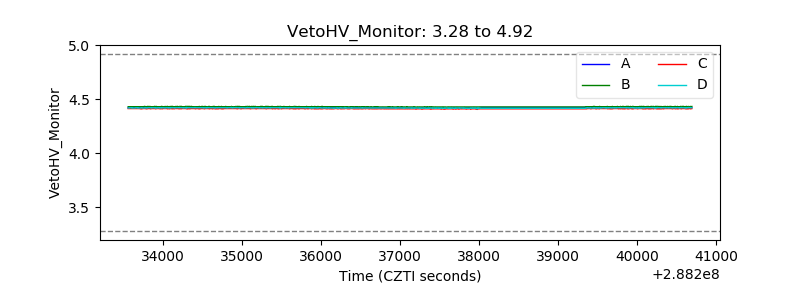 |
| Veto LLD | 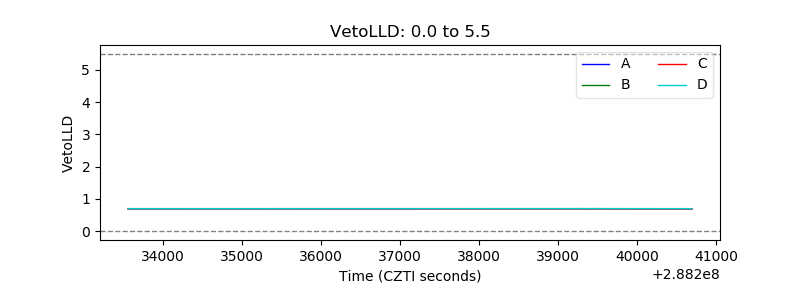 |
| Alpha Counter | 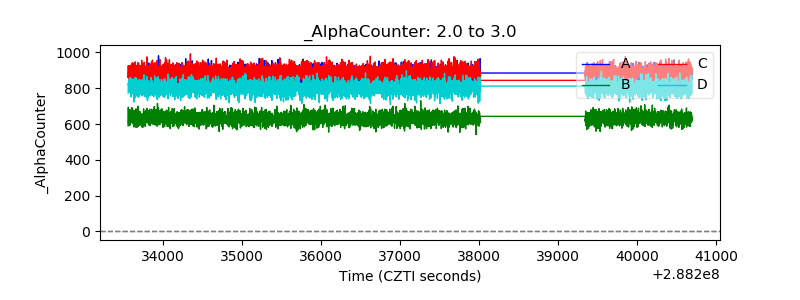 |
| _CPM_Rate | 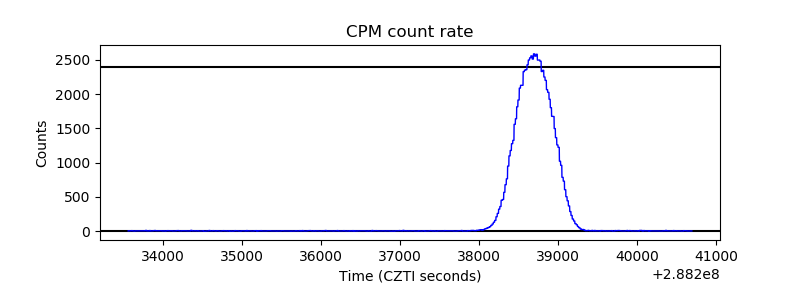 |
| CZT Counter | 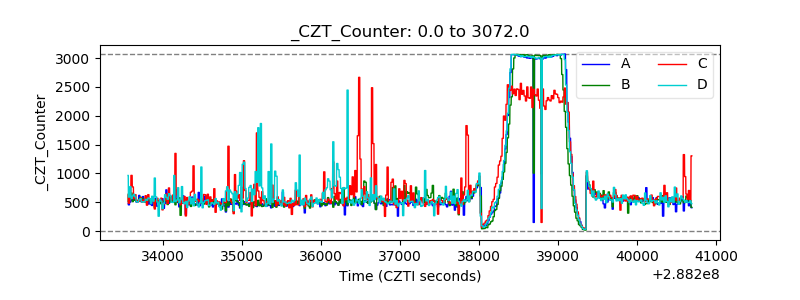 |
| +2.5 Volts monitor |  |
| +5 Volts monitor |  |
| _ROLL_ROT | 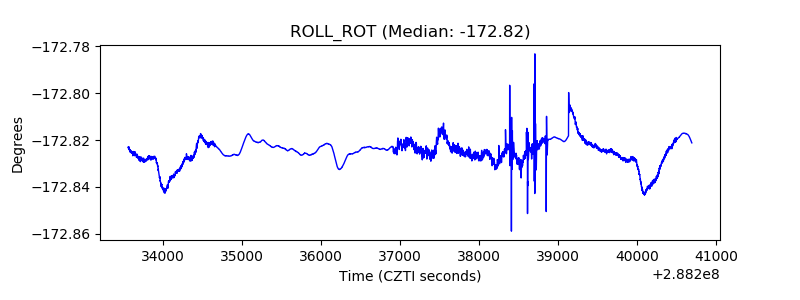 |
| _Roll_DEC | 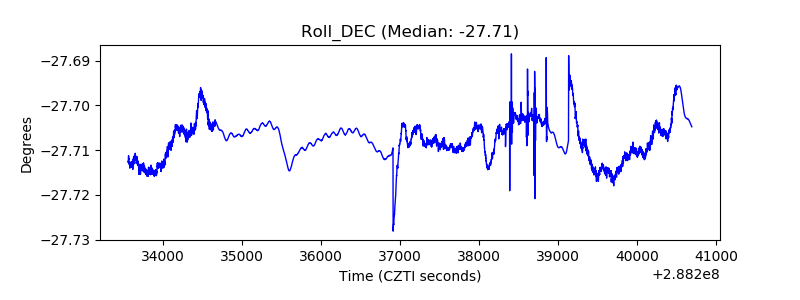 |
| _Roll_RA | 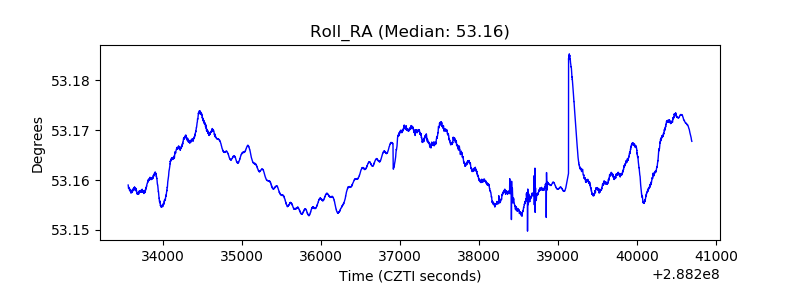 |
| Veto Counter | 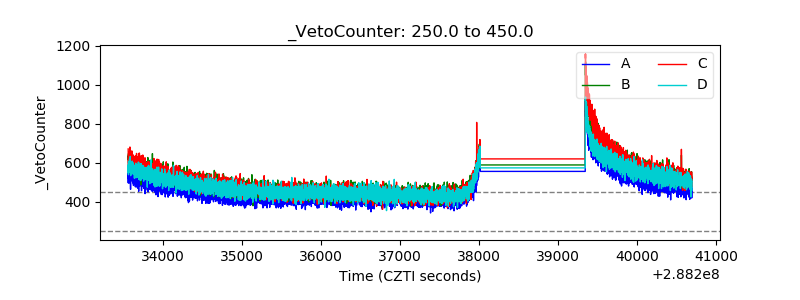 |