| Param | Original file | Final file |
|---|---|---|
| Filename | modeM0/AS1A06_006T01_9000002720_18354cztM0_level2.evt | modeM0/AS1A06_006T01_9000002720_18354cztM0_level2_quad_clean.evt |
| Size (bytes) | 472,230,720 | 64,946,880 |
| Size | 450.4 MB | 61.9 MB |
| Events in quadrant A | 3,175,425 | 389,294 |
| Events in quadrant B | 3,461,569 | 392,391 |
| Events in quadrant C | 3,516,517 | 385,379 |
| Events in quadrant D | 3,735,979 | 375,612 |
| Mode SS | |||
|---|---|---|---|
| Quadrant | BADHDUFLAG | Total packets | Discarded packets |
| A | 0 | 122 | 0 |
| B | 0 | 122 | 0 |
| C | 0 | 122 | 0 |
| D | 0 | 122 | 0 |
| Mode M9 | |||
|---|---|---|---|
| Quadrant | BADHDUFLAG | Total packets | Discarded packets |
| A | 0 | 13 | 0 |
| B | 0 | 13 | 0 |
| C | 0 | 13 | 0 |
| D | 0 | 13 | 0 |
| Mode M0 | |||
|---|---|---|---|
| Quadrant | BADHDUFLAG | Total packets | Discarded packets |
| A | 0 | 12786 | 2 |
| B | 0 | 13717 | 1 |
| C | 0 | 14013 | 1 |
| D | 0 | 14739 | 1 |
| Quadrant | Total seconds | Saturated seconds | Saturation percentage |
|---|---|---|---|
| A | 6072 | 66 | 1.086957% |
| B | 6073 | 131 | 2.157089% |
| C | 6073 | 149 | 2.453483% |
| D | 6073 | 258 | 4.248312% |
Noise dominated data is calculated using 1-second bins in cleaned event files. If a bin has >2000 counts, and if more than 50% of those come from <1% of pixels, then it is considered to be noise-dominated and hence unusable.
| Quadrant | # 1 sec bins | Bins with >0 counts | Bins with >2000 counts | High rate bins dominated by noise | Noise dominated (total time) | Noise dominated (detector-on time) | Marked lightcurve |
|---|---|---|---|---|---|---|---|
| A | 7372 | 6073 | 0 | 0 | 0.00% | 0.00% | 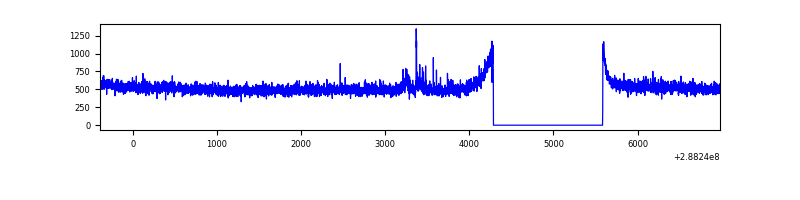 |
| B | 7373 | 6074 | 23 | 23 | 0.31% | 0.38% | 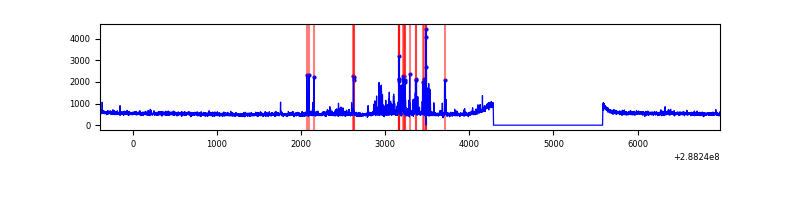 |
| C | 7373 | 6074 | 17 | 17 | 0.23% | 0.28% | 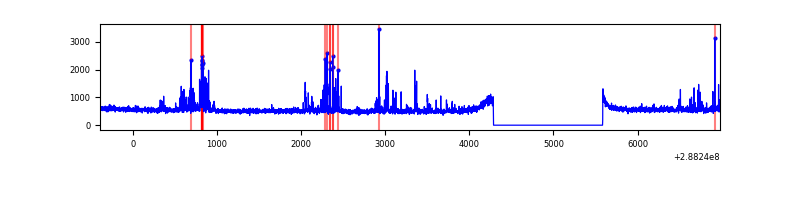 |
| D | 7373 | 6074 | 154 | 154 | 2.09% | 2.54% | 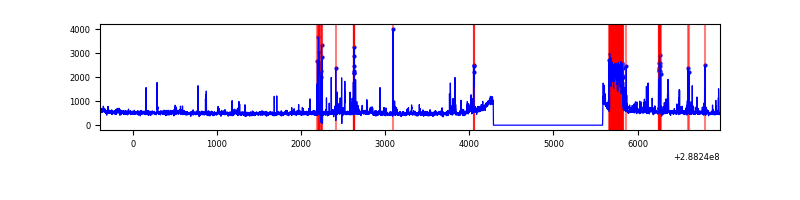 |
Top three noisy pixels from each quadrant. If the there are fewer than three noisy pixels in the level2.evt file, extra rows are filled as -1
| Pixel properties | Quadrant properties | ||||||
|---|---|---|---|---|---|---|---|
| Quadrant | DetID | PixID | Counts | Sigma | Mean | Median | Sigma |
| A | 15 | 174 | 30471 | 181.66 | 817 | 802 | 163.3 |
| A | 0 | 226 | 7090 | 38.5 | 817 | 802 | 163.3 |
| A | 12 | 194 | 5871 | 31.04 | 817 | 802 | 163.3 |
| B | 7 | 220 | 184361 | 1190.55 | 821 | 803 | 154.2 |
| B | 4 | 216 | 31551 | 199.43 | 821 | 803 | 154.2 |
| B | 0 | 244 | 17060 | 105.44 | 821 | 803 | 154.2 |
| C | 4 | 254 | 250901 | 1368.99 | 790 | 799 | 182.7 |
| C | 14 | 238 | 122688 | 667.19 | 790 | 799 | 182.7 |
| C | 0 | 207 | 32818 | 175.26 | 790 | 799 | 182.7 |
| D | 1 | 52 | 603633 | 3166.05 | 791 | 769 | 190.4 |
| D | 7 | 238 | 67729 | 351.65 | 791 | 769 | 190.4 |
| D | 11 | 176 | 30182 | 154.47 | 791 | 769 | 190.4 |
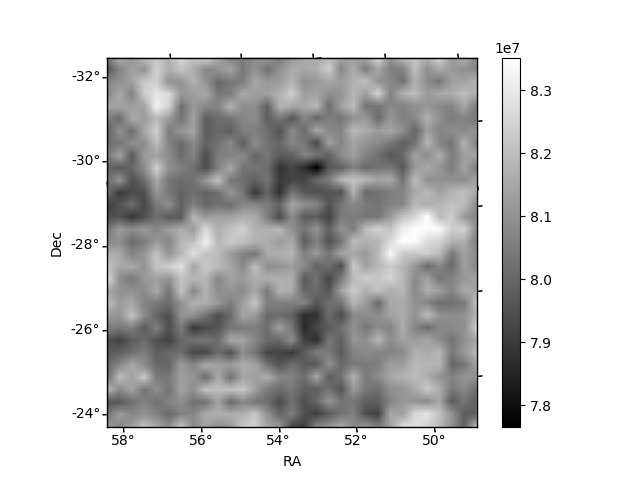
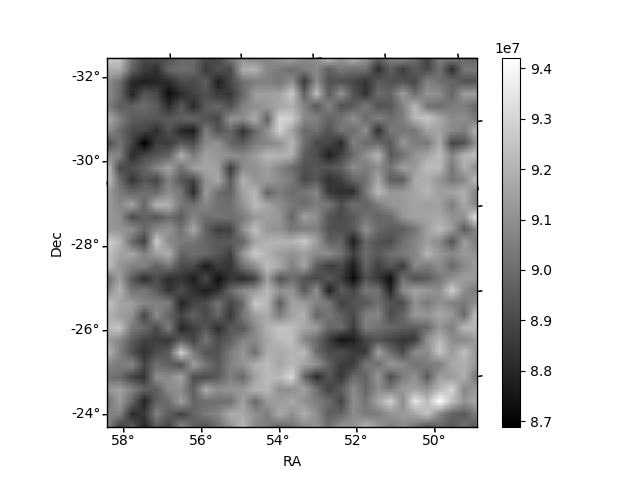
Histogram calculated using DETX and DETY for each event in the final _common_clean file
| Quadrant A | 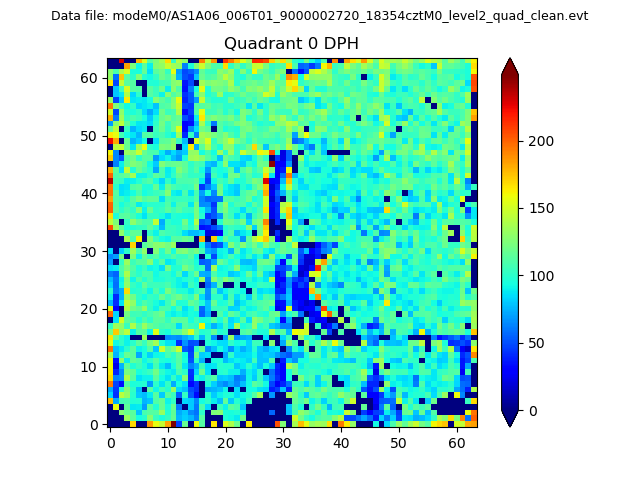 |
 |
Quadrant B |
|---|---|---|---|
| Quadrant D | 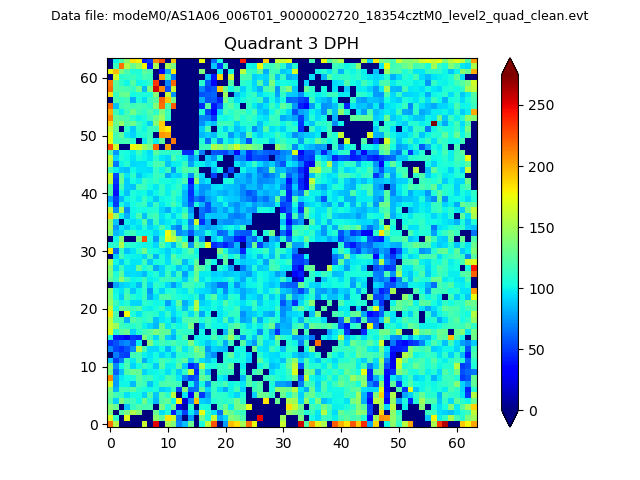 |
 |
Quadrant C |
| Plot type | Count rate plots | Images |
|---|---|---|
| Comparison with Poisson distribution Blue bars denote a histogram of data divided into 1 sec bins. Red curve is a Poisson curve with rate = median count rate of data. |
 |
 |
| Quadrant-wise count rates Data is divided into 100 sec bins |
 |
|
| Module-wise count rates for Quadrant A Data is divided into 100 sec bins |
 |
 |
| Module-wise count rates for Quadrant B Data is divided into 100 sec bins |
 |
 |
| Module-wise count rates for Quadrant C Data is divided into 100 sec bins |
 |
 |
| Module-wise count rates for Quadrant D Data is divided into 100 sec bins |
 |
 |
| Parameter | Plot |
|---|---|
| CZT HV Monitor |  |
| D_VDD | 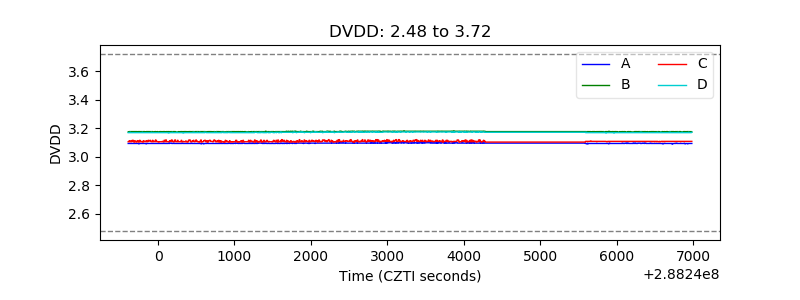 |
| Temperature 1 | 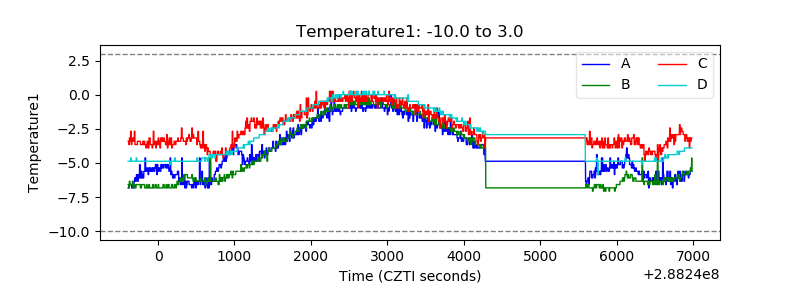 |
| Veto HV Monitor |  |
| Veto LLD |  |
| Alpha Counter |  |
| _CPM_Rate |  |
| CZT Counter |  |
| +2.5 Volts monitor |  |
| +5 Volts monitor |  |
| _ROLL_ROT |  |
| _Roll_DEC |  |
| _Roll_RA |  |
| Veto Counter |  |