| Param | Original file | Final file |
|---|---|---|
| Filename | modeM0/AS1A06_006T01_9000002720_18356cztM0_level2.evt | modeM0/AS1A06_006T01_9000002720_18356cztM0_level2_quad_clean.evt |
| Size (bytes) | 534,813,120 | 84,769,920 |
| Size | 510.0 MB | 80.8 MB |
| Events in quadrant A | 3,359,404 | 534,175 |
| Events in quadrant B | 4,102,910 | 528,864 |
| Events in quadrant C | 3,955,016 | 523,158 |
| Events in quadrant D | 4,320,251 | 508,831 |
| Mode SS | |||
|---|---|---|---|
| Quadrant | BADHDUFLAG | Total packets | Discarded packets |
| A | 0 | 138 | 0 |
| B | 0 | 138 | 0 |
| C | 0 | 138 | 0 |
| D | 0 | 138 | 0 |
| Mode M9 | |||
|---|---|---|---|
| Quadrant | BADHDUFLAG | Total packets | Discarded packets |
| A | 0 | 16 | 0 |
| B | 0 | 17 | 0 |
| C | 0 | 17 | 0 |
| D | 0 | 17 | 0 |
| Mode M0 | |||
|---|---|---|---|
| Quadrant | BADHDUFLAG | Total packets | Discarded packets |
| A | 0 | 14072 | 2 |
| B | 0 | 16155 | 3 |
| C | 0 | 15865 | 2 |
| D | 0 | 17185 | 2 |
| Quadrant | Total seconds | Saturated seconds | Saturation percentage |
|---|---|---|---|
| A | 6772 | 98 | 1.447135% |
| B | 6771 | 243 | 3.588835% |
| C | 6771 | 258 | 3.810368% |
| D | 6771 | 157 | 2.318712% |
Noise dominated data is calculated using 1-second bins in cleaned event files. If a bin has >2000 counts, and if more than 50% of those come from <1% of pixels, then it is considered to be noise-dominated and hence unusable.
| Quadrant | # 1 sec bins | Bins with >0 counts | Bins with >2000 counts | High rate bins dominated by noise | Noise dominated (total time) | Noise dominated (detector-on time) | Marked lightcurve |
|---|---|---|---|---|---|---|---|
| A | 7677 | 6773 | 3 | 3 | 0.04% | 0.04% | 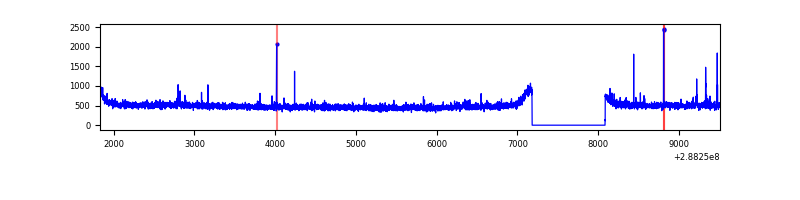 |
| B | 7676 | 6772 | 110 | 110 | 1.43% | 1.62% | 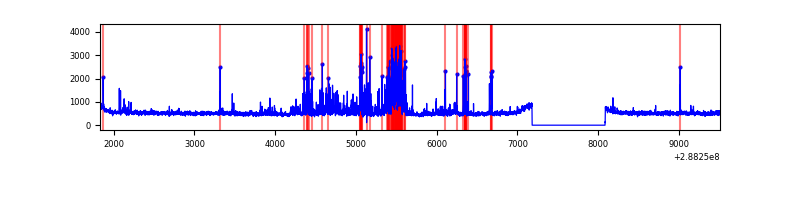 |
| C | 7676 | 6772 | 66 | 66 | 0.86% | 0.97% | 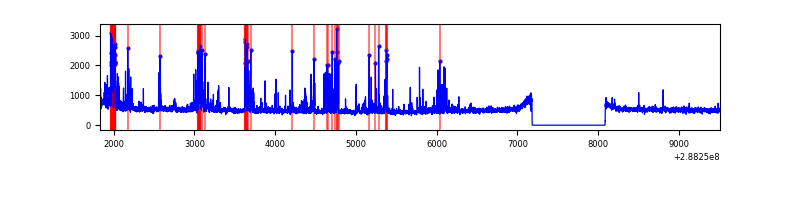 |
| D | 7676 | 6772 | 88 | 88 | 1.15% | 1.30% | 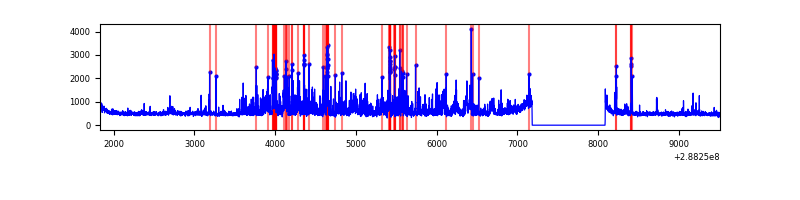 |
Top three noisy pixels from each quadrant. If the there are fewer than three noisy pixels in the level2.evt file, extra rows are filled as -1
| Pixel properties | Quadrant properties | ||||||
|---|---|---|---|---|---|---|---|
| Quadrant | DetID | PixID | Counts | Sigma | Mean | Median | Sigma |
| A | 6 | 16 | 26623 | 147.45 | 861 | 843 | 174.8 |
| A | 4 | 2 | 15308 | 82.73 | 861 | 843 | 174.8 |
| A | 0 | 226 | 7416 | 37.59 | 861 | 843 | 174.8 |
| B | 3 | 64 | 460607 | 2807.03 | 855 | 835 | 163.8 |
| B | 7 | 220 | 209109 | 1271.57 | 855 | 835 | 163.8 |
| B | 0 | 189 | 28194 | 167.03 | 855 | 835 | 163.8 |
| C | 4 | 254 | 597731 | 3128.04 | 820 | 826 | 190.8 |
| C | 14 | 238 | 127262 | 662.58 | 820 | 826 | 190.8 |
| C | 0 | 207 | 20100 | 101.0 | 820 | 826 | 190.8 |
| D | 14 | 34 | 820058 | 4001.33 | 835 | 810 | 204.7 |
| D | 1 | 52 | 228050 | 1109.87 | 835 | 810 | 204.7 |
| D | 7 | 96 | 54348 | 261.49 | 835 | 810 | 204.7 |
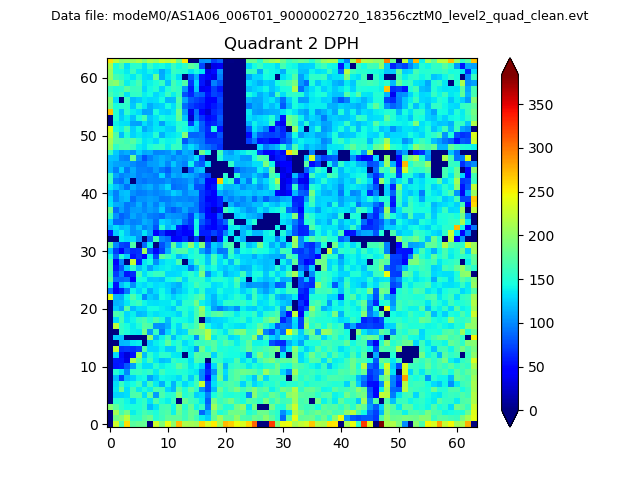
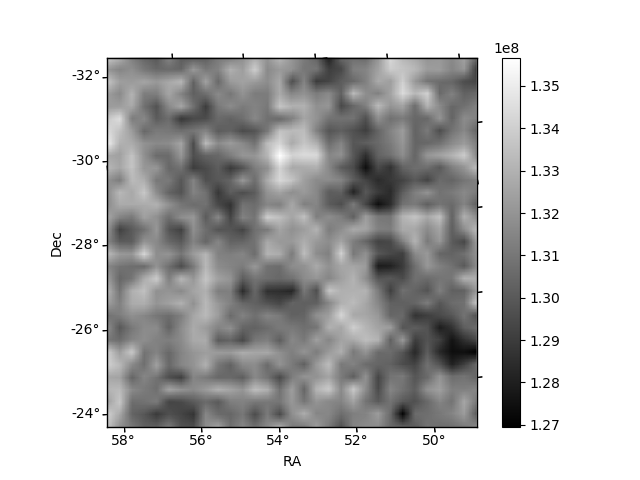
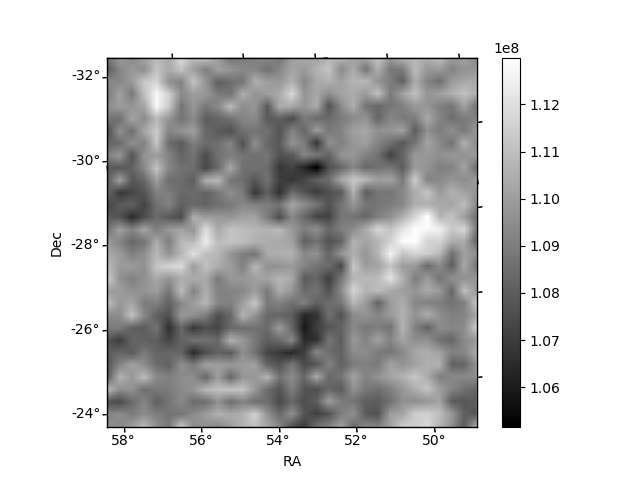
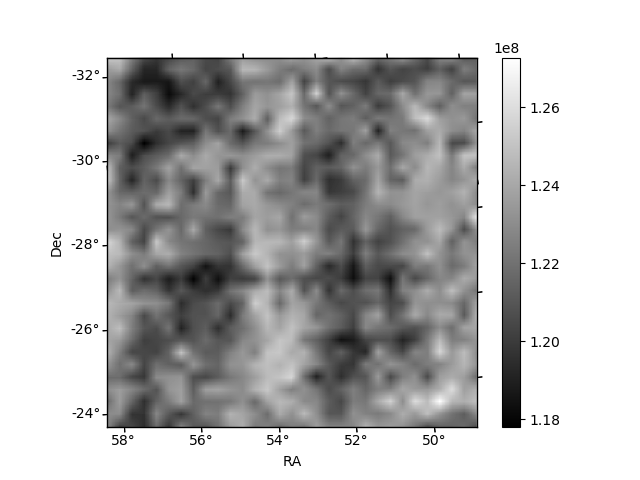
Histogram calculated using DETX and DETY for each event in the final _common_clean file
| Quadrant A | 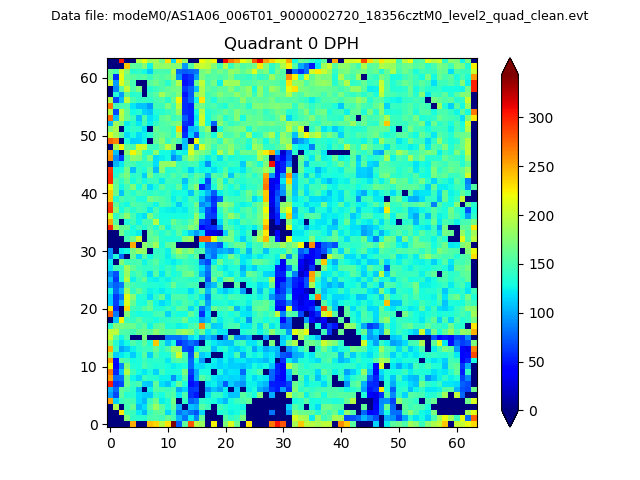 |
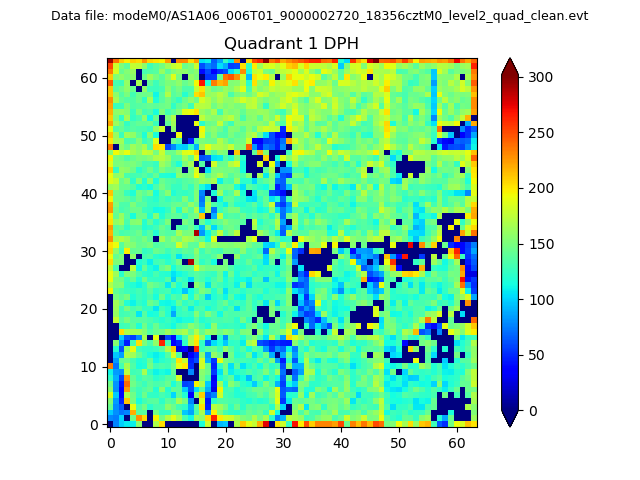 |
Quadrant B |
|---|---|---|---|
| Quadrant D | 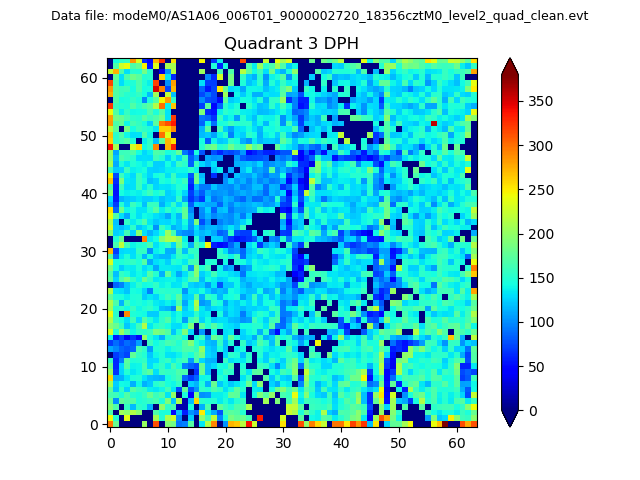 |
 |
Quadrant C |
| Plot type | Count rate plots | Images |
|---|---|---|
| Comparison with Poisson distribution Blue bars denote a histogram of data divided into 1 sec bins. Red curve is a Poisson curve with rate = median count rate of data. |
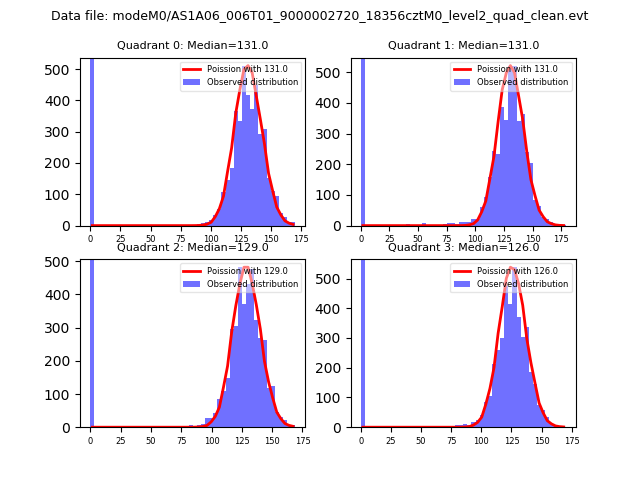 |
 |
| Quadrant-wise count rates Data is divided into 100 sec bins |
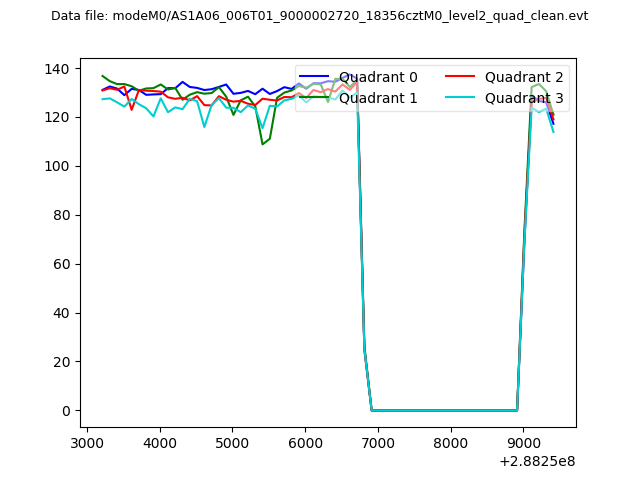 |
|
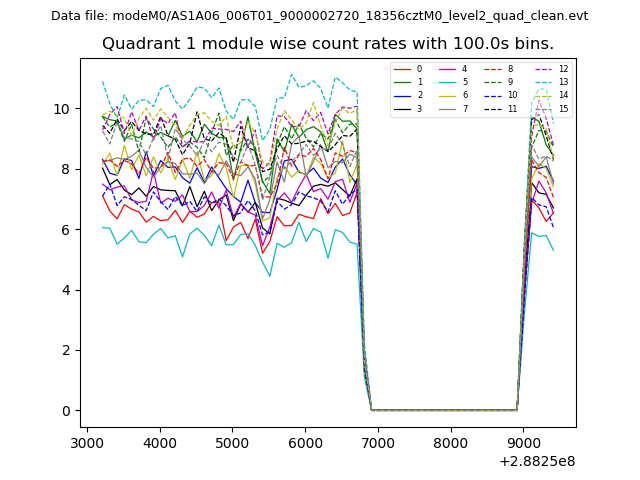
| Module-wise count rates for Quadrant A Data is divided into 100 sec bins |
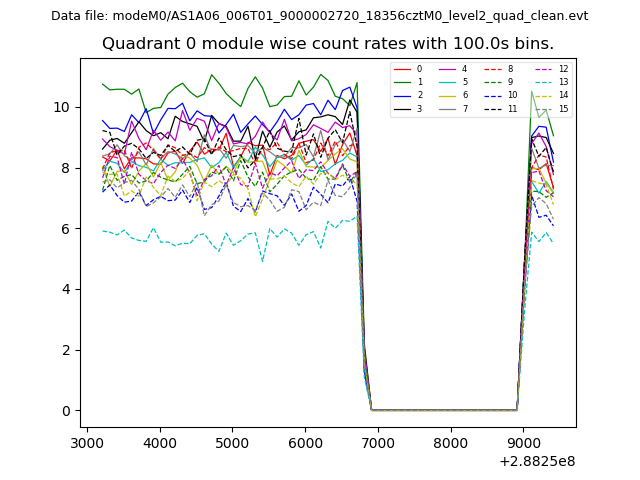 |
 |
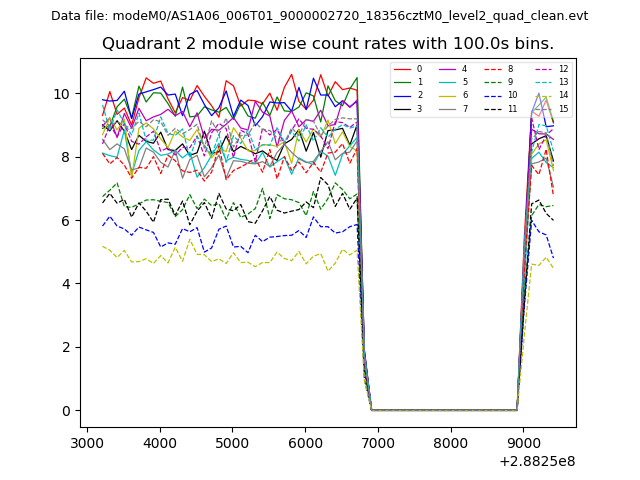
| Module-wise count rates for Quadrant B Data is divided into 100 sec bins |
 |
 |
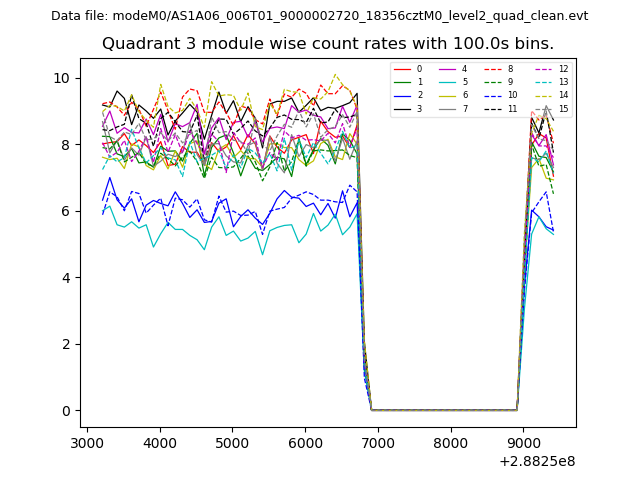
| Module-wise count rates for Quadrant C Data is divided into 100 sec bins |
 |
 |
| Module-wise count rates for Quadrant D Data is divided into 100 sec bins |
 |
 |
| Parameter | Plot |
|---|---|
| CZT HV Monitor | 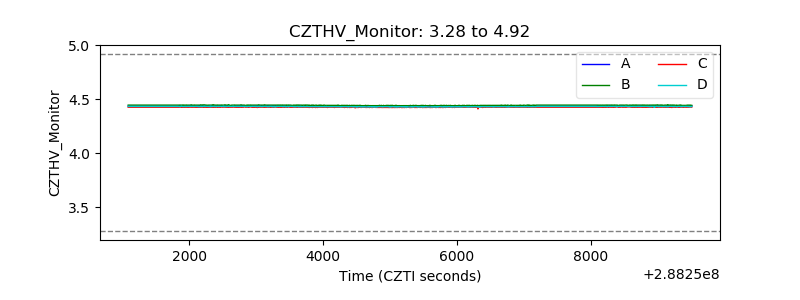 |
| D_VDD | 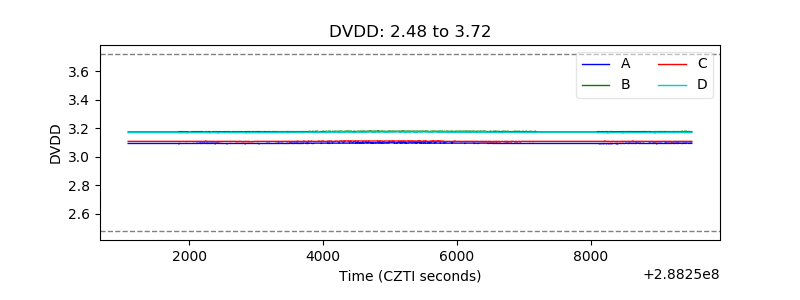 |
| Temperature 1 | 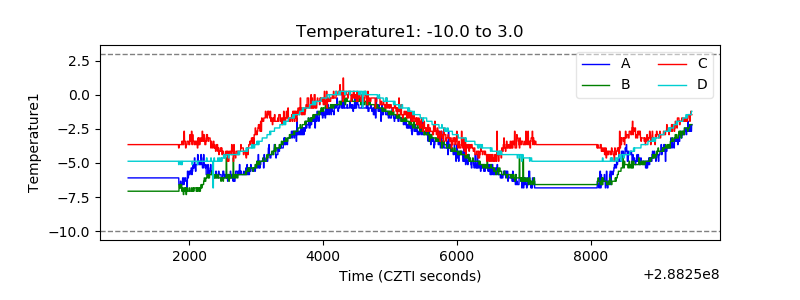 |
| Veto HV Monitor | 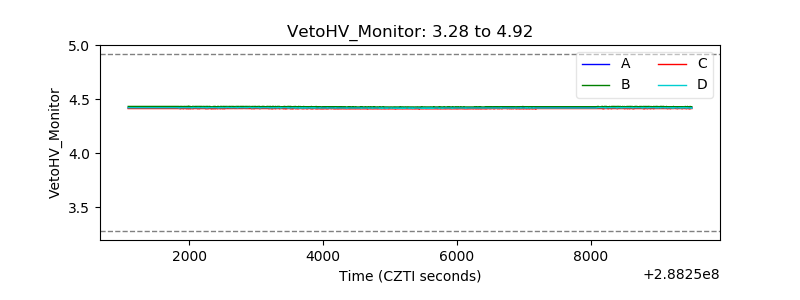 |
| Veto LLD | 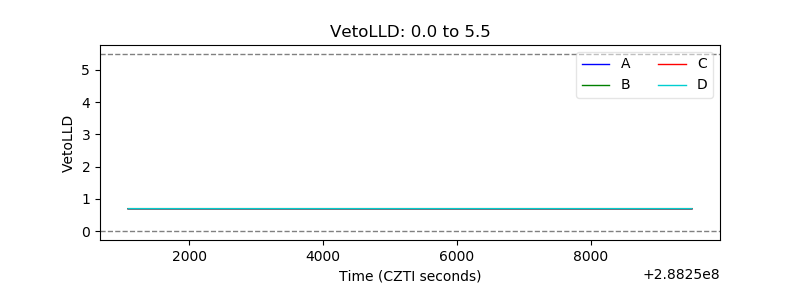 |
| Alpha Counter |  |
| _CPM_Rate | 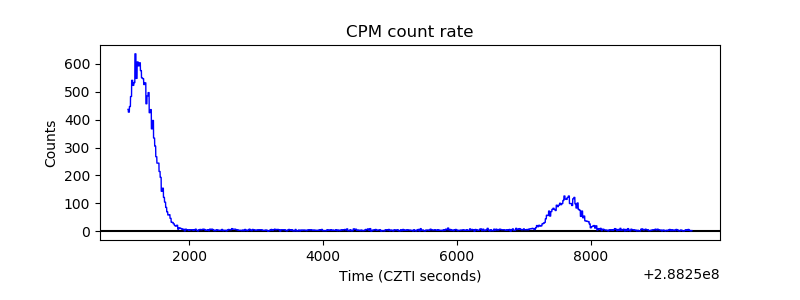 |
| CZT Counter | 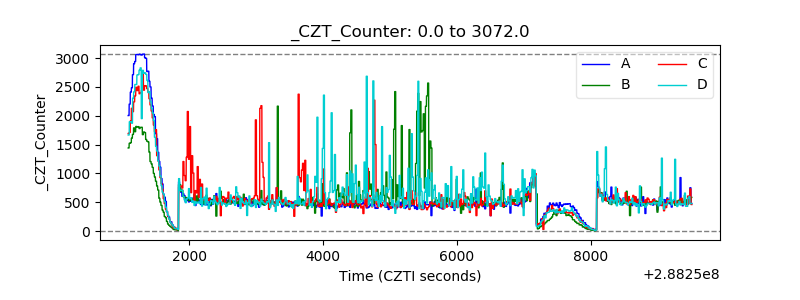 |
| +2.5 Volts monitor | 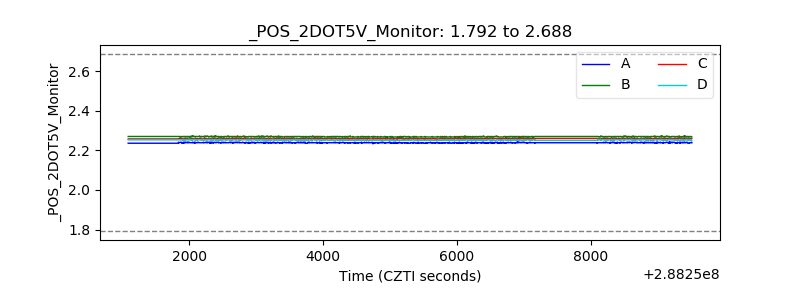 |
| +5 Volts monitor | 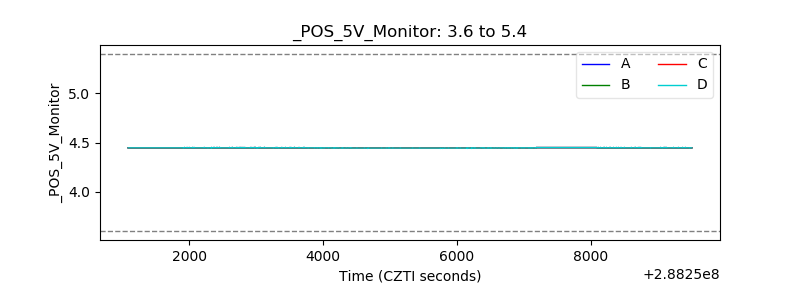 |
| _ROLL_ROT | 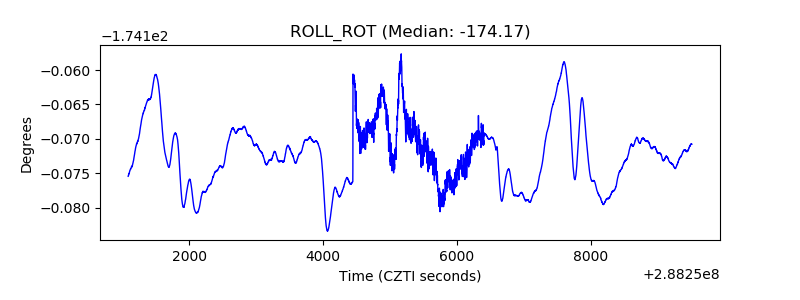 |
| _Roll_DEC | 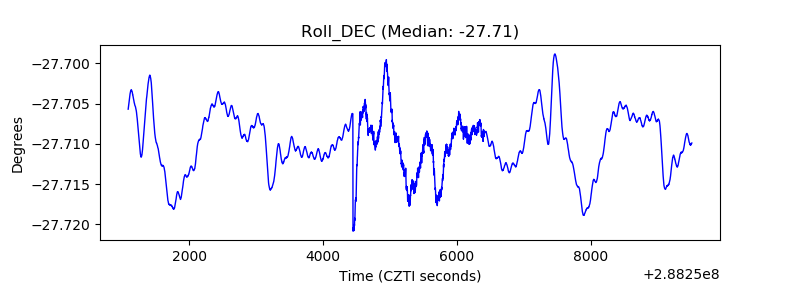 |
| _Roll_RA | 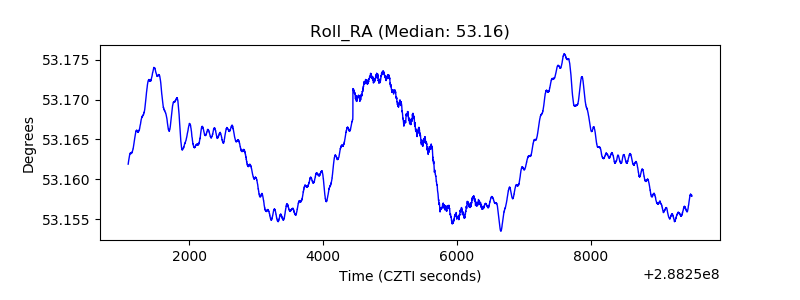 |
| Veto Counter | 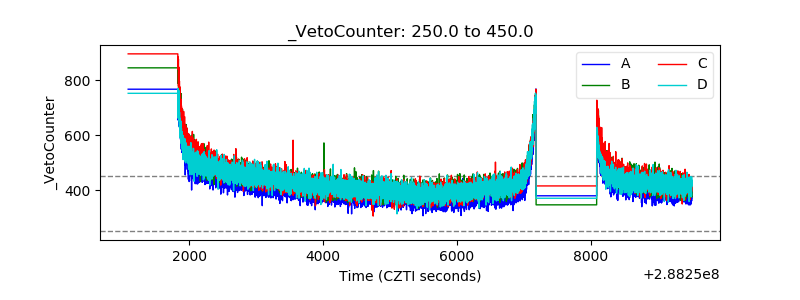 |