| Param | Original file | Final file |
|---|---|---|
| Filename | modeM0/AS1A06_006T01_9000002720_18357cztM0_level2.evt | modeM0/AS1A06_006T01_9000002720_18357cztM0_level2_quad_clean.evt |
| Size (bytes) | 566,040,960 | 88,439,040 |
| Size | 539.8 MB | 84.3 MB |
| Events in quadrant A | 3,399,505 | 563,662 |
| Events in quadrant B | 3,824,345 | 565,766 |
| Events in quadrant C | 3,780,563 | 552,060 |
| Events in quadrant D | 5,665,602 | 511,392 |
| Mode SS | |||
|---|---|---|---|
| Quadrant | BADHDUFLAG | Total packets | Discarded packets |
| A | 0 | 142 | 0 |
| B | 0 | 142 | 0 |
| C | 0 | 142 | 0 |
| D | 0 | 142 | 0 |
| Mode M9 | |||
|---|---|---|---|
| Quadrant | BADHDUFLAG | Total packets | Discarded packets |
| A | 0 | 4 | 0 |
| B | 0 | 4 | 0 |
| C | 0 | 4 | 0 |
| D | 0 | 4 | 0 |
| Mode M0 | |||
|---|---|---|---|
| Quadrant | BADHDUFLAG | Total packets | Discarded packets |
| A | 0 | 14546 | 1 |
| B | 0 | 15579 | 1 |
| C | 0 | 15403 | 1 |
| D | 0 | 21529 | 1 |
| Quadrant | Total seconds | Saturated seconds | Saturation percentage |
|---|---|---|---|
| A | 6959 | 176 | 2.529099% |
| B | 6960 | 230 | 3.304598% |
| C | 6960 | 246 | 3.534483% |
| D | 6959 | 1070 | 15.375772% |
Noise dominated data is calculated using 1-second bins in cleaned event files. If a bin has >2000 counts, and if more than 50% of those come from <1% of pixels, then it is considered to be noise-dominated and hence unusable.
| Quadrant | # 1 sec bins | Bins with >0 counts | Bins with >2000 counts | High rate bins dominated by noise | Noise dominated (total time) | Noise dominated (detector-on time) | Marked lightcurve |
|---|---|---|---|---|---|---|---|
| A | 7369 | 6960 | 2 | 2 | 0.03% | 0.03% | 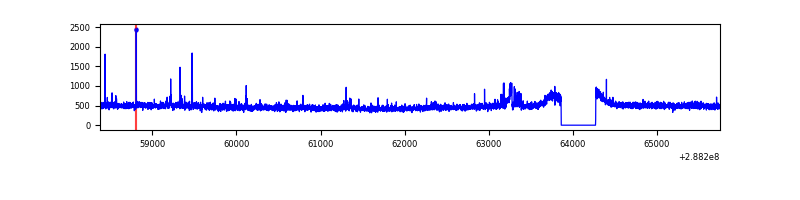 |
| B | 7370 | 6961 | 23 | 23 | 0.31% | 0.33% | 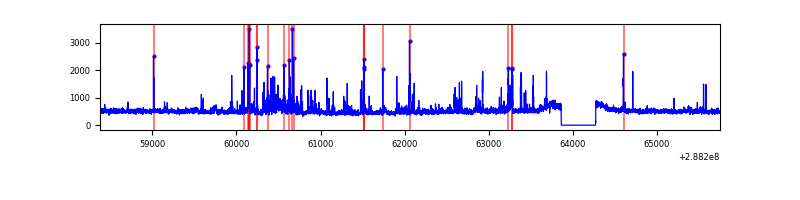 |
| C | 7370 | 6961 | 29 | 29 | 0.39% | 0.42% | 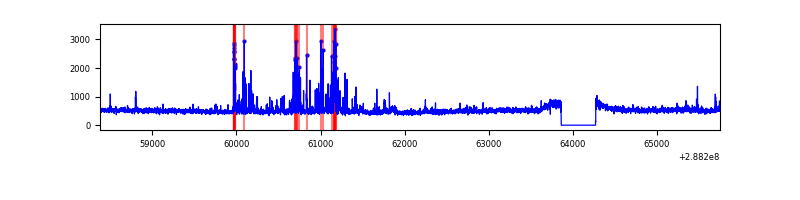 |
| D | 7369 | 6960 | 827 | 827 | 11.22% | 11.88% | 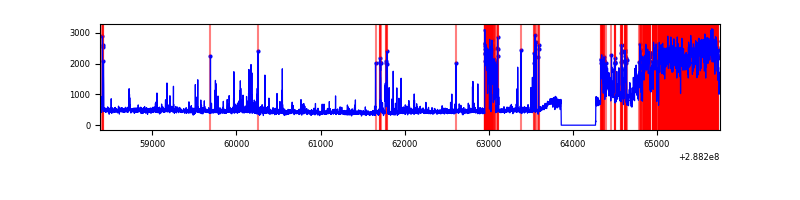 |
Top three noisy pixels from each quadrant. If the there are fewer than three noisy pixels in the level2.evt file, extra rows are filled as -1
| Pixel properties | Quadrant properties | ||||||
|---|---|---|---|---|---|---|---|
| Quadrant | DetID | PixID | Counts | Sigma | Mean | Median | Sigma |
| A | 15 | 174 | 47969 | 266.59 | 863 | 842 | 176.8 |
| A | 4 | 2 | 21433 | 116.48 | 863 | 842 | 176.8 |
| A | 6 | 16 | 12843 | 67.89 | 863 | 842 | 176.8 |
| B | 7 | 220 | 221915 | 1324.71 | 861 | 840 | 166.9 |
| B | 3 | 64 | 114671 | 682.09 | 861 | 840 | 166.9 |
| B | 0 | 189 | 31392 | 183.07 | 861 | 840 | 166.9 |
| C | 0 | 207 | 188521 | 969.65 | 827 | 832 | 193.6 |
| C | 4 | 254 | 170852 | 878.37 | 827 | 832 | 193.6 |
| C | 14 | 238 | 123658 | 634.55 | 827 | 832 | 193.6 |
| D | 12 | 110 | 2204604 | 11056.41 | 810 | 786 | 199.3 |
| D | 1 | 52 | 264225 | 1321.66 | 810 | 786 | 199.3 |
| D | 14 | 34 | 49321 | 243.5 | 810 | 786 | 199.3 |
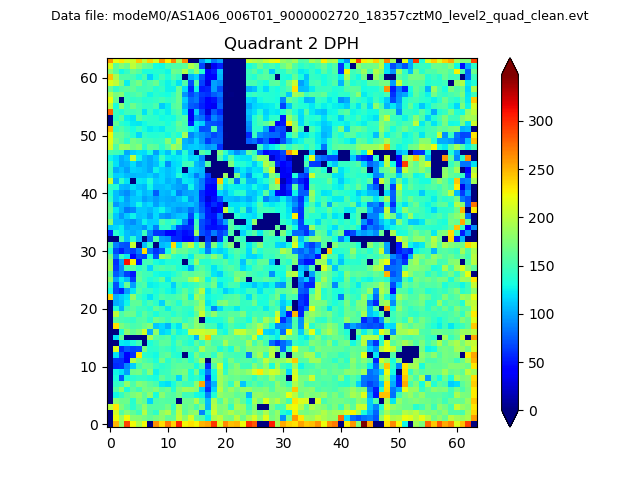
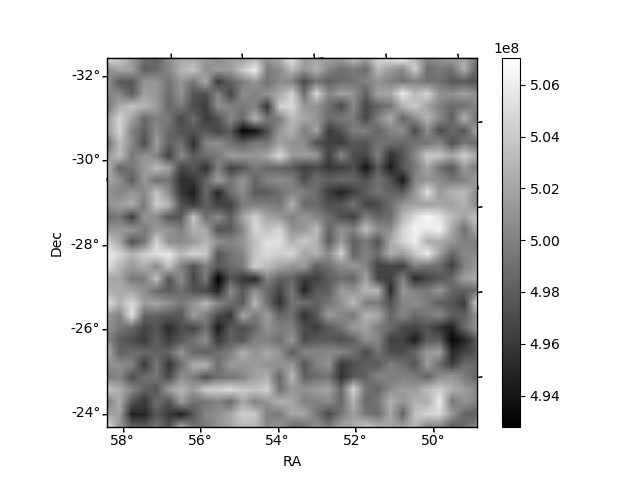
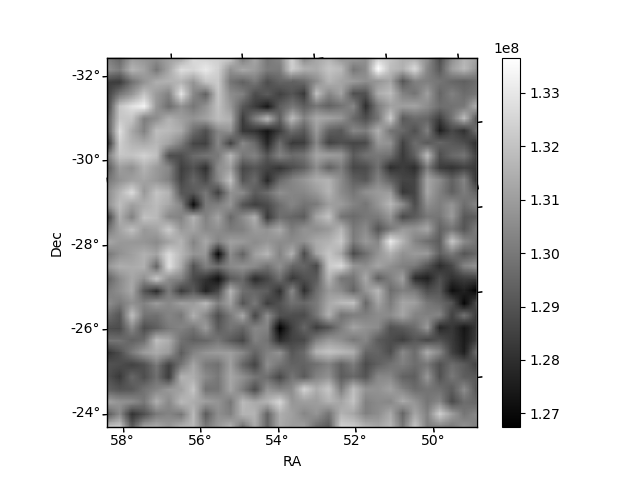
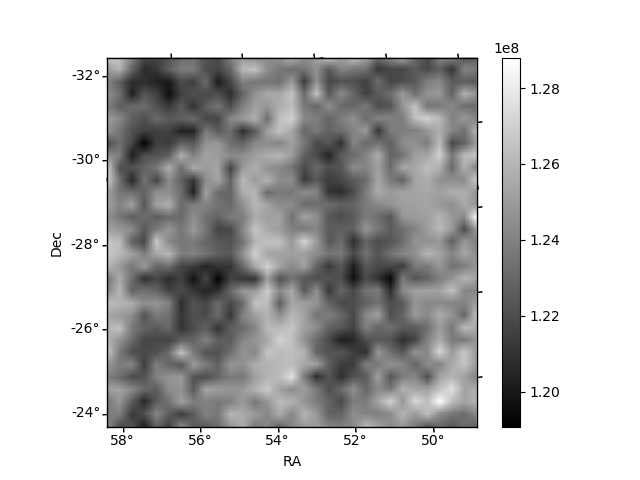
Histogram calculated using DETX and DETY for each event in the final _common_clean file
| Quadrant A | 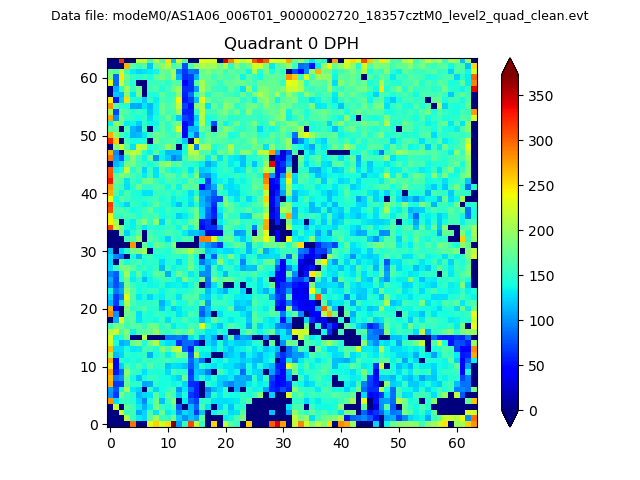 |
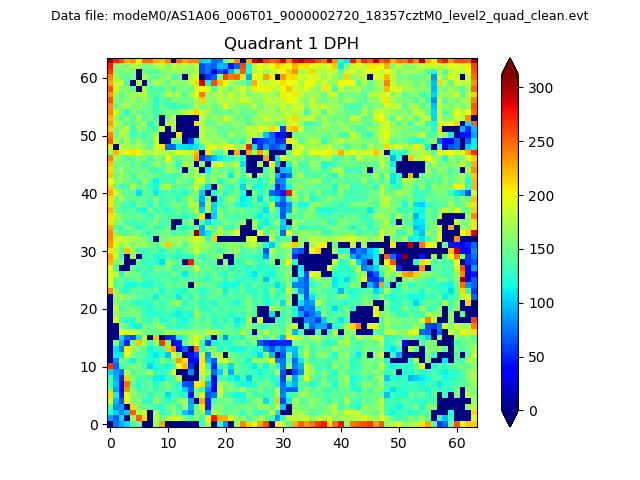 |
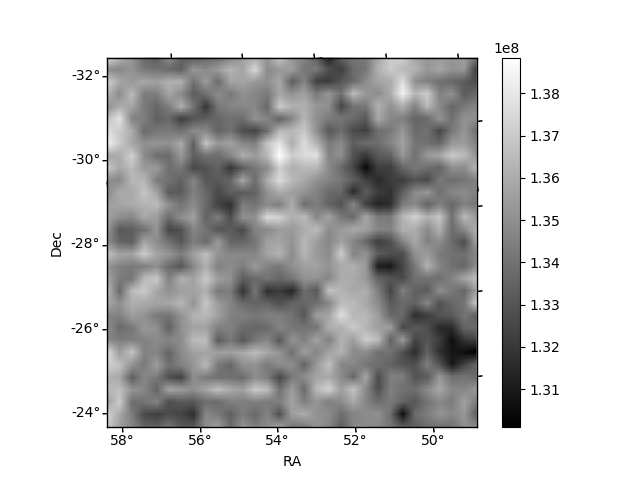
Quadrant B |
|---|---|---|---|
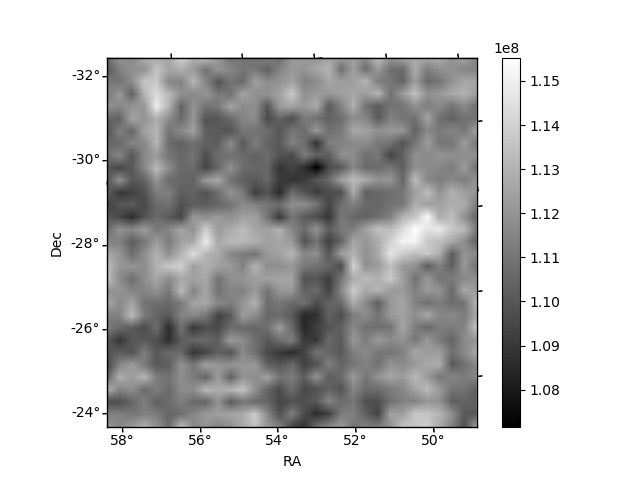
| Quadrant D | 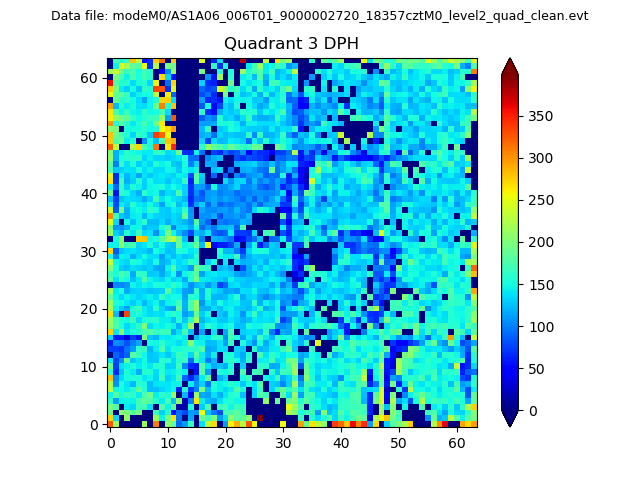 |
 |
Quadrant C |
| Plot type | Count rate plots | Images |
|---|---|---|
| Comparison with Poisson distribution Blue bars denote a histogram of data divided into 1 sec bins. Red curve is a Poisson curve with rate = median count rate of data. |
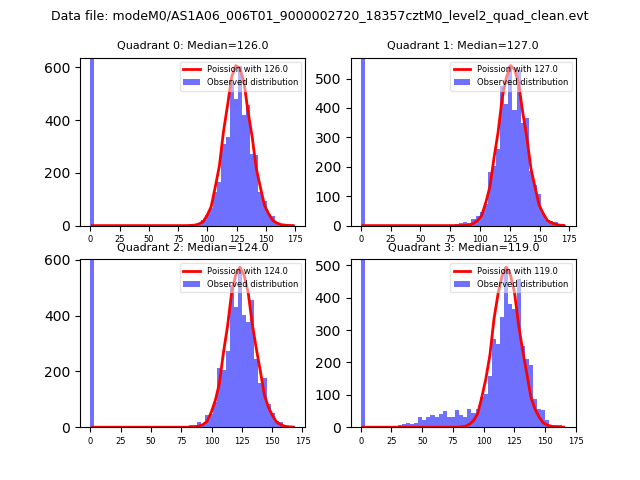 |
 |
| Quadrant-wise count rates Data is divided into 100 sec bins |
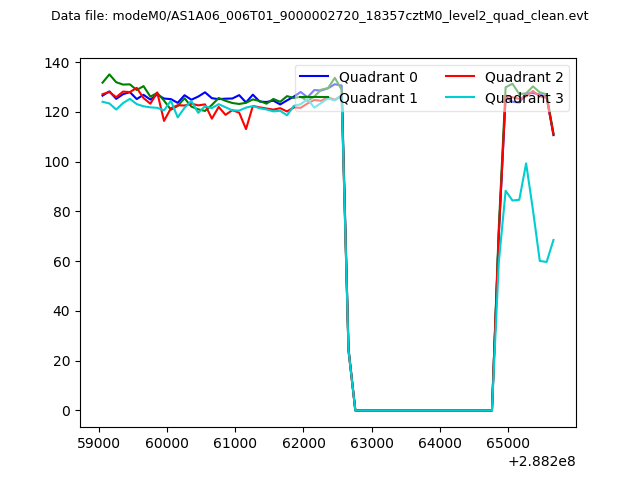 |
|
| Module-wise count rates for Quadrant A Data is divided into 100 sec bins |
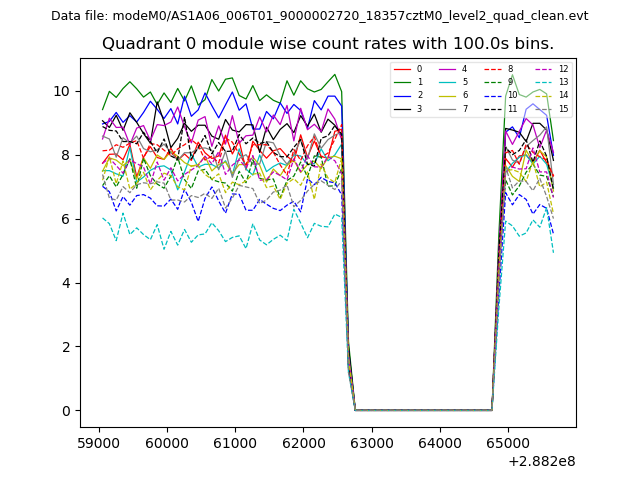 |
 |
| Module-wise count rates for Quadrant B Data is divided into 100 sec bins |
 |
 |
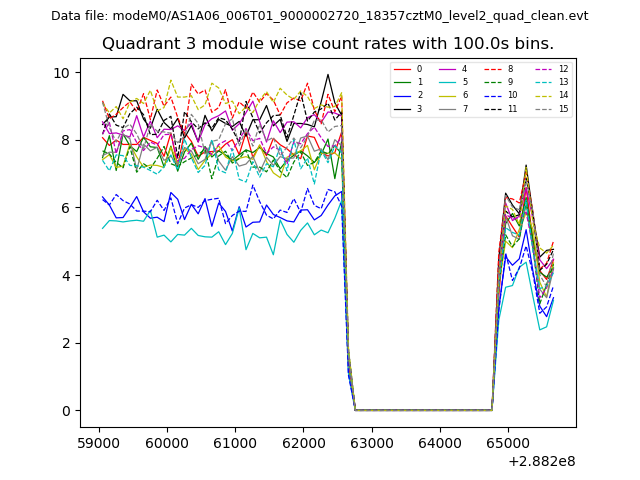
| Module-wise count rates for Quadrant C Data is divided into 100 sec bins |
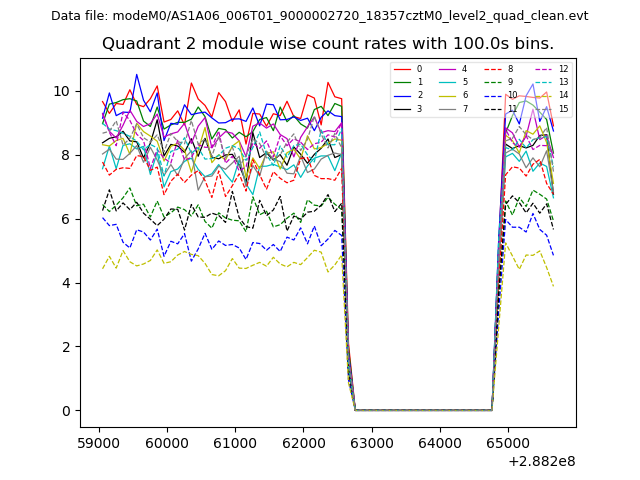 |
 |
| Module-wise count rates for Quadrant D Data is divided into 100 sec bins |
 |
 |
| Parameter | Plot |
|---|---|
| CZT HV Monitor | 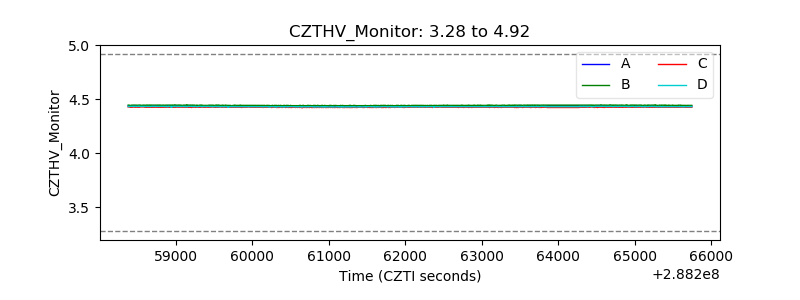 |
| D_VDD | 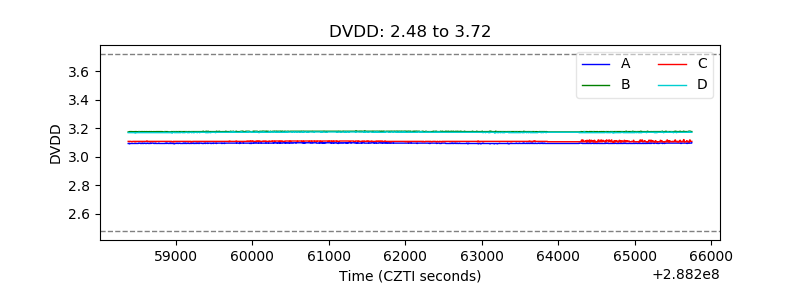 |
| Temperature 1 | 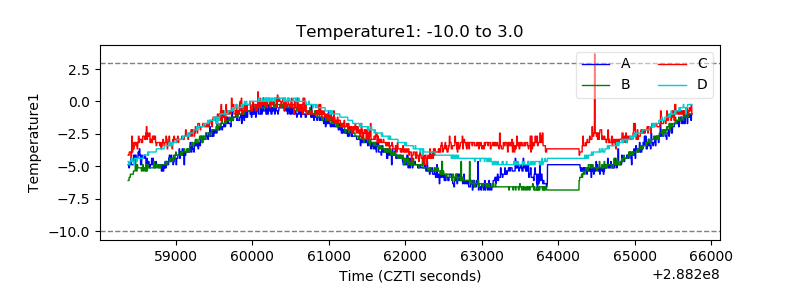 |
| Veto HV Monitor | 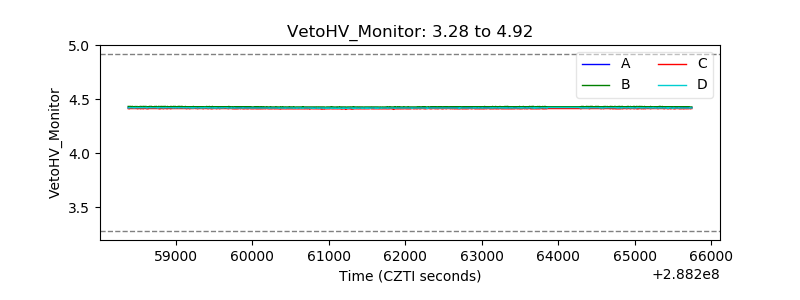 |
| Veto LLD | 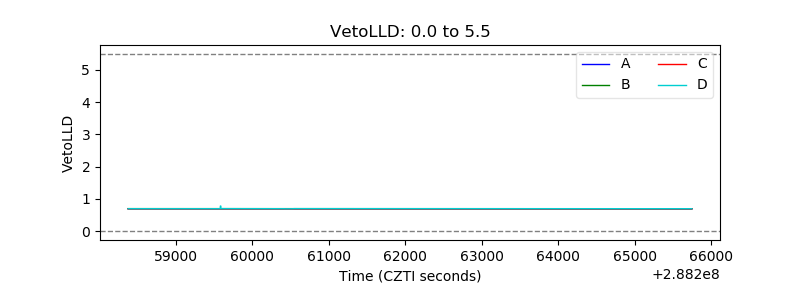 |
| Alpha Counter | 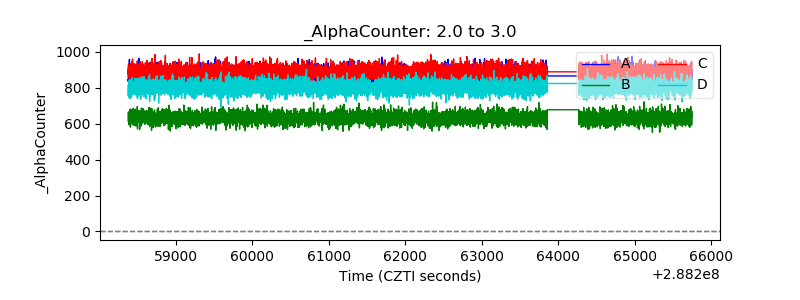 |
| _CPM_Rate |  |
| CZT Counter | 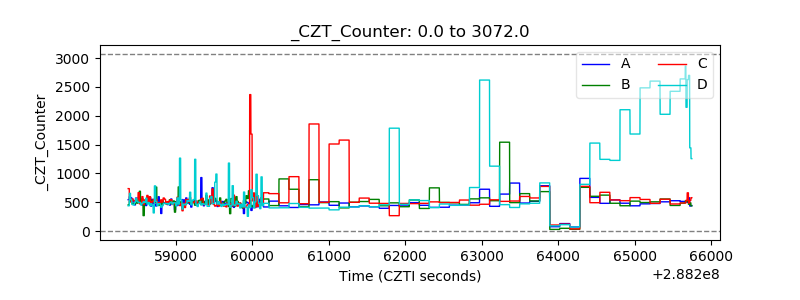 |
| +2.5 Volts monitor |  |
| +5 Volts monitor | 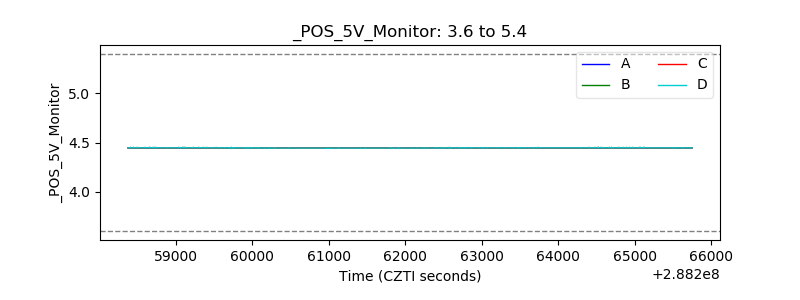 |
| _ROLL_ROT | 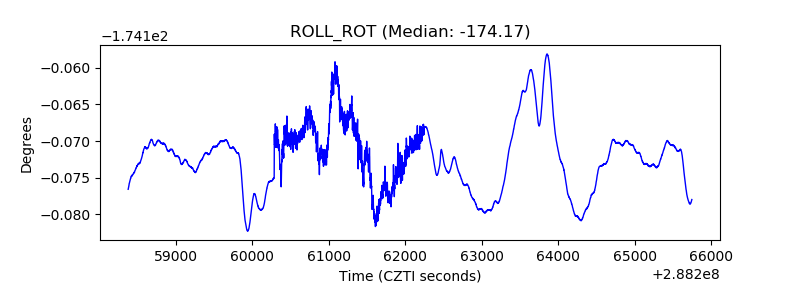 |
| _Roll_DEC | 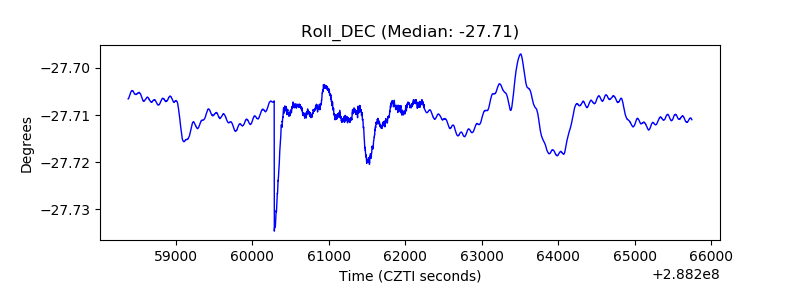 |
| _Roll_RA | 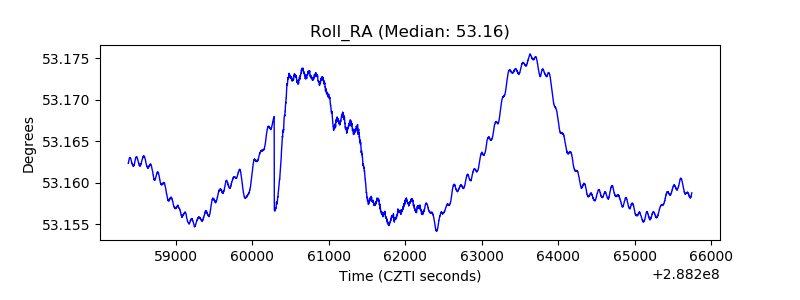 |
| Veto Counter | 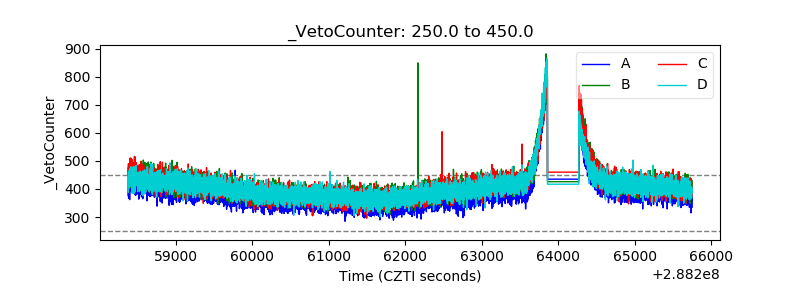 |