| Param | Original file | Final file |
|---|---|---|
| Filename | modeM0/AS1A06_006T01_9000002720_18362cztM0_level2.evt | modeM0/AS1A06_006T01_9000002720_18362cztM0_level2_quad_clean.evt |
| Size (bytes) | 1,303,548,480 | 223,735,680 |
| Size | 1.2 GB | 213.4 MB |
| Events in quadrant A | 8,491,236 | 1,410,373 |
| Events in quadrant B | 9,513,418 | 1,407,290 |
| Events in quadrant C | 9,513,159 | 1,369,664 |
| Events in quadrant D | 10,741,839 | 1,345,962 |
| Mode SS | |||
|---|---|---|---|
| Quadrant | BADHDUFLAG | Total packets | Discarded packets |
| A | 0 | 366 | 0 |
| B | 0 | 366 | 0 |
| C | 0 | 366 | 0 |
| D | 0 | 366 | 0 |
| Mode M9 | |||
|---|---|---|---|
| Quadrant | BADHDUFLAG | Total packets | Discarded packets |
| A | 0 | 21 | 0 |
| B | 0 | 21 | 0 |
| C | 0 | 21 | 0 |
| D | 0 | 21 | 0 |
| Mode M0 | |||
|---|---|---|---|
| Quadrant | BADHDUFLAG | Total packets | Discarded packets |
| A | 0 | 37398 | 3 |
| B | 0 | 39963 | 8 |
| C | 0 | 40085 | 3 |
| D | 0 | 44160 | 3 |
| Quadrant | Total seconds | Saturated seconds | Saturation percentage |
|---|---|---|---|
| A | 18034 | 85 | 0.471332% |
| B | 18033 | 273 | 1.513891% |
| C | 18033 | 362 | 2.007431% |
| D | 18033 | 475 | 2.634060% |
Noise dominated data is calculated using 1-second bins in cleaned event files. If a bin has >2000 counts, and if more than 50% of those come from <1% of pixels, then it is considered to be noise-dominated and hence unusable.
| Quadrant | # 1 sec bins | Bins with >0 counts | Bins with >2000 counts | High rate bins dominated by noise | Noise dominated (total time) | Noise dominated (detector-on time) | Marked lightcurve |
|---|---|---|---|---|---|---|---|
| A | 20089 | 18037 | 2 | 2 | 0.01% | 0.01% | 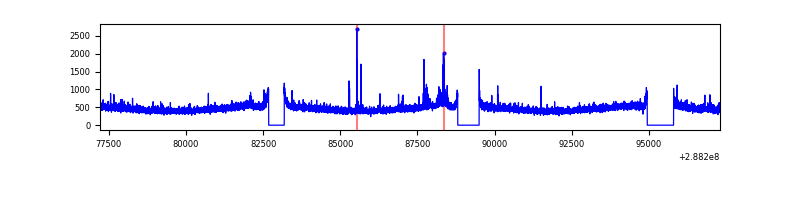 |
| B | 20088 | 18036 | 118 | 118 | 0.59% | 0.65% | 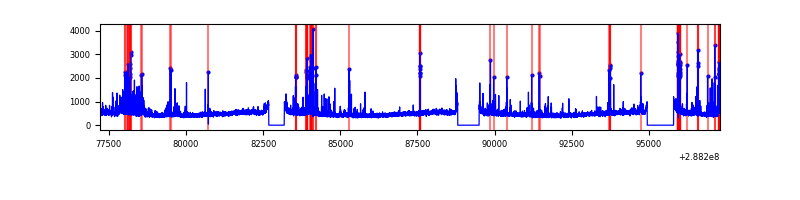 |
| C | 20088 | 18036 | 139 | 139 | 0.69% | 0.77% |  |
| D | 20088 | 18036 | 354 | 354 | 1.76% | 1.96% | 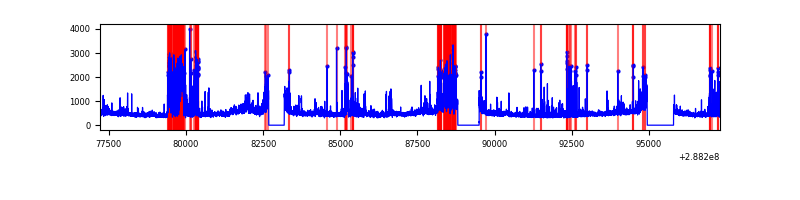 |
Top three noisy pixels from each quadrant. If the there are fewer than three noisy pixels in the level2.evt file, extra rows are filled as -1
| Pixel properties | Quadrant properties | ||||||
|---|---|---|---|---|---|---|---|
| Quadrant | DetID | PixID | Counts | Sigma | Mean | Median | Sigma |
| A | 4 | 2 | 161901 | 366.04 | 2156 | 2110 | 436.5 |
| A | 11 | 29 | 29938 | 63.75 | 2156 | 2110 | 436.5 |
| A | 0 | 226 | 19011 | 38.72 | 2156 | 2110 | 436.5 |
| B | 3 | 64 | 447235 | 1089.57 | 2151 | 2096 | 408.5 |
| B | 7 | 220 | 330281 | 803.3 | 2151 | 2096 | 408.5 |
| B | 0 | 189 | 124160 | 298.78 | 2151 | 2096 | 408.5 |
| C | 0 | 207 | 832050 | 1727.7 | 2056 | 2075 | 480.4 |
| C | 3 | 233 | 335305 | 693.66 | 2056 | 2075 | 480.4 |
| C | 14 | 238 | 312418 | 646.02 | 2056 | 2075 | 480.4 |
| D | 1 | 52 | 2393139 | 4697.98 | 2081 | 2016 | 509.0 |
| D | 12 | 110 | 274844 | 536.04 | 2081 | 2016 | 509.0 |
| D | 2 | 234 | 83127 | 159.36 | 2081 | 2016 | 509.0 |
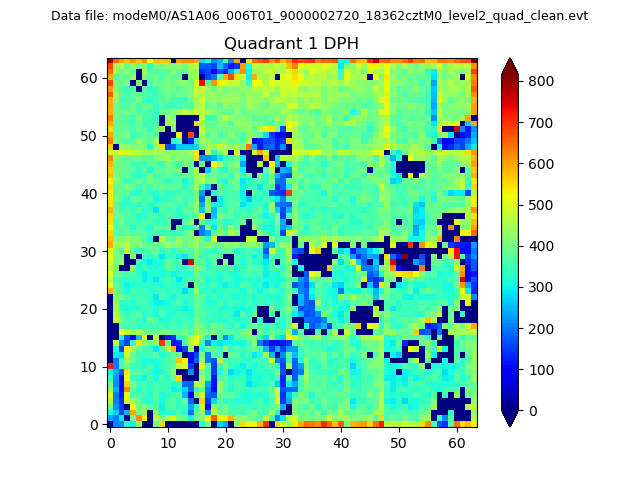
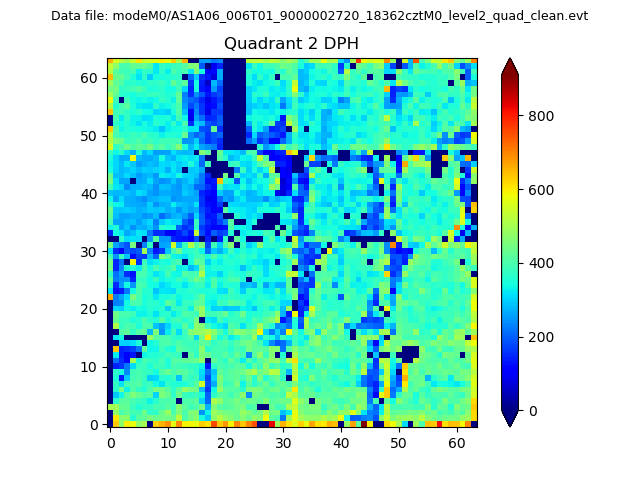
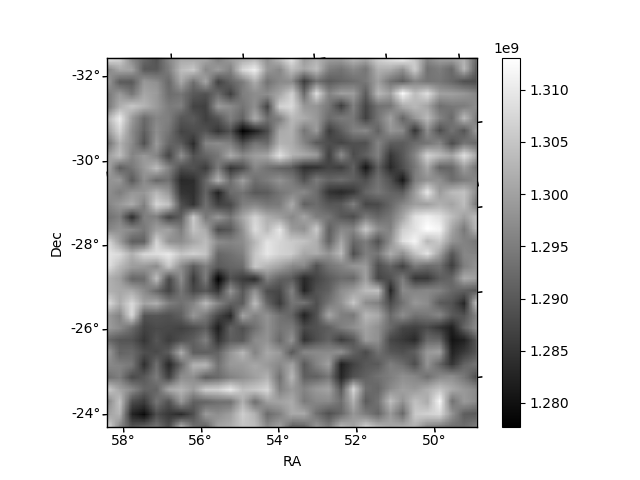
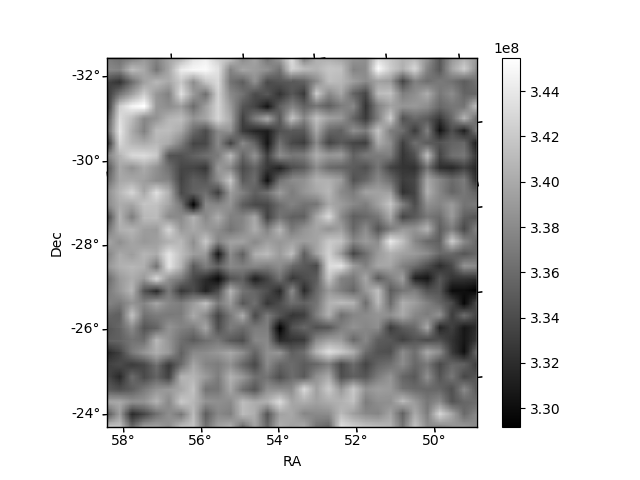
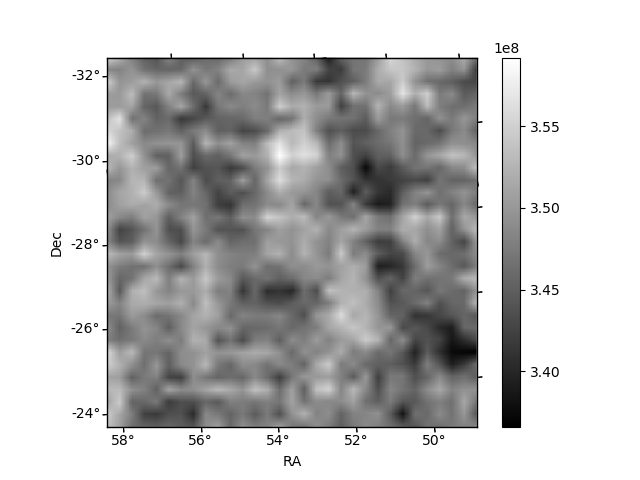
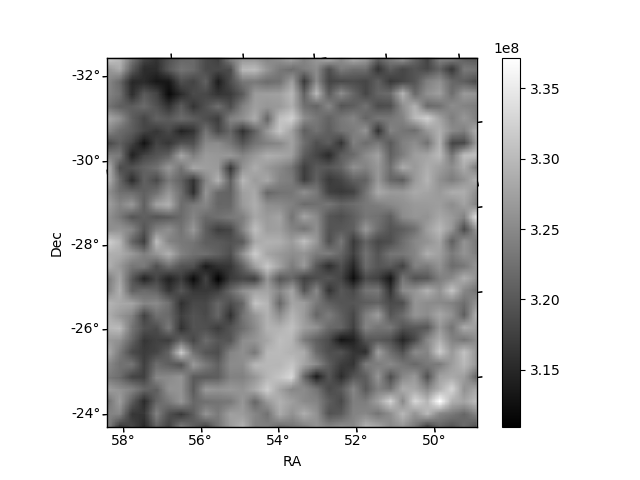
Histogram calculated using DETX and DETY for each event in the final _common_clean file
| Quadrant A | 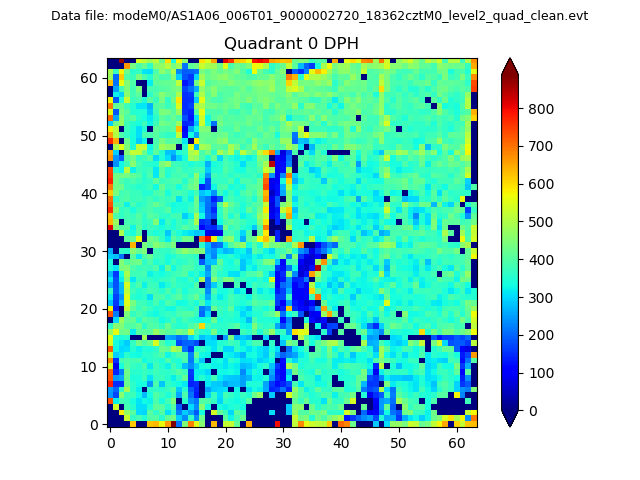 |
 |
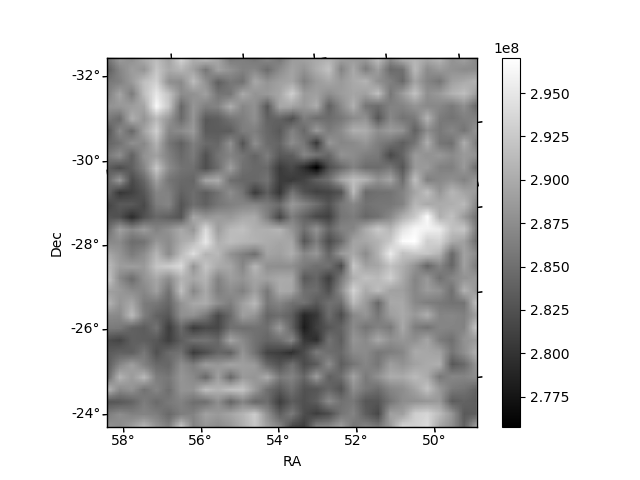
Quadrant B |
|---|---|---|---|
| Quadrant D | 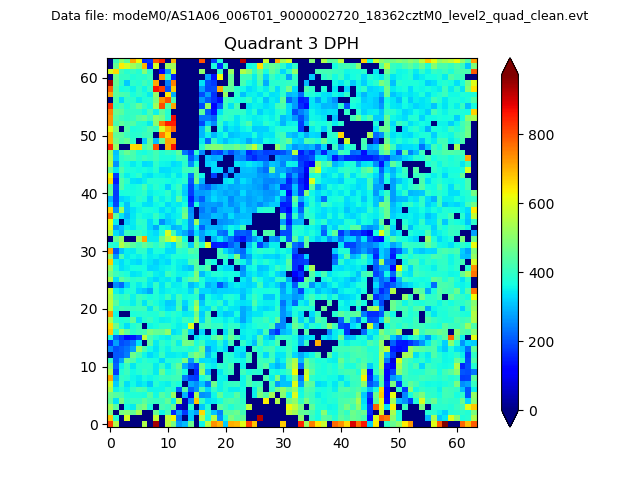 |
 |
Quadrant C |
| Plot type | Count rate plots | Images |
|---|---|---|
| Comparison with Poisson distribution Blue bars denote a histogram of data divided into 1 sec bins. Red curve is a Poisson curve with rate = median count rate of data. |
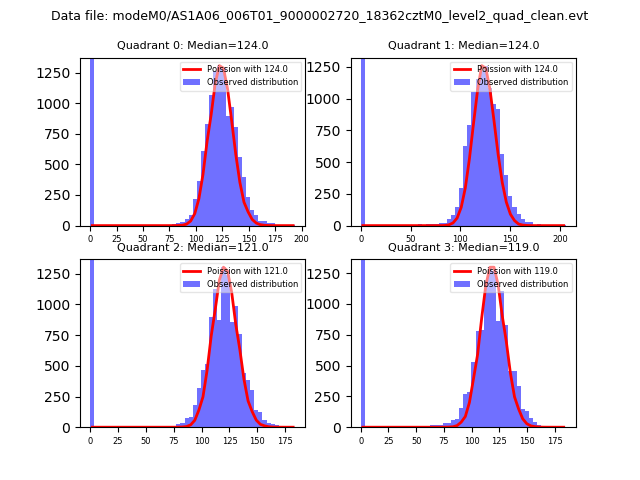 |
 |
| Quadrant-wise count rates Data is divided into 100 sec bins |
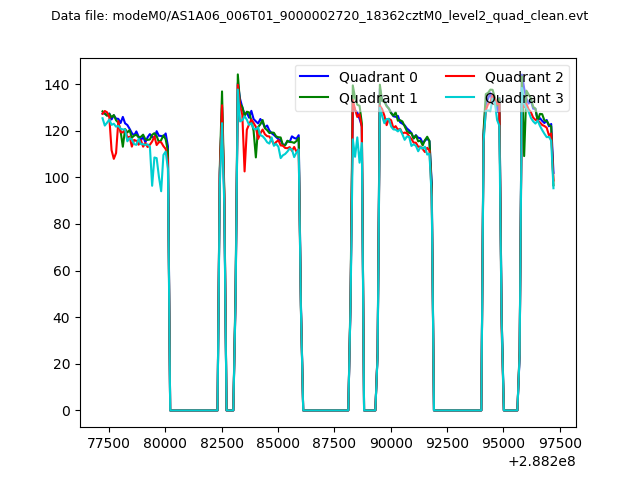 |
|
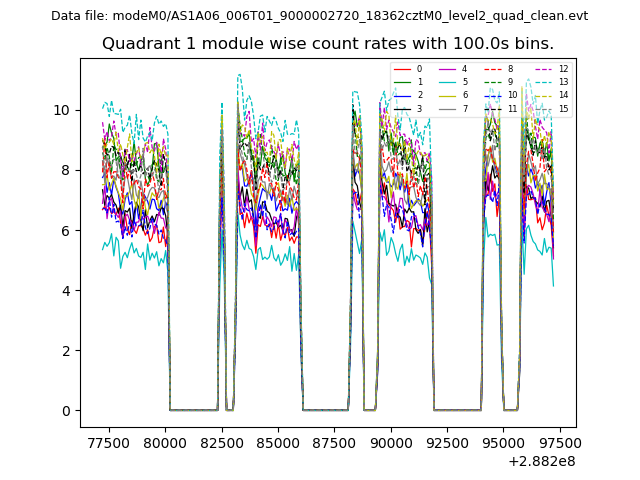
| Module-wise count rates for Quadrant A Data is divided into 100 sec bins |
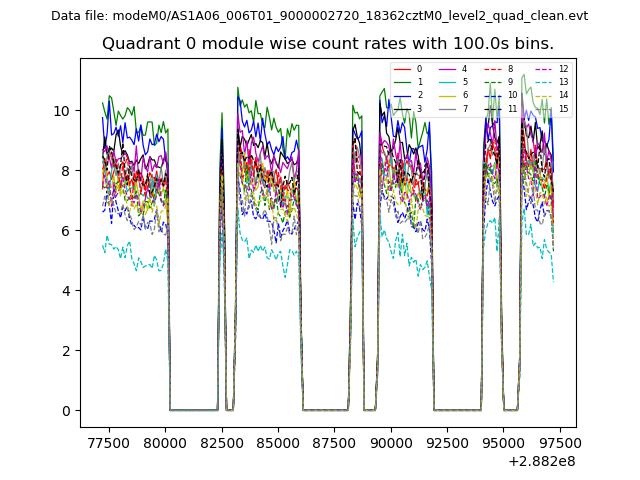 |
 |
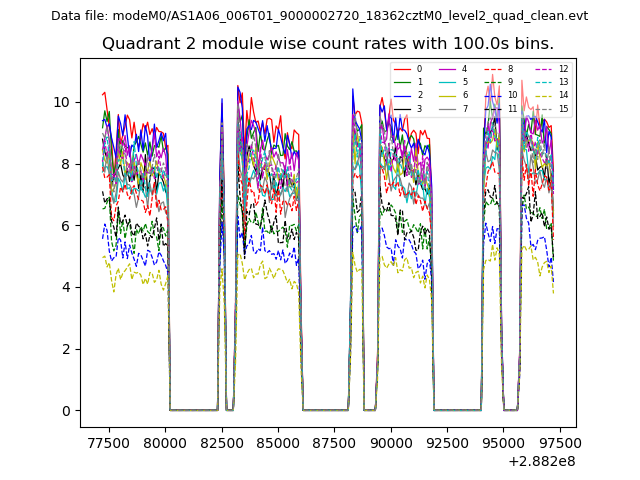
| Module-wise count rates for Quadrant B Data is divided into 100 sec bins |
 |
 |
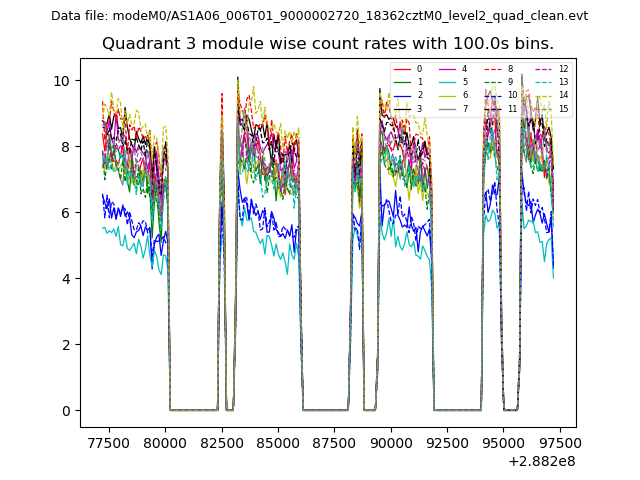
| Module-wise count rates for Quadrant C Data is divided into 100 sec bins |
 |
 |
| Module-wise count rates for Quadrant D Data is divided into 100 sec bins |
 |
 |
| Parameter | Plot |
|---|---|
| CZT HV Monitor | 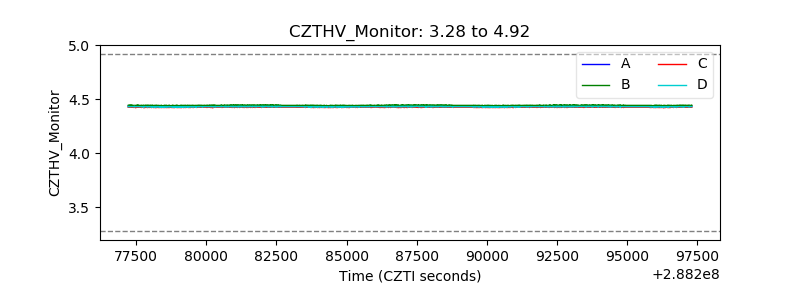 |
| D_VDD | 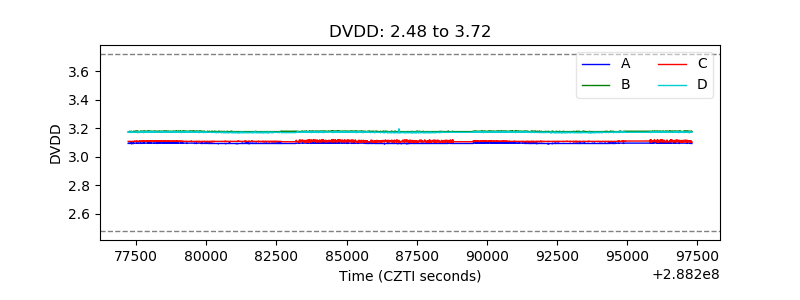 |
| Temperature 1 | 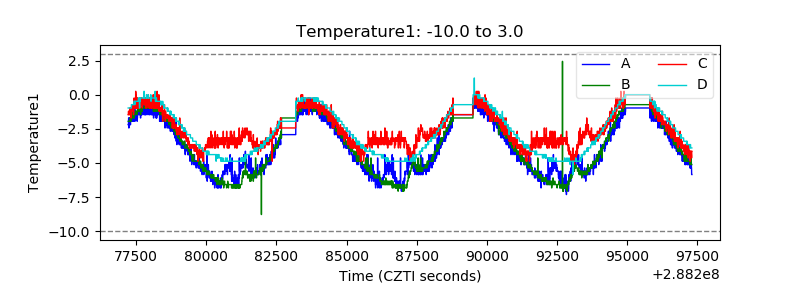 |
| Veto HV Monitor | 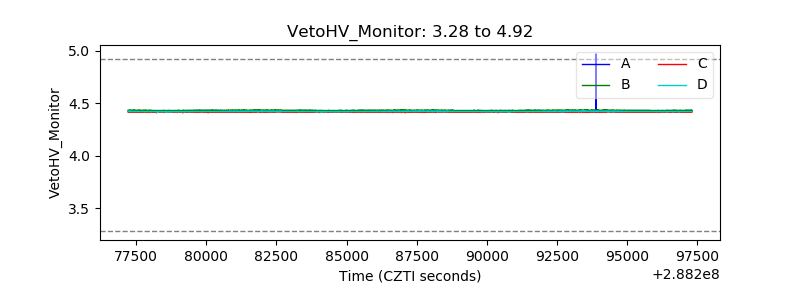 |
| Veto LLD | 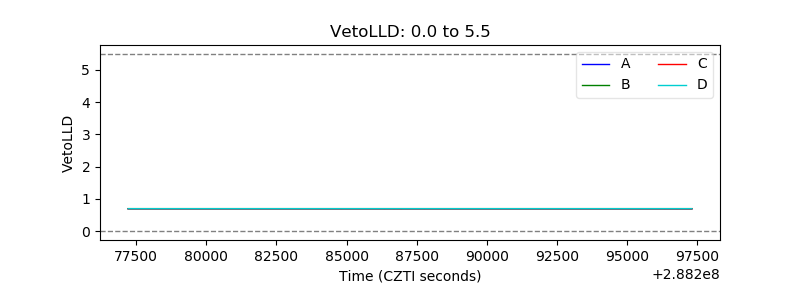 |
| Alpha Counter | 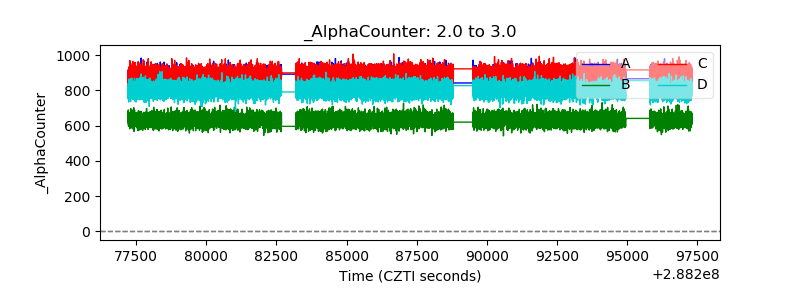 |
| _CPM_Rate | 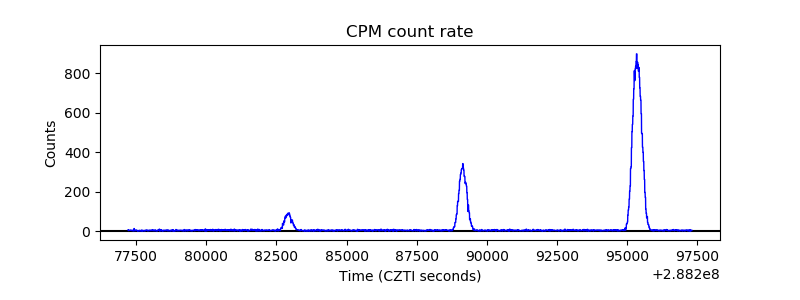 |
| CZT Counter | 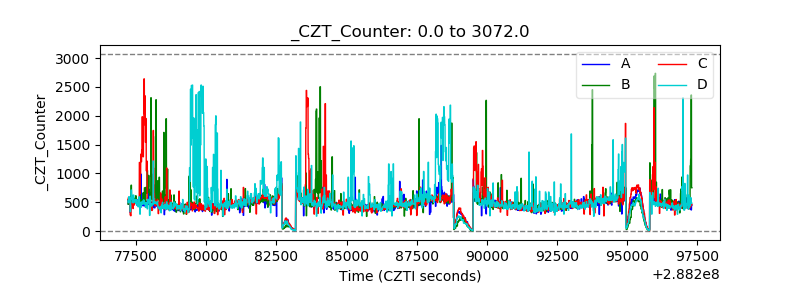 |
| +2.5 Volts monitor |  |
| +5 Volts monitor |  |
| _ROLL_ROT | 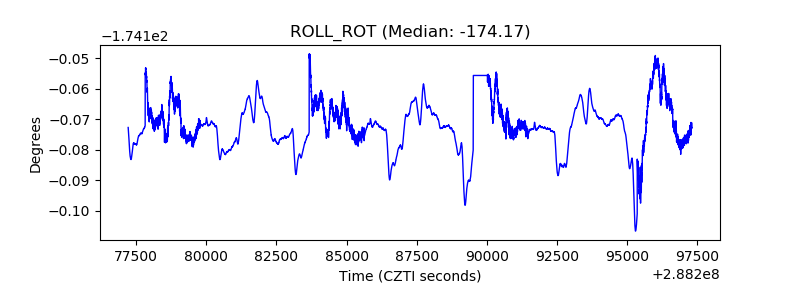 |
| _Roll_DEC | 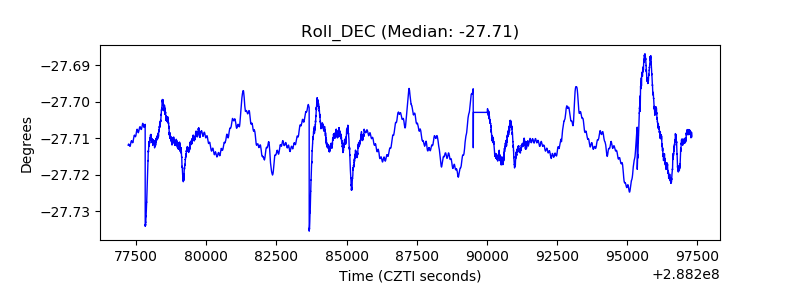 |
| _Roll_RA | 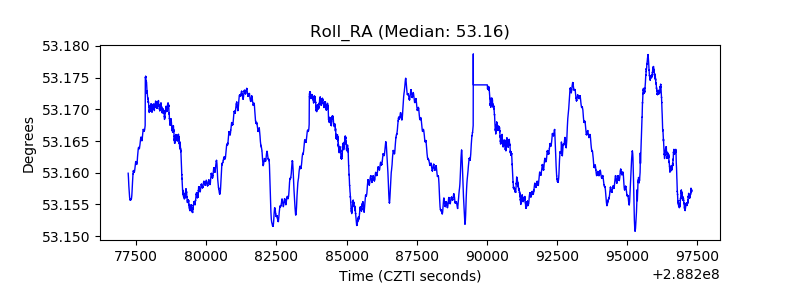 |
| Veto Counter | 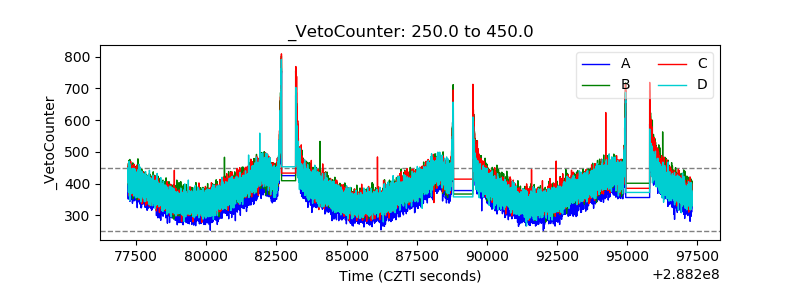 |