| Param | Original file | Final file |
|---|---|---|
| Filename | modeM0/AS1A06_006T01_9000002720_18366cztM0_level2.evt | modeM0/AS1A06_006T01_9000002720_18366cztM0_level2_quad_clean.evt |
| Size (bytes) | 432,120,960 | 84,012,480 |
| Size | 412.1 MB | 80.1 MB |
| Events in quadrant A | 2,916,775 | 538,184 |
| Events in quadrant B | 3,408,114 | 544,675 |
| Events in quadrant C | 3,208,495 | 527,170 |
| Events in quadrant D | 3,138,772 | 508,231 |
| Mode SS | |||
|---|---|---|---|
| Quadrant | BADHDUFLAG | Total packets | Discarded packets |
| A | 0 | 124 | 0 |
| B | 0 | 124 | 0 |
| C | 0 | 124 | 0 |
| D | 0 | 124 | 0 |
| Mode M9 | |||
|---|---|---|---|
| Quadrant | BADHDUFLAG | Total packets | Discarded packets |
| A | 0 | 18 | 0 |
| B | 0 | 19 | 0 |
| C | 0 | 19 | 0 |
| D | 0 | 19 | 0 |
| Mode M0 | |||
|---|---|---|---|
| Quadrant | BADHDUFLAG | Total packets | Discarded packets |
| A | 0 | 12531 | 2 |
| B | 0 | 14042 | 2 |
| C | 0 | 13474 | 2 |
| D | 0 | 13313 | 2 |
| Quadrant | Total seconds | Saturated seconds | Saturation percentage |
|---|---|---|---|
| A | 6098 | 27 | 0.442768% |
| B | 6098 | 124 | 2.033454% |
| C | 6098 | 72 | 1.180715% |
| D | 6098 | 81 | 1.328304% |
Noise dominated data is calculated using 1-second bins in cleaned event files. If a bin has >2000 counts, and if more than 50% of those come from <1% of pixels, then it is considered to be noise-dominated and hence unusable.
| Quadrant | # 1 sec bins | Bins with >0 counts | Bins with >2000 counts | High rate bins dominated by noise | Noise dominated (total time) | Noise dominated (detector-on time) | Marked lightcurve |
|---|---|---|---|---|---|---|---|
| A | 7203 | 6099 | 0 | 0 | 0.00% | 0.00% | 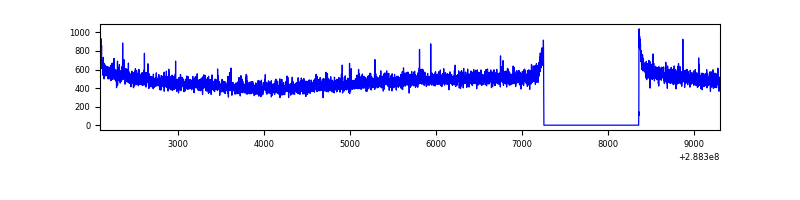 |
| B | 7203 | 6099 | 40 | 40 | 0.56% | 0.66% | 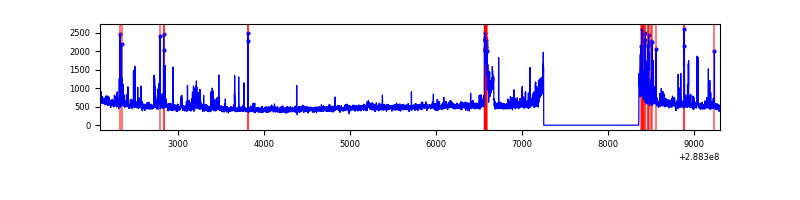 |
| C | 7203 | 6099 | 2 | 2 | 0.03% | 0.03% | 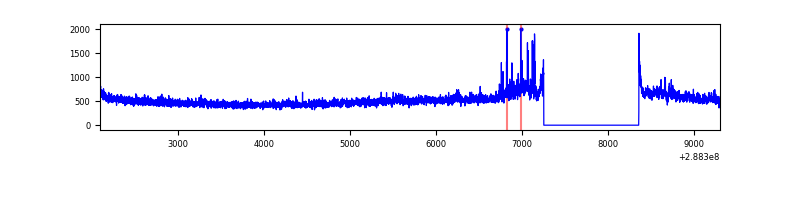 |
| D | 7203 | 6099 | 48 | 48 | 0.67% | 0.79% | 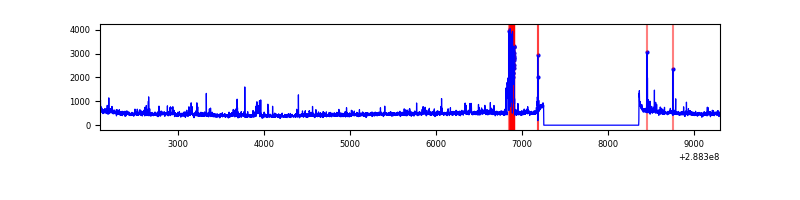 |
Top three noisy pixels from each quadrant. If the there are fewer than three noisy pixels in the level2.evt file, extra rows are filled as -1
| Pixel properties | Quadrant properties | ||||||
|---|---|---|---|---|---|---|---|
| Quadrant | DetID | PixID | Counts | Sigma | Mean | Median | Sigma |
| A | 11 | 29 | 10549 | 64.21 | 754 | 739 | 152.8 |
| A | 0 | 226 | 6712 | 39.1 | 754 | 739 | 152.8 |
| A | 12 | 194 | 5658 | 32.2 | 754 | 739 | 152.8 |
| B | 7 | 220 | 145893 | 1007.45 | 757 | 740 | 144.1 |
| B | 3 | 64 | 109002 | 751.4 | 757 | 740 | 144.1 |
| B | 0 | 189 | 75527 | 519.06 | 757 | 740 | 144.1 |
| C | 3 | 233 | 208916 | 1220.36 | 725 | 727 | 170.6 |
| C | 14 | 238 | 111448 | 649.02 | 725 | 727 | 170.6 |
| C | 0 | 207 | 58481 | 338.54 | 725 | 727 | 170.6 |
| D | 1 | 52 | 297685 | 1682.53 | 725 | 705 | 176.5 |
| D | 12 | 110 | 31392 | 173.86 | 725 | 705 | 176.5 |
| D | 2 | 234 | 26172 | 144.28 | 725 | 705 | 176.5 |
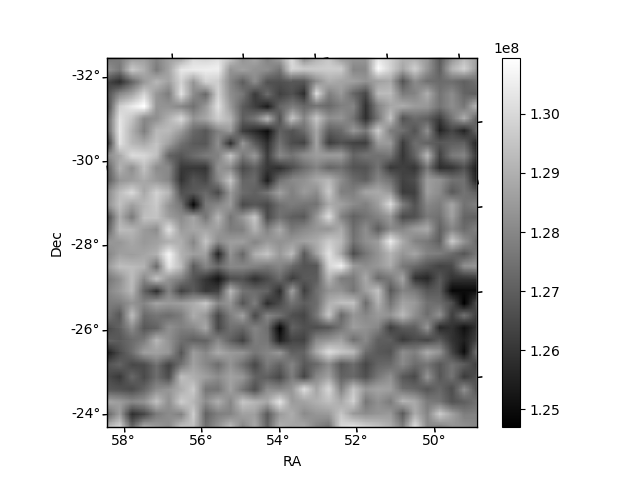
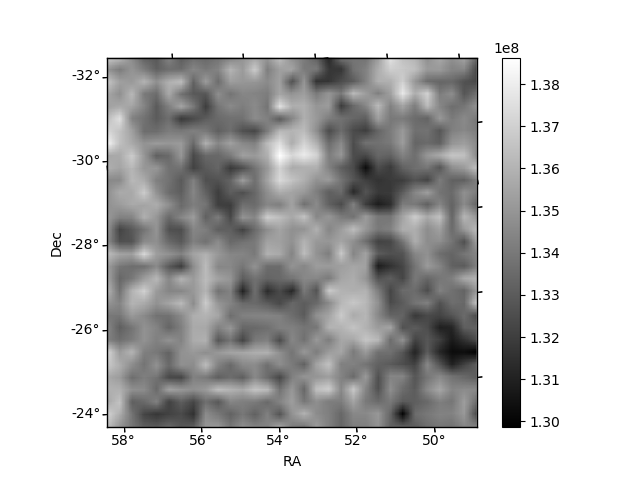
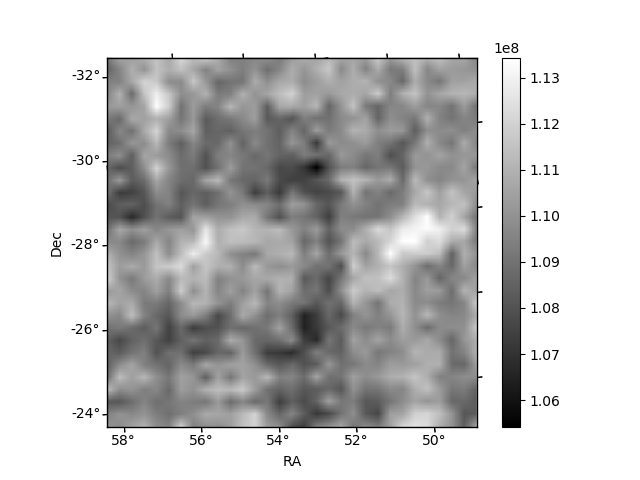
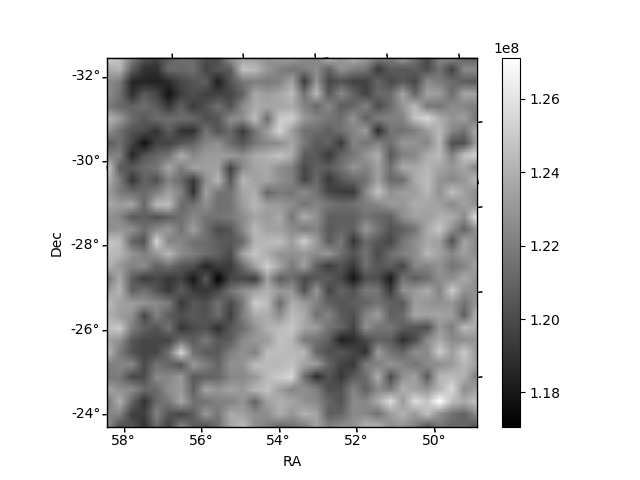
Histogram calculated using DETX and DETY for each event in the final _common_clean file
| Quadrant A | 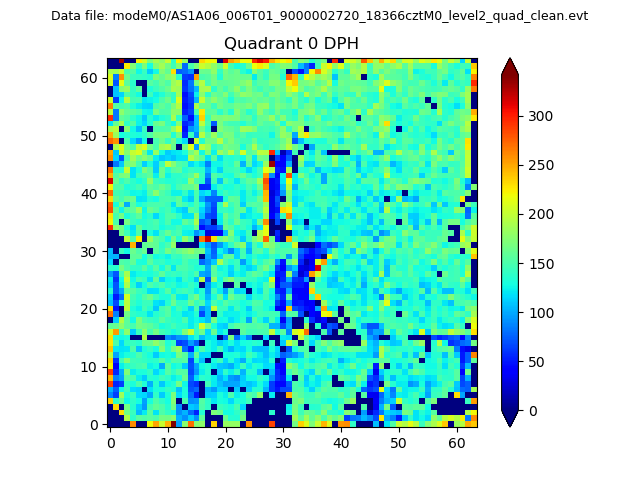 |
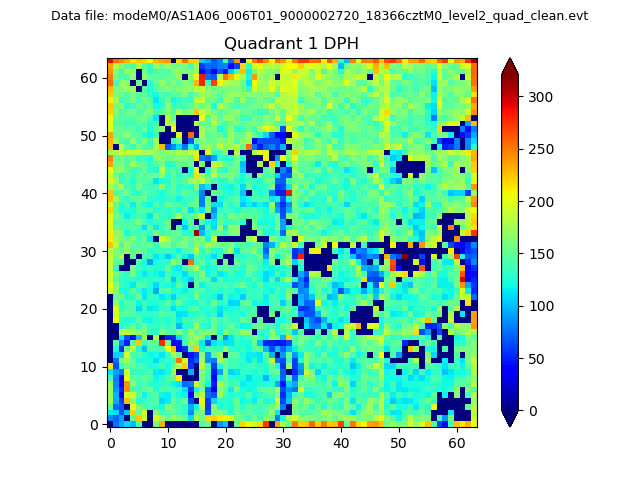 |
Quadrant B |
|---|---|---|---|
| Quadrant D |  |
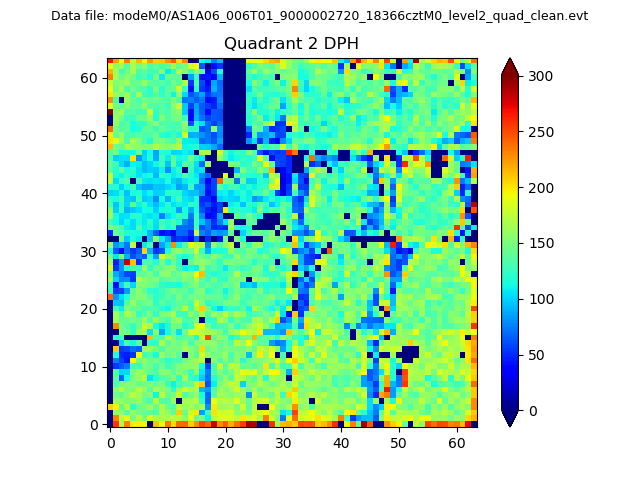 |
Quadrant C |
| Plot type | Count rate plots | Images |
|---|---|---|
| Comparison with Poisson distribution Blue bars denote a histogram of data divided into 1 sec bins. Red curve is a Poisson curve with rate = median count rate of data. |
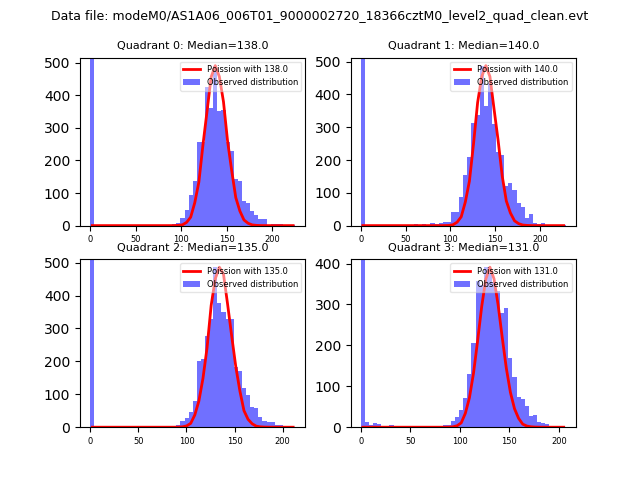 |
 |
| Quadrant-wise count rates Data is divided into 100 sec bins |
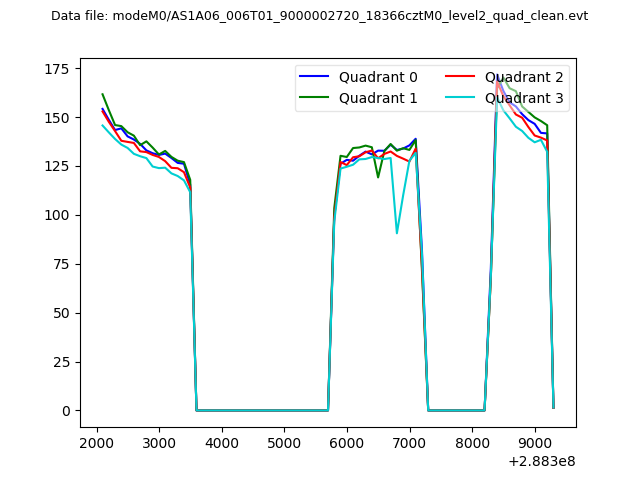 |
|
| Module-wise count rates for Quadrant A Data is divided into 100 sec bins |
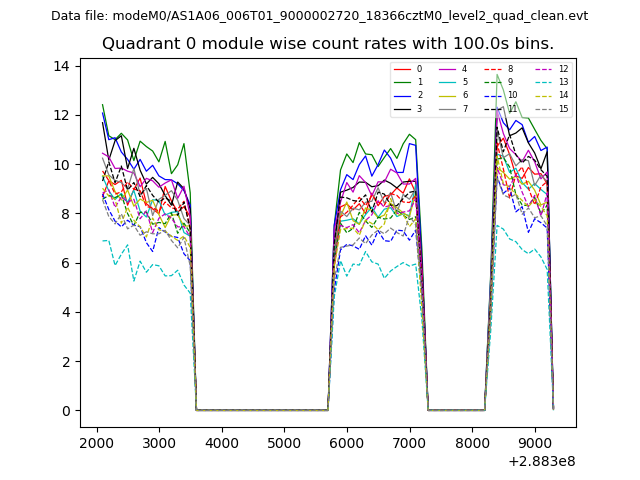 |
 |
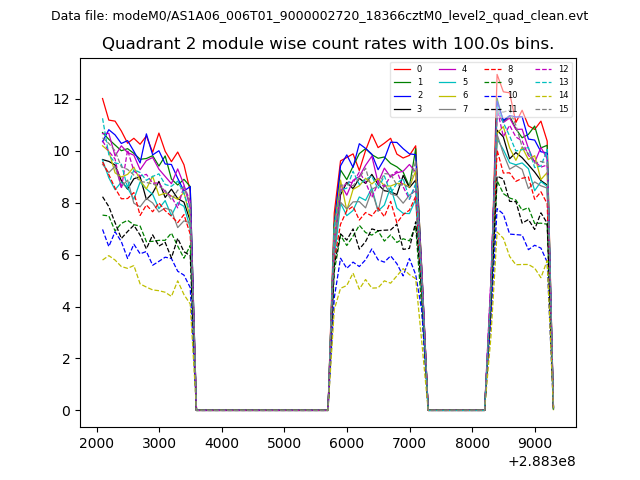
| Module-wise count rates for Quadrant B Data is divided into 100 sec bins |
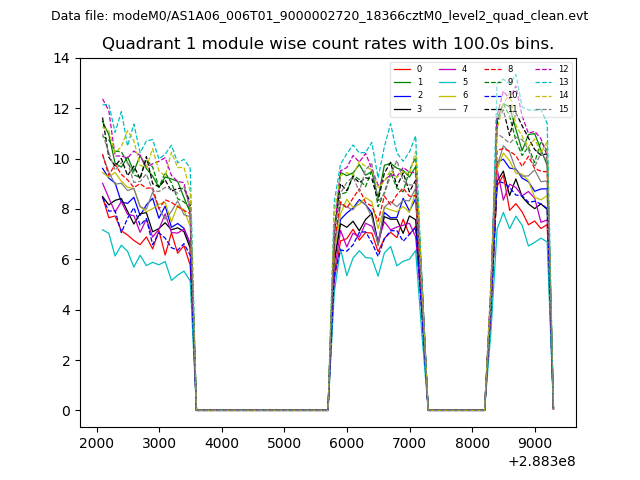 |
 |
| Module-wise count rates for Quadrant C Data is divided into 100 sec bins |
 |
 |
| Module-wise count rates for Quadrant D Data is divided into 100 sec bins |
 |
 |
| Parameter | Plot |
|---|---|
| CZT HV Monitor | 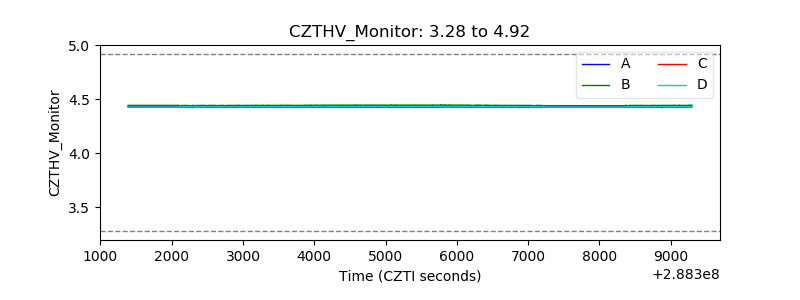 |
| D_VDD | 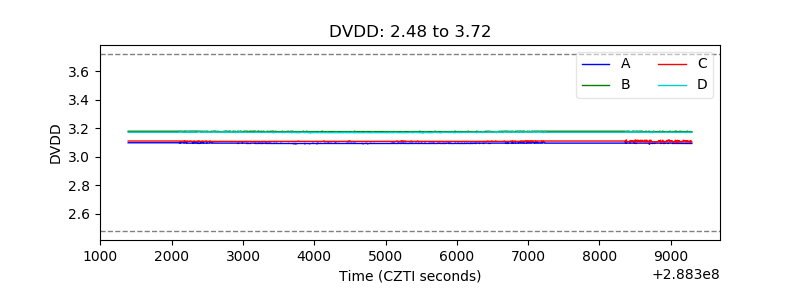 |
| Temperature 1 | 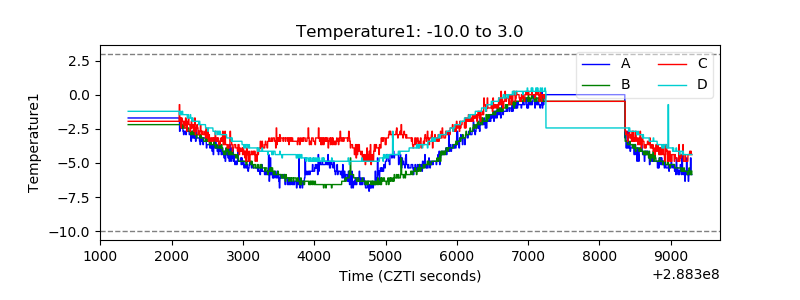 |
| Veto HV Monitor | 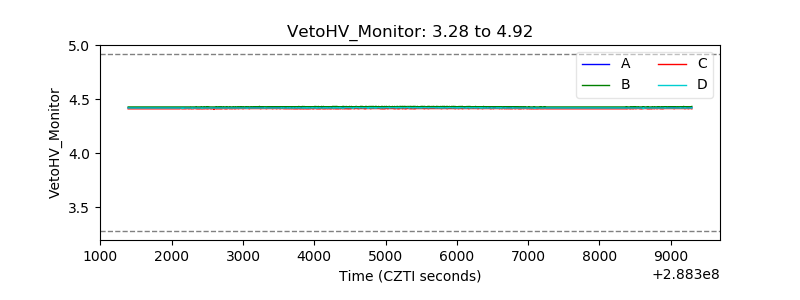 |
| Veto LLD | 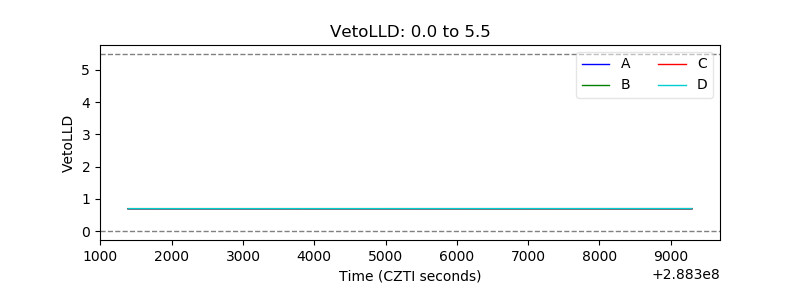 |
| Alpha Counter | 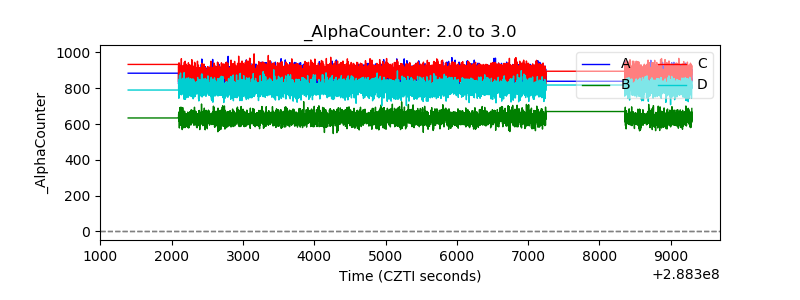 |
| _CPM_Rate | 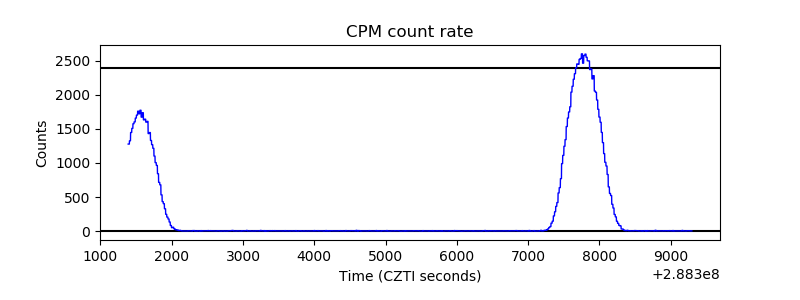 |
| CZT Counter | 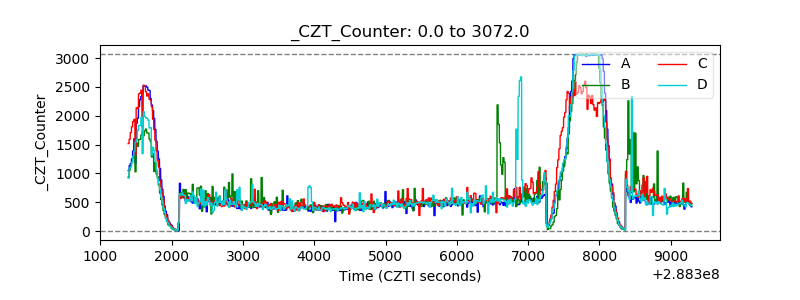 |
| +2.5 Volts monitor |  |
| +5 Volts monitor | 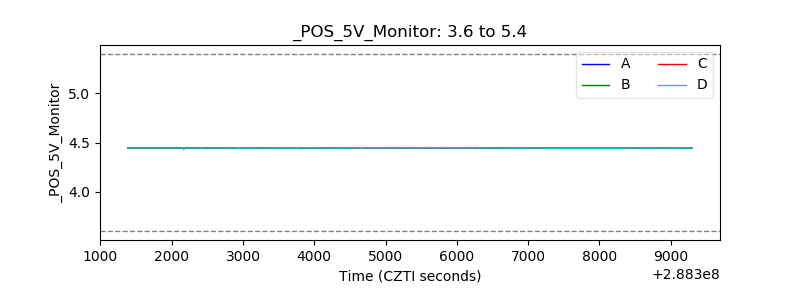 |
| _ROLL_ROT | 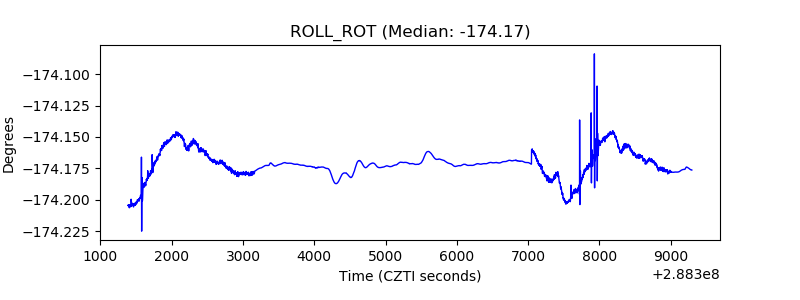 |
| _Roll_DEC | 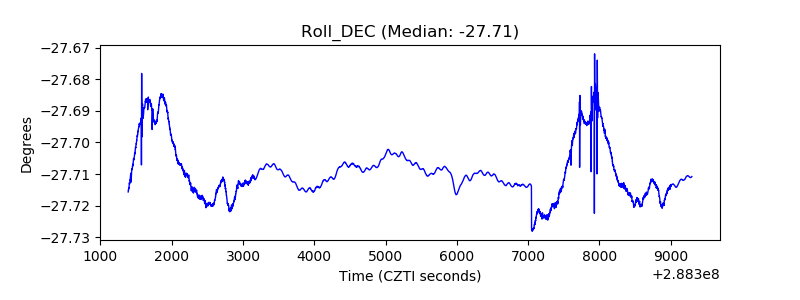 |
| _Roll_RA | 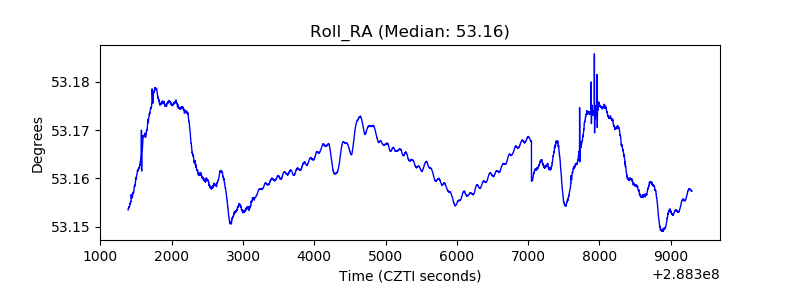 |
| Veto Counter | 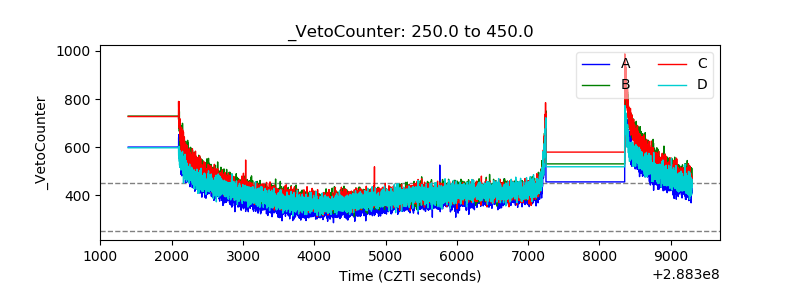 |