| Param | Original file | Final file |
|---|---|---|
| Filename | modeM0/AS1T03_083T01_9000002722cztM0_level2.fits | modeM0/AS1T03_083T01_9000002722cztM0_level2_quad_clean.evt |
| Size (bytes) | 94,432,320 | 54,175,680 |
| Size | 90.1 MB | 51.7 MB |
| Events in quadrant A | 582,346 | 264,754 |
| Events in quadrant B | 568,428 | 270,640 |
| Events in quadrant C | 578,890 | 251,294 |
| Events in quadrant D | 497,820 | 220,015 |
| Mode M9 | |||
|---|---|---|---|
| Quadrant | BADHDUFLAG | Total packets | Discarded packets |
| A | 0 | 25 | 0 |
| B | 0 | 25 | 0 |
| C | 0 | 25 | 0 |
| D | 0 | 25 | 0 |
| Mode M0 | |||
|---|---|---|---|
| Quadrant | BADHDUFLAG | Total packets | Discarded packets |
| A | 0 | 19012 | 0 |
| B | 0 | 20678 | 0 |
| C | 0 | 20121 | 0 |
| D | 0 | 20499 | 0 |
| Mode SS | |||
|---|---|---|---|
| Quadrant | BADHDUFLAG | Total packets | Discarded packets |
| A | 0 | 188 | 0 |
| B | 0 | 188 | 0 |
| C | 0 | 188 | 0 |
| D | 0 | 188 | 0 |
| Quadrant | Total seconds | Saturated seconds | Saturation percentage |
|---|---|---|---|
| A | 9113 | 35 | 0.384067% |
| B | 9113 | 119 | 1.305827% |
| C | 9113 | 121 | 1.327774% |
| D | 9113 | 192 | 2.106880% |
Noise dominated data is calculated using 1-second bins in cleaned event files. If a bin has >2000 counts, and if more than 50% of those come from <1% of pixels, then it is considered to be noise-dominated and hence unusable.
| Quadrant | # 1 sec bins | Bins with >0 counts | Bins with >2000 counts | High rate bins dominated by noise | Noise dominated (total time) | Noise dominated (detector-on time) | Marked lightcurve |
|---|---|---|---|---|---|---|---|
| A | 11649 | 9113 | 0 | 0 | 0.00% | 0.00% |  |
| B | 11649 | 9112 | 0 | 0 | 0.00% | 0.00% |  |
| C | 11649 | 9113 | 0 | 0 | 0.00% | 0.00% |  |
| D | 11649 | 9113 | 0 | 0 | 0.00% | 0.00% |  |
Top three noisy pixels from each quadrant. If the there are fewer than three noisy pixels in the level2.evt file, extra rows are filled as -1
| Pixel properties | Quadrant properties | ||||||
|---|---|---|---|---|---|---|---|
| Quadrant | DetID | PixID | Counts | Sigma | Mean | Median | Sigma |
| A | 0 | 29 | 551 | 10.42 | 151 | 143 | 39.1 |
| A | 7 | 110 | 477 | 8.53 | 151 | 143 | 39.1 |
| A | 0 | 30 | 462 | 8.15 | 151 | 143 | 39.1 |
| B | 2 | 9 | 450 | 9.77 | 150 | 145 | 31.2 |
| B | 5 | 128 | 406 | 8.36 | 150 | 145 | 31.2 |
| B | 5 | 255 | 374 | 7.34 | 150 | 145 | 31.2 |
| C | 12 | 241 | 387 | 5.92 | 153 | 144 | 41.0 |
| C | 3 | 126 | 387 | 5.92 | 153 | 144 | 41.0 |
| C | 7 | 233 | 377 | 5.68 | 153 | 144 | 41.0 |
| D | 10 | 189 | 415 | 7.38 | 141 | 129 | 38.8 |
| D | 10 | 190 | 400 | 6.99 | 141 | 129 | 38.8 |
| D | 15 | 46 | 362 | 6.01 | 141 | 129 | 38.8 |
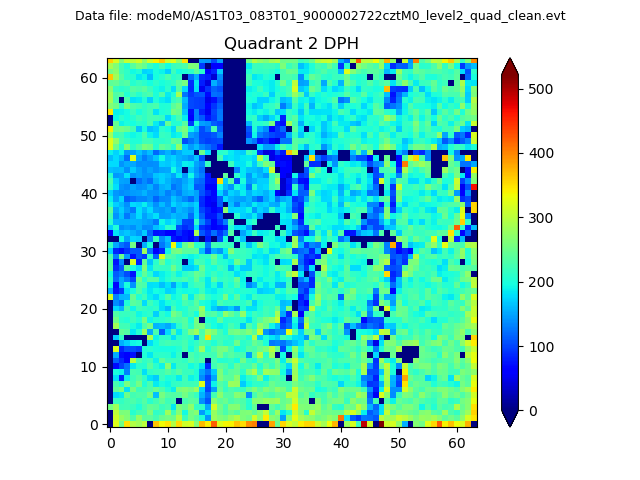
Histogram calculated using DETX and DETY for each event in the final _common_clean file
| Quadrant A |  |
 |
Quadrant B |
|---|---|---|---|
| Quadrant D | 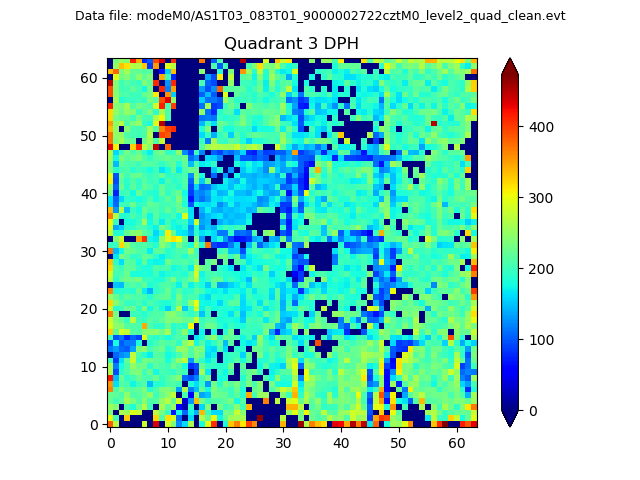 |
 |
Quadrant C |
| Plot type | Count rate plots | Images |
|---|---|---|
| Comparison with Poisson distribution Blue bars denote a histogram of data divided into 1 sec bins. Red curve is a Poisson curve with rate = median count rate of data. |
 |
 |
| Quadrant-wise count rates Data is divided into 100 sec bins |
 |
|
| Module-wise count rates for Quadrant A Data is divided into 100 sec bins |
 |
 |
| Module-wise count rates for Quadrant B Data is divided into 100 sec bins |
 |
 |
| Module-wise count rates for Quadrant C Data is divided into 100 sec bins |
 |
 |
| Module-wise count rates for Quadrant D Data is divided into 100 sec bins |
 |
 |
| Parameter | Plot |
|---|---|
| CZT HV Monitor |  |
| D_VDD |  |
| Temperature 1 |  |
| Veto HV Monitor |  |
| Veto LLD | 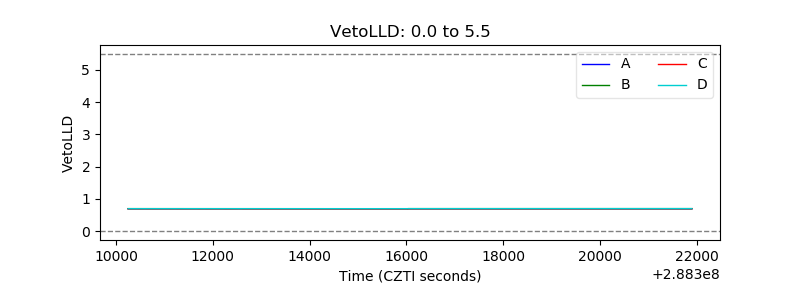 |
| Alpha Counter |  |
| _CPM_Rate |  |
| CZT Counter |  |
| +2.5 Volts monitor |  |
| +5 Volts monitor |  |
| _ROLL_ROT |  |
| _Roll_DEC |  |
| _Roll_RA |  |
| Veto Counter |  |