| Param | Original file | Final file |
|---|---|---|
| Filename | modeM0/AS1T03_083T01_9000002722_18366cztM0_level2.evt | modeM0/AS1T03_083T01_9000002722_18366cztM0_level2_quad_clean.evt |
| Size (bytes) | 339,045,120 | 74,949,120 |
| Size | 323.3 MB | 71.5 MB |
| Events in quadrant A | 2,328,363 | 493,243 |
| Events in quadrant B | 2,625,470 | 508,913 |
| Events in quadrant C | 2,576,484 | 476,561 |
| Events in quadrant D | 2,414,639 | 457,947 |
| Mode M9 | |||
|---|---|---|---|
| Quadrant | BADHDUFLAG | Total packets | Discarded packets |
| A | 0 | 12 | 0 |
| B | 0 | 12 | 0 |
| C | 0 | 12 | 0 |
| D | 0 | 12 | 0 |
| Mode M0 | |||
|---|---|---|---|
| Quadrant | BADHDUFLAG | Total packets | Discarded packets |
| A | 0 | 9953 | 1 |
| B | 0 | 10787 | 1 |
| C | 0 | 10455 | 1 |
| D | 0 | 10140 | 1 |
| Mode SS | |||
|---|---|---|---|
| Quadrant | BADHDUFLAG | Total packets | Discarded packets |
| A | 0 | 98 | 0 |
| B | 0 | 98 | 0 |
| C | 0 | 98 | 0 |
| D | 0 | 98 | 0 |
| Quadrant | Total seconds | Saturated seconds | Saturation percentage |
|---|---|---|---|
| A | 4737 | 21 | 0.443319% |
| B | 4737 | 50 | 1.055520% |
| C | 4737 | 57 | 1.203293% |
| D | 4737 | 4 | 0.084442% |
Noise dominated data is calculated using 1-second bins in cleaned event files. If a bin has >2000 counts, and if more than 50% of those come from <1% of pixels, then it is considered to be noise-dominated and hence unusable.
| Quadrant | # 1 sec bins | Bins with >0 counts | Bins with >2000 counts | High rate bins dominated by noise | Noise dominated (total time) | Noise dominated (detector-on time) | Marked lightcurve |
|---|---|---|---|---|---|---|---|
| A | 5962 | 4738 | 5 | 5 | 0.08% | 0.11% | 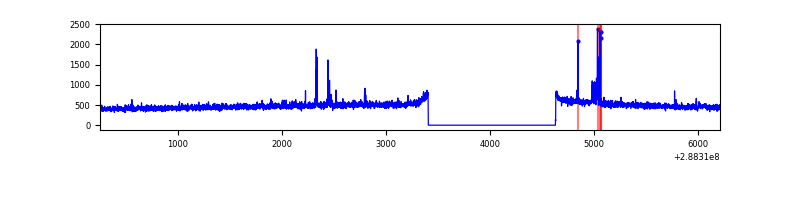 |
| B | 5962 | 4738 | 17 | 17 | 0.29% | 0.36% | 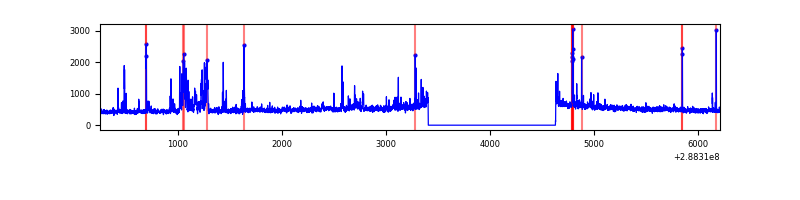 |
| C | 5962 | 4738 | 3 | 3 | 0.05% | 0.06% | 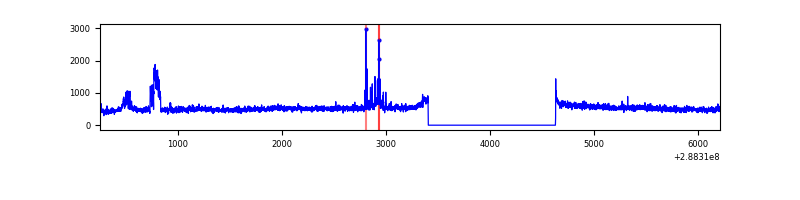 |
| D | 5962 | 4738 | 1 | 1 | 0.02% | 0.02% | 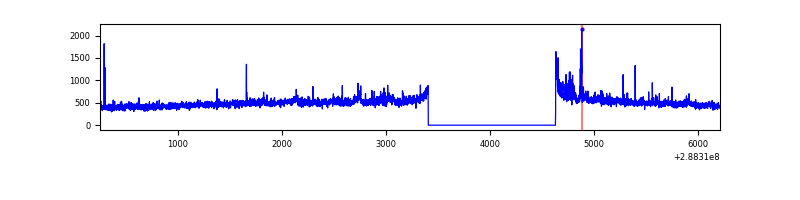 |
Top three noisy pixels from each quadrant. If the there are fewer than three noisy pixels in the level2.evt file, extra rows are filled as -1
| Pixel properties | Quadrant properties | ||||||
|---|---|---|---|---|---|---|---|
| Quadrant | DetID | PixID | Counts | Sigma | Mean | Median | Sigma |
| A | 4 | 2 | 61916 | 518.53 | 588 | 577 | 118.3 |
| A | 0 | 226 | 5058 | 37.88 | 588 | 577 | 118.3 |
| A | 12 | 194 | 4285 | 31.35 | 588 | 577 | 118.3 |
| B | 3 | 64 | 215911 | 1934.95 | 596 | 582 | 111.3 |
| B | 7 | 220 | 40359 | 357.44 | 596 | 582 | 111.3 |
| B | 0 | 189 | 22775 | 199.43 | 596 | 582 | 111.3 |
| C | 3 | 233 | 187075 | 1398.65 | 575 | 581 | 133.3 |
| C | 14 | 238 | 91065 | 678.6 | 575 | 581 | 133.3 |
| C | 0 | 207 | 47458 | 351.56 | 575 | 581 | 133.3 |
| D | 12 | 110 | 95259 | 680.05 | 574 | 559 | 139.3 |
| D | 11 | 176 | 55941 | 397.7 | 574 | 559 | 139.3 |
| D | 2 | 69 | 33409 | 235.9 | 574 | 559 | 139.3 |
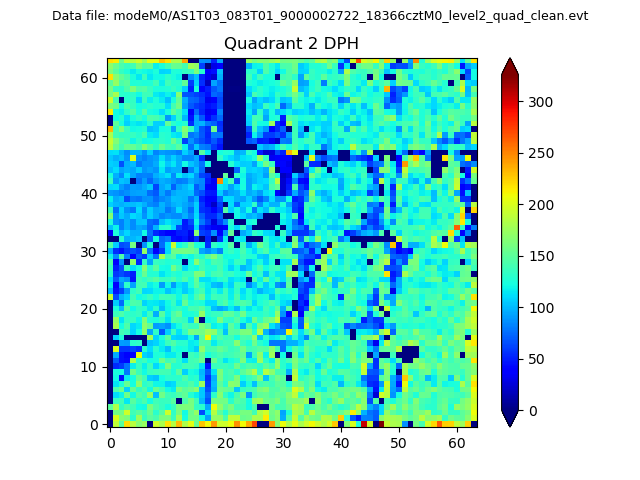
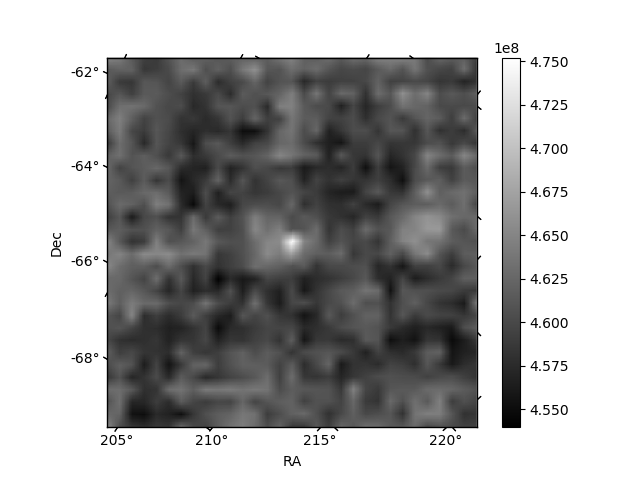
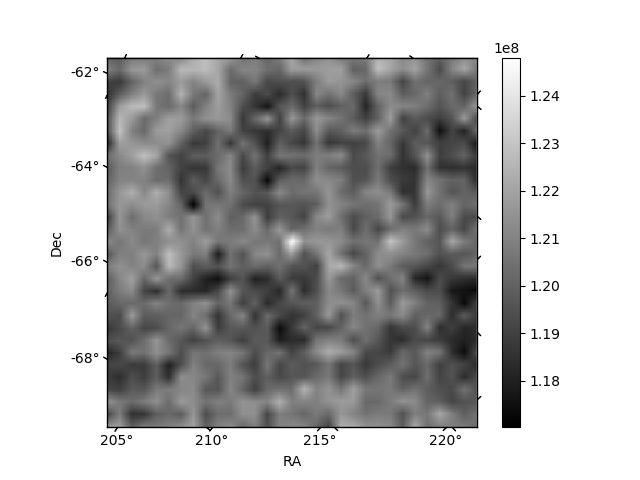
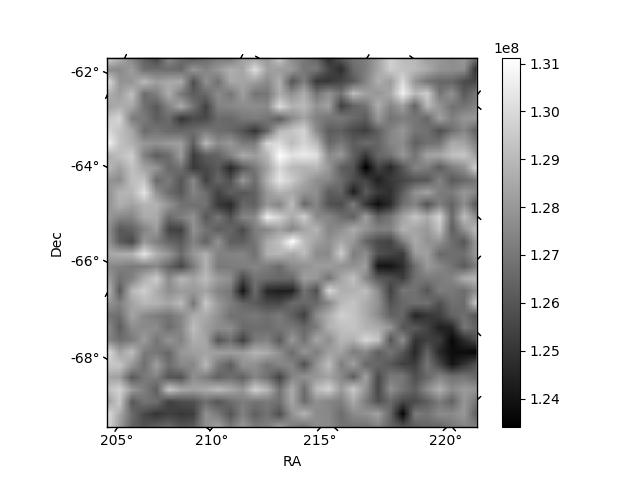
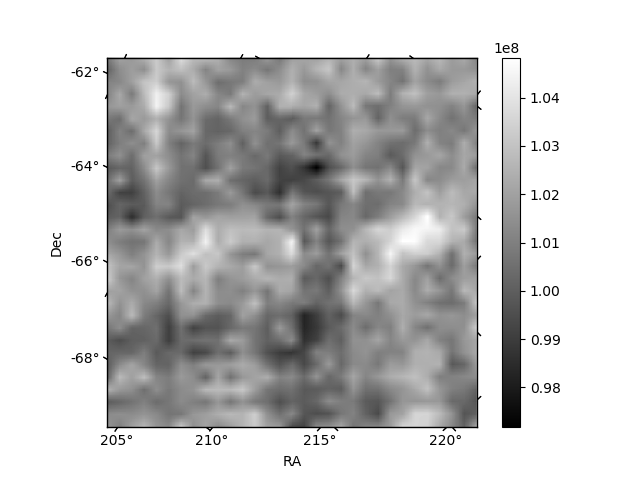
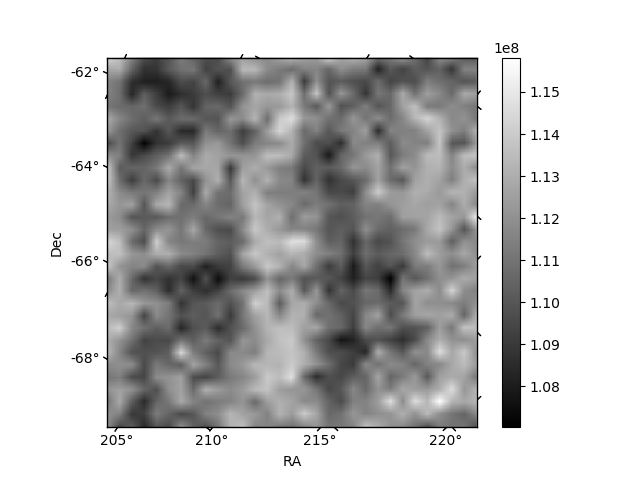
Histogram calculated using DETX and DETY for each event in the final _common_clean file
| Quadrant A | 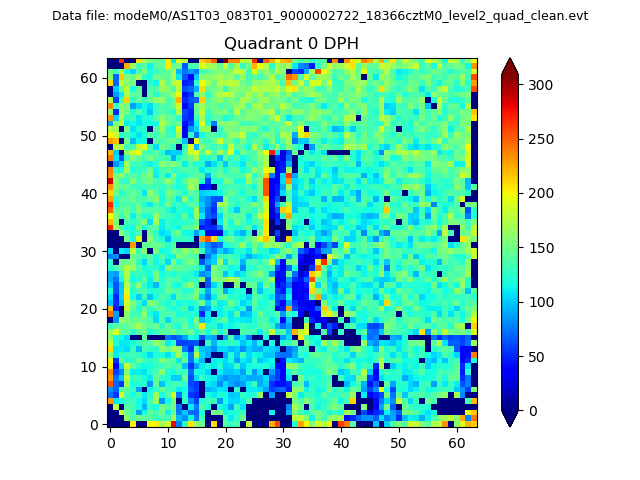 |
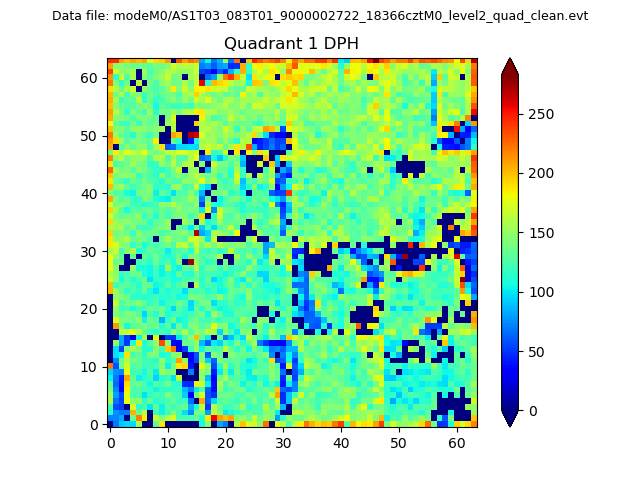 |
Quadrant B |
|---|---|---|---|
| Quadrant D | 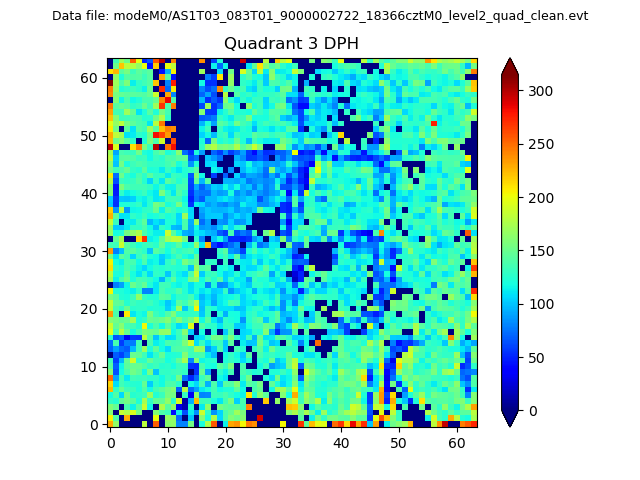 |
 |
Quadrant C |
| Plot type | Count rate plots | Images |
|---|---|---|
| Comparison with Poisson distribution Blue bars denote a histogram of data divided into 1 sec bins. Red curve is a Poisson curve with rate = median count rate of data. |
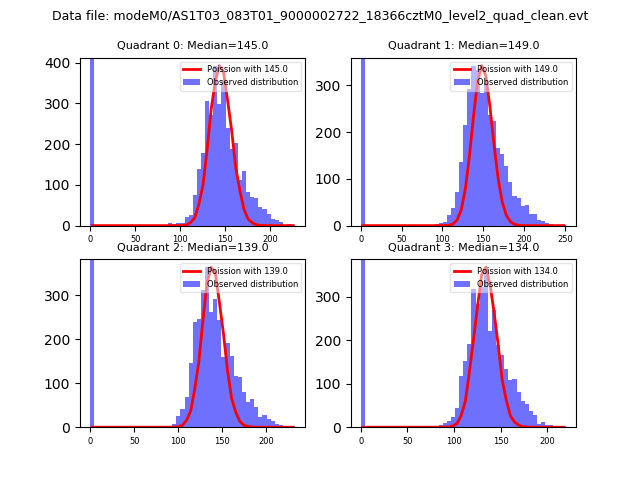 |
 |
| Quadrant-wise count rates Data is divided into 100 sec bins |
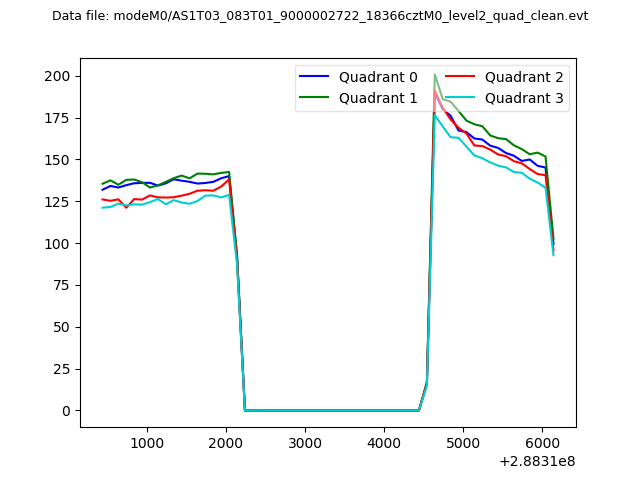 |
|
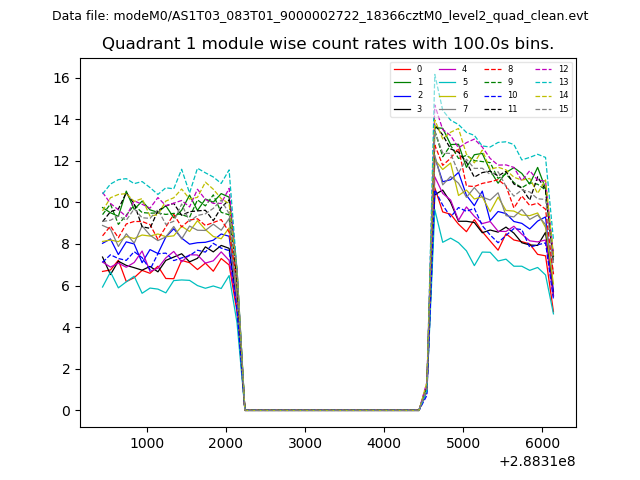
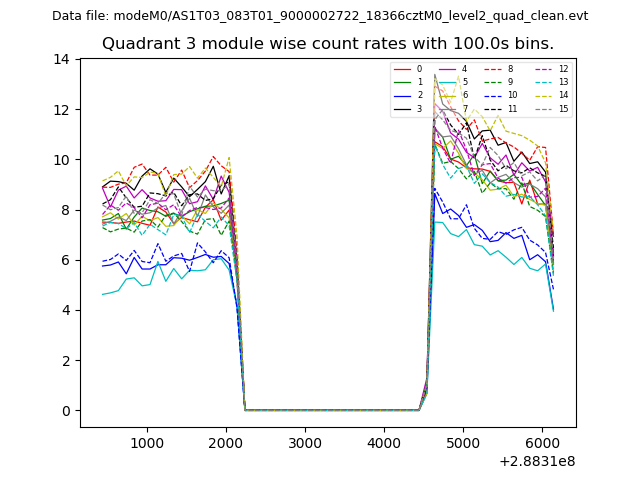
| Module-wise count rates for Quadrant A Data is divided into 100 sec bins |
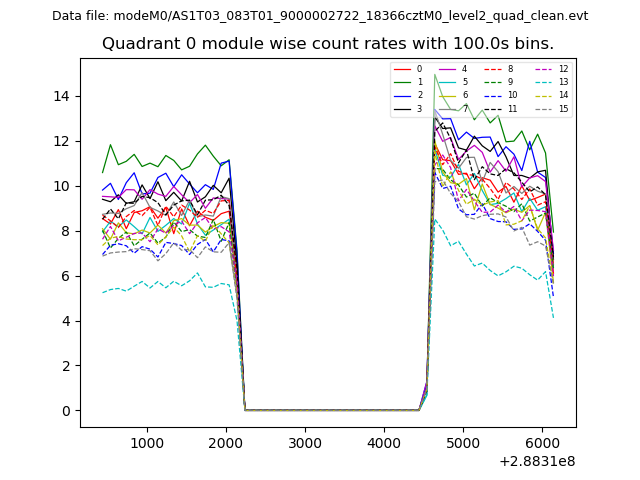 |
 |
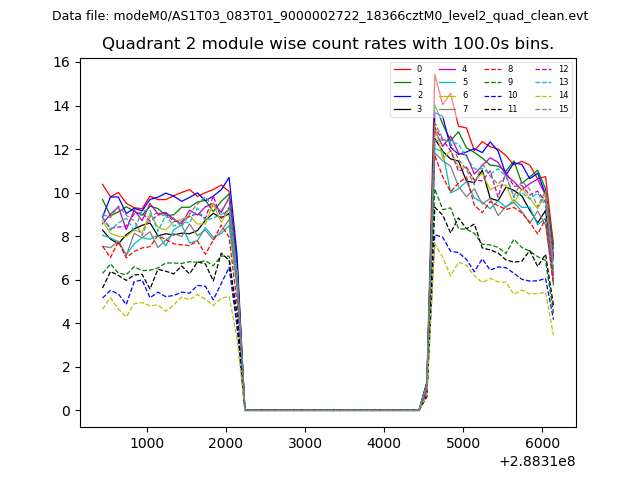
| Module-wise count rates for Quadrant B Data is divided into 100 sec bins |
 |
 |
| Module-wise count rates for Quadrant C Data is divided into 100 sec bins |
 |
 |
| Module-wise count rates for Quadrant D Data is divided into 100 sec bins |
 |
 |
| Parameter | Plot |
|---|---|
| CZT HV Monitor | 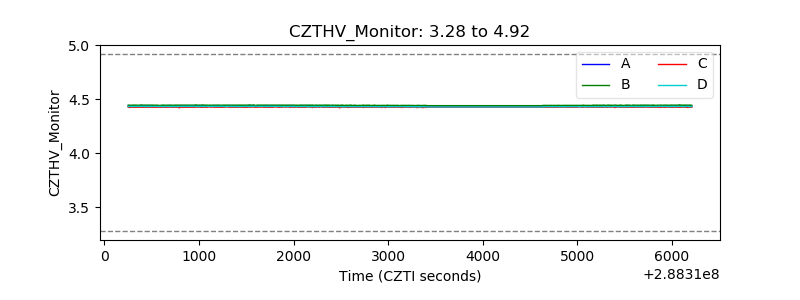 |
| D_VDD | 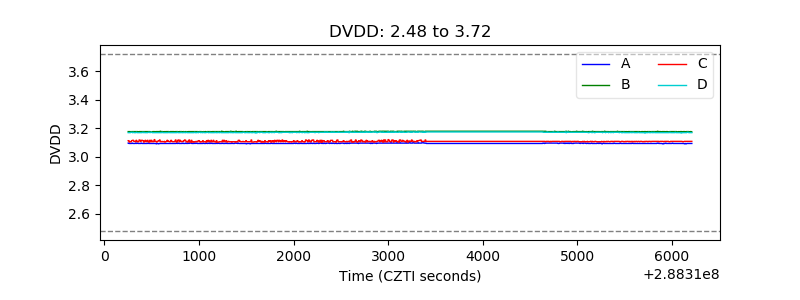 |
| Temperature 1 | 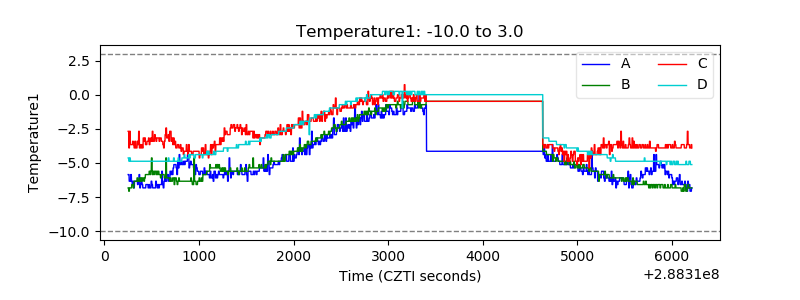 |
| Veto HV Monitor | 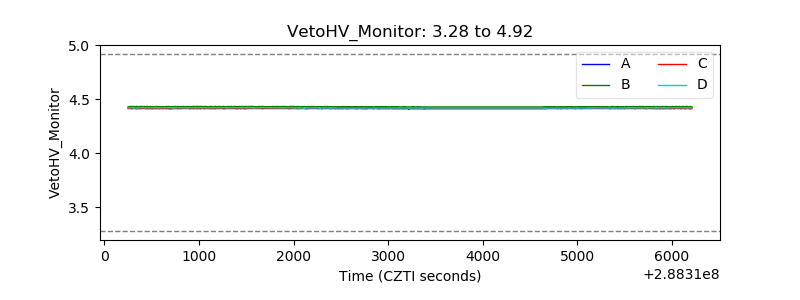 |
| Veto LLD |  |
| Alpha Counter | 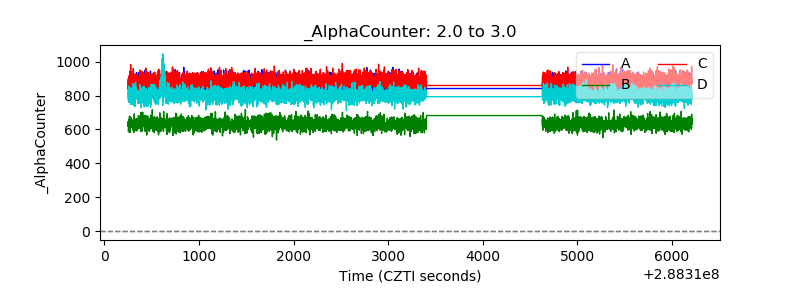 |
| _CPM_Rate | 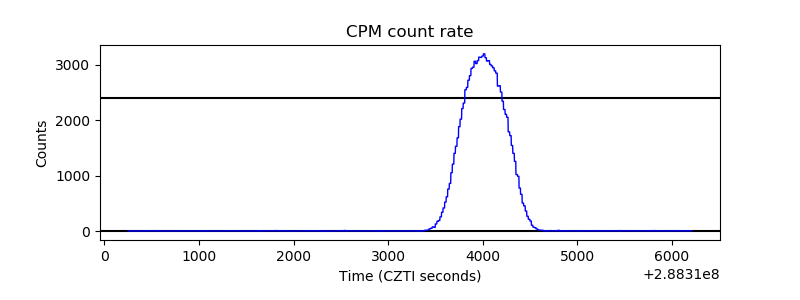 |
| CZT Counter | 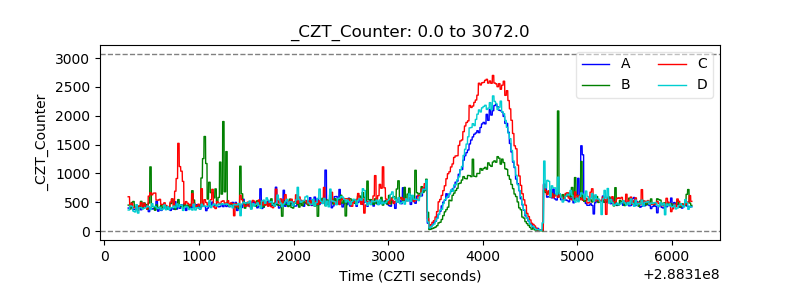 |
| +2.5 Volts monitor | 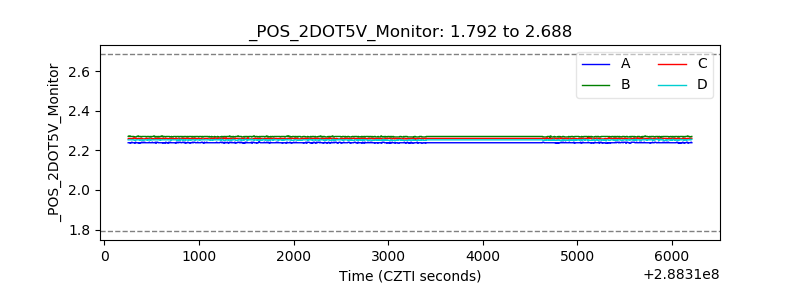 |
| +5 Volts monitor | 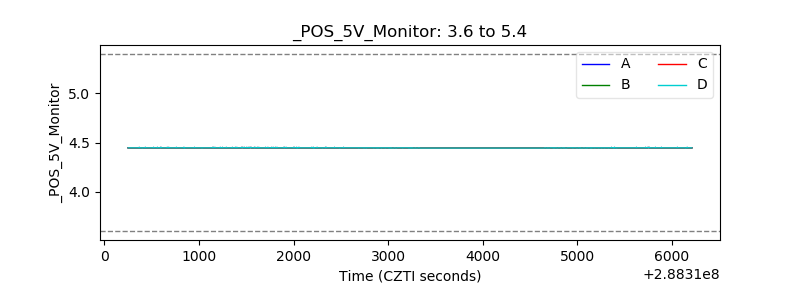 |
| _ROLL_ROT | 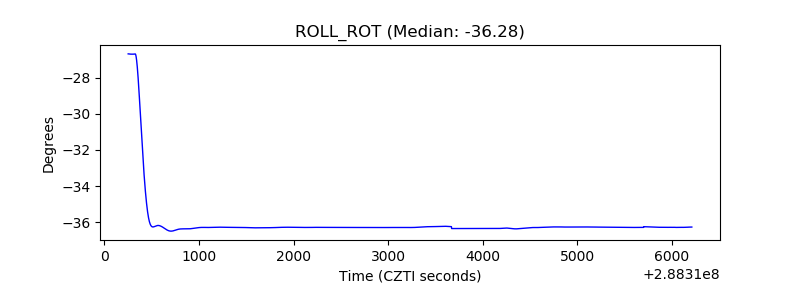 |
| _Roll_DEC | 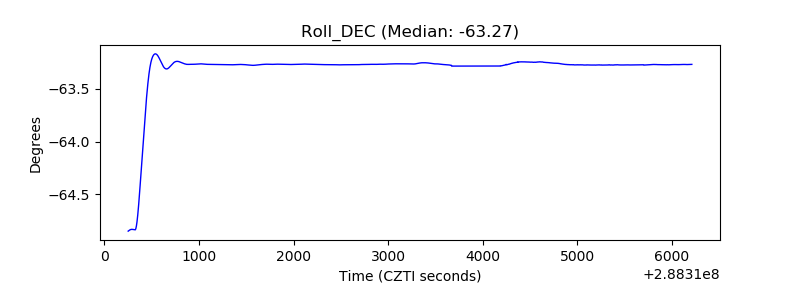 |
| _Roll_RA | 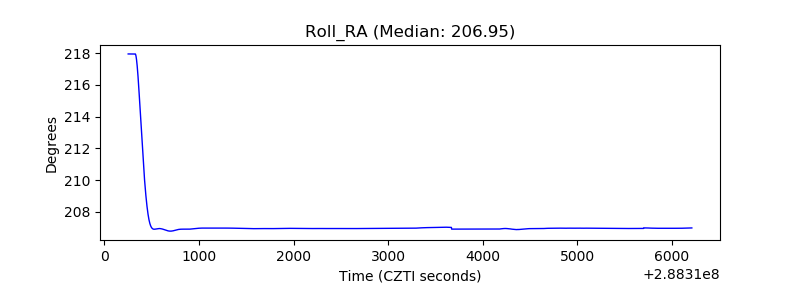 |
| Veto Counter | 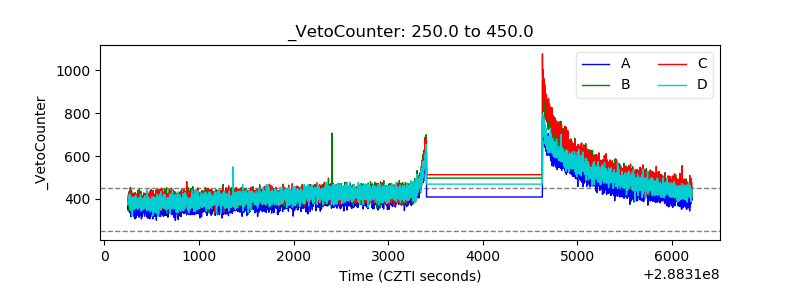 |