| Param | Original file | Final file |
|---|---|---|
| Filename | modeM0/AS1T03_083T01_9000002722_18368cztM0_level2.evt | modeM0/AS1T03_083T01_9000002722_18368cztM0_level2_quad_clean.evt |
| Size (bytes) | 415,163,520 | 100,762,560 |
| Size | 395.9 MB | 96.1 MB |
| Events in quadrant A | 2,809,431 | 671,221 |
| Events in quadrant B | 3,080,319 | 698,723 |
| Events in quadrant C | 3,049,309 | 661,810 |
| Events in quadrant D | 3,247,753 | 622,378 |
| Mode M9 | |||
|---|---|---|---|
| Quadrant | BADHDUFLAG | Total packets | Discarded packets |
| A | 0 | 13 | 0 |
| B | 0 | 13 | 0 |
| C | 0 | 13 | 0 |
| D | 0 | 13 | 0 |
| Mode M0 | |||
|---|---|---|---|
| Quadrant | BADHDUFLAG | Total packets | Discarded packets |
| A | 0 | 11818 | 1 |
| B | 0 | 12669 | 1 |
| C | 0 | 12396 | 1 |
| D | 0 | 13093 | 1 |
| Mode SS | |||
|---|---|---|---|
| Quadrant | BADHDUFLAG | Total packets | Discarded packets |
| A | 0 | 116 | 0 |
| B | 0 | 116 | 0 |
| C | 0 | 116 | 0 |
| D | 0 | 116 | 0 |
| Quadrant | Total seconds | Saturated seconds | Saturation percentage |
|---|---|---|---|
| A | 5682 | 19 | 0.334389% |
| B | 5683 | 73 | 1.284533% |
| C | 5683 | 73 | 1.284533% |
| D | 5683 | 188 | 3.308112% |
Noise dominated data is calculated using 1-second bins in cleaned event files. If a bin has >2000 counts, and if more than 50% of those come from <1% of pixels, then it is considered to be noise-dominated and hence unusable.
| Quadrant | # 1 sec bins | Bins with >0 counts | Bins with >2000 counts | High rate bins dominated by noise | Noise dominated (total time) | Noise dominated (detector-on time) | Marked lightcurve |
|---|---|---|---|---|---|---|---|
| A | 6993 | 5683 | 4 | 4 | 0.06% | 0.07% | 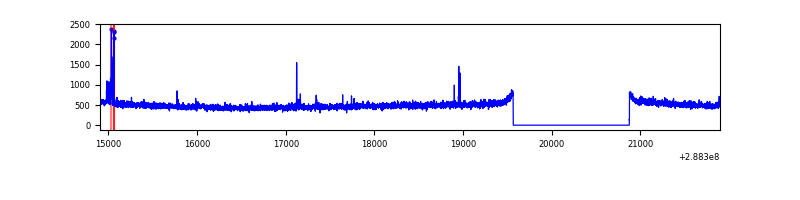 |
| B | 6994 | 5684 | 15 | 15 | 0.21% | 0.26% | 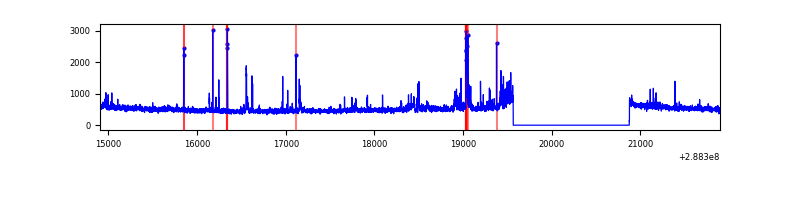 |
| C | 6994 | 5684 | 15 | 15 | 0.21% | 0.26% | 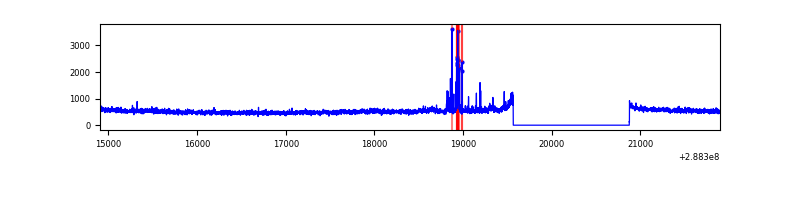 |
| D | 6994 | 5684 | 135 | 135 | 1.93% | 2.38% | 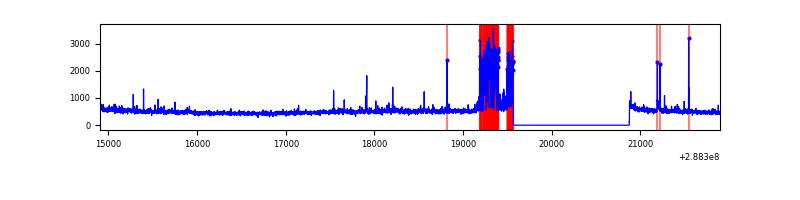 |
Top three noisy pixels from each quadrant. If the there are fewer than three noisy pixels in the level2.evt file, extra rows are filled as -1
| Pixel properties | Quadrant properties | ||||||
|---|---|---|---|---|---|---|---|
| Quadrant | DetID | PixID | Counts | Sigma | Mean | Median | Sigma |
| A | 4 | 2 | 46485 | 320.73 | 715 | 704 | 142.7 |
| A | 15 | 174 | 6563 | 41.05 | 715 | 704 | 142.7 |
| A | 0 | 226 | 6344 | 39.51 | 715 | 704 | 142.7 |
| B | 3 | 64 | 92160 | 679.21 | 727 | 711 | 134.6 |
| B | 7 | 220 | 74366 | 547.05 | 727 | 711 | 134.6 |
| B | 4 | 216 | 47898 | 350.47 | 727 | 711 | 134.6 |
| C | 0 | 207 | 116833 | 712.71 | 705 | 713 | 162.9 |
| C | 14 | 238 | 111711 | 681.27 | 705 | 713 | 162.9 |
| C | 3 | 233 | 72193 | 438.72 | 705 | 713 | 162.9 |
| D | 1 | 52 | 457248 | 2739.91 | 692 | 673 | 166.6 |
| D | 12 | 110 | 105850 | 631.17 | 692 | 673 | 166.6 |
| D | 2 | 234 | 24477 | 142.85 | 692 | 673 | 166.6 |
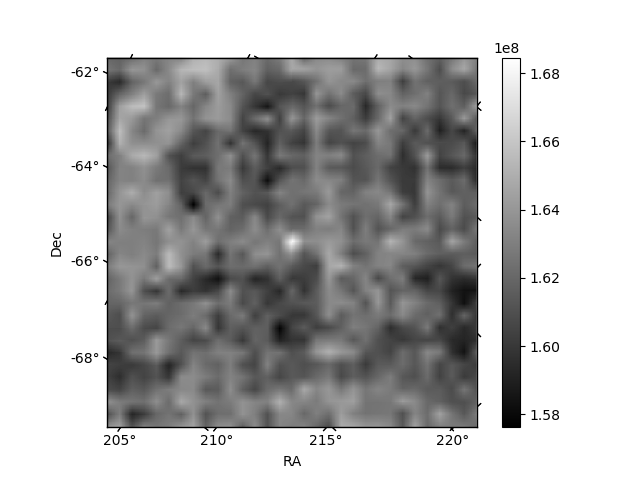
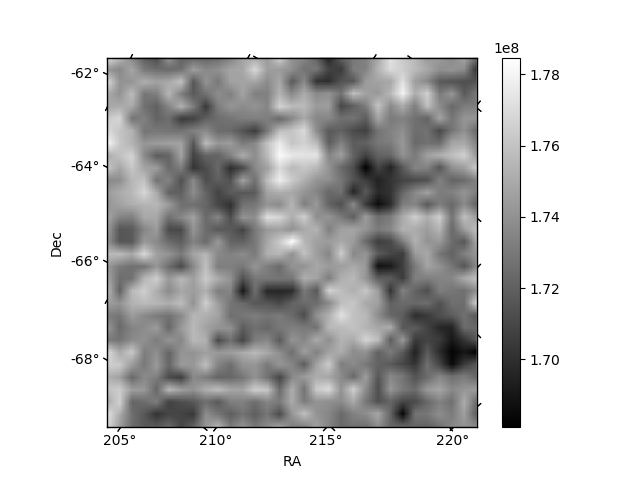
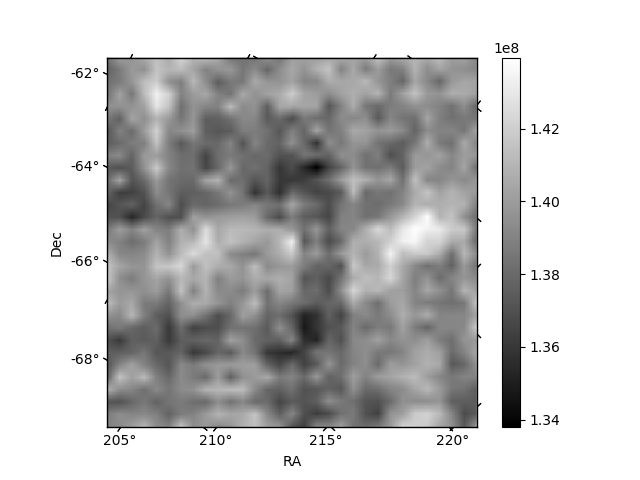
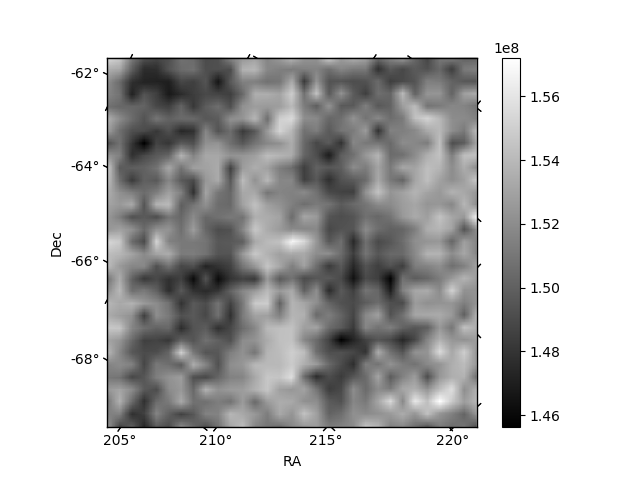
Histogram calculated using DETX and DETY for each event in the final _common_clean file
| Quadrant A | 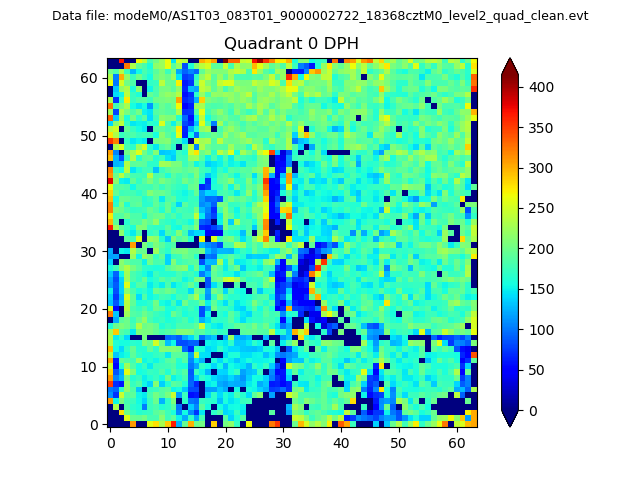 |
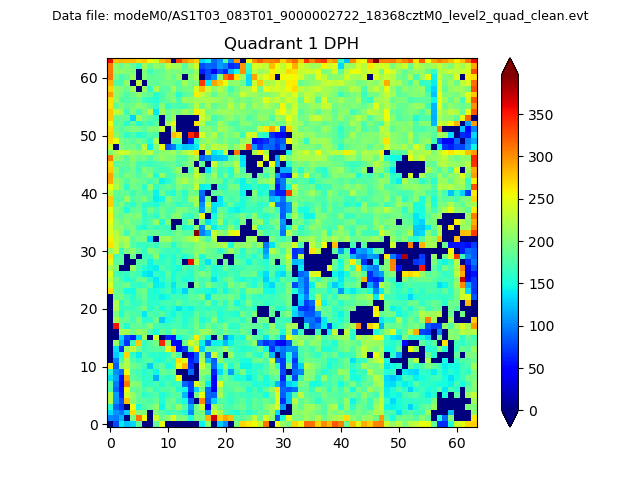 |
Quadrant B |
|---|---|---|---|
| Quadrant D |  |
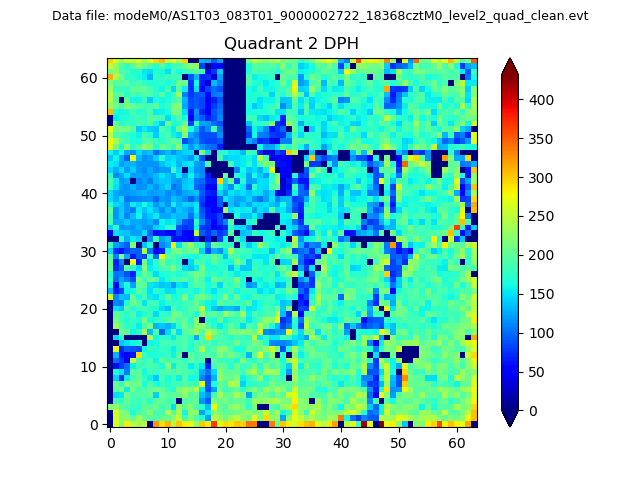 |
Quadrant C |
| Plot type | Count rate plots | Images |
|---|---|---|
| Comparison with Poisson distribution Blue bars denote a histogram of data divided into 1 sec bins. Red curve is a Poisson curve with rate = median count rate of data. |
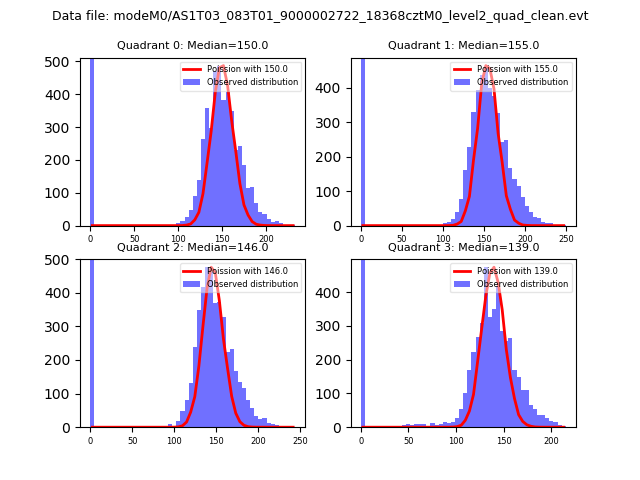 |
 |
| Quadrant-wise count rates Data is divided into 100 sec bins |
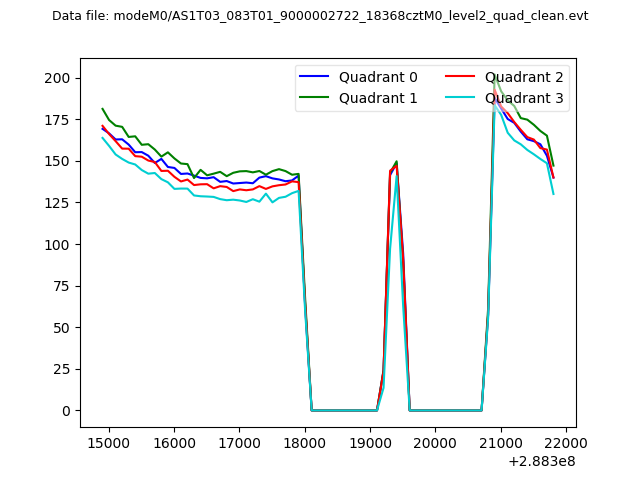 |
|
| Module-wise count rates for Quadrant A Data is divided into 100 sec bins |
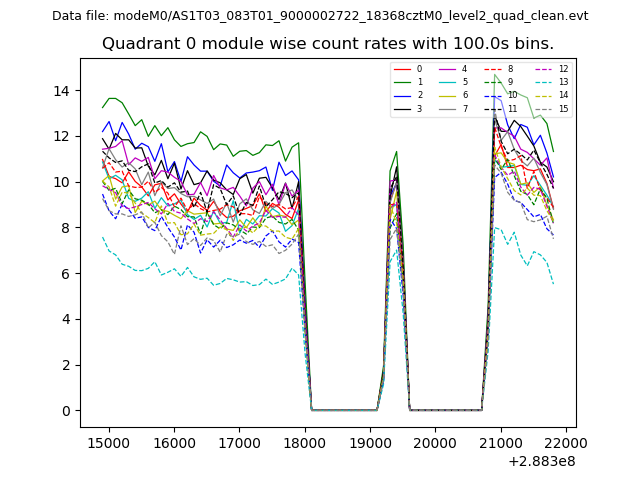 |
 |
| Module-wise count rates for Quadrant B Data is divided into 100 sec bins |
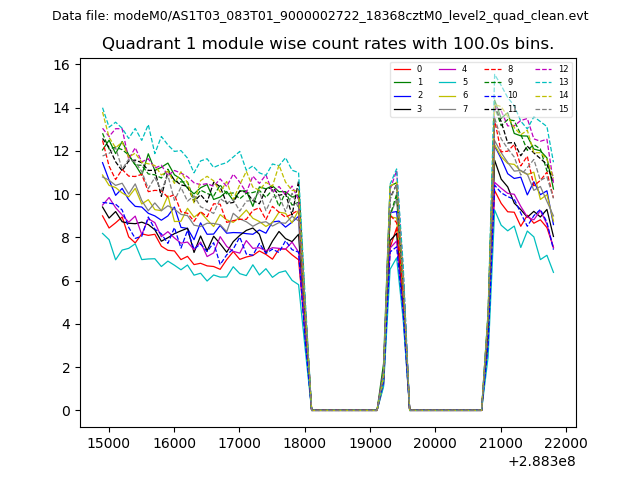 |
 |
| Module-wise count rates for Quadrant C Data is divided into 100 sec bins |
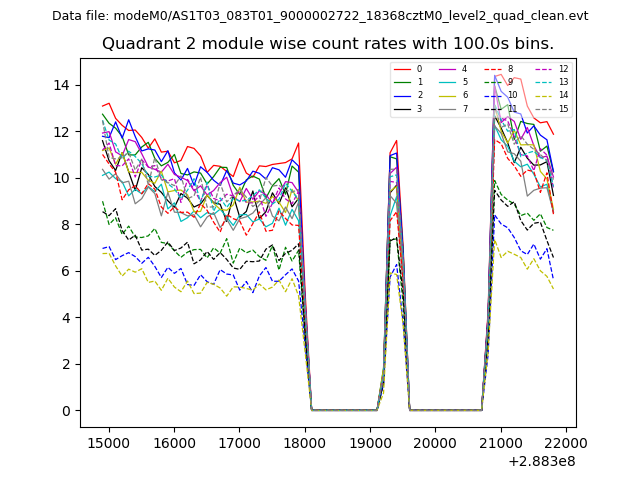 |
 |
| Module-wise count rates for Quadrant D Data is divided into 100 sec bins |
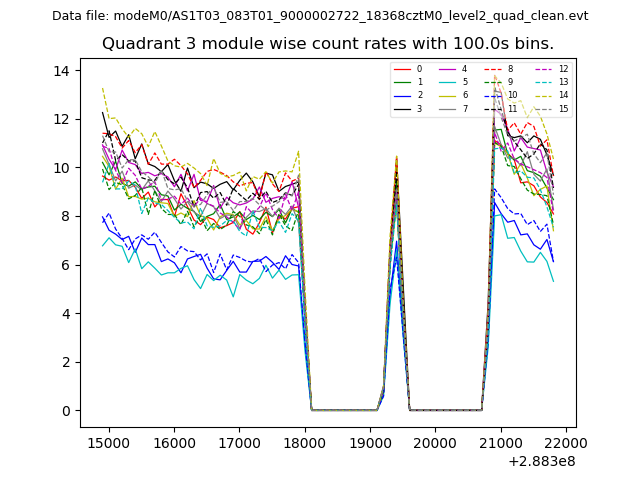 |
 |
| Parameter | Plot |
|---|---|
| CZT HV Monitor | 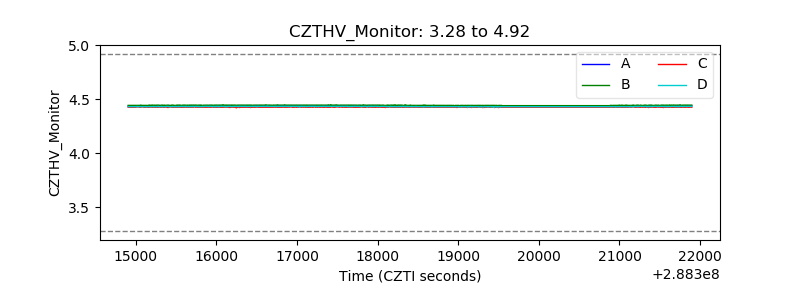 |
| D_VDD | 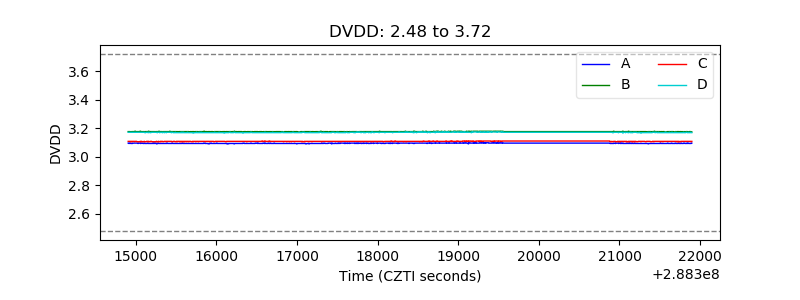 |
| Temperature 1 | 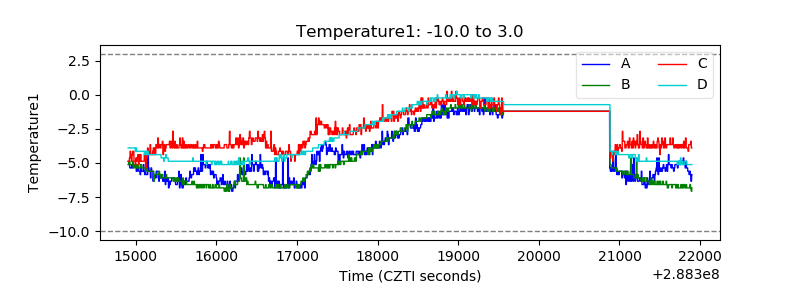 |
| Veto HV Monitor | 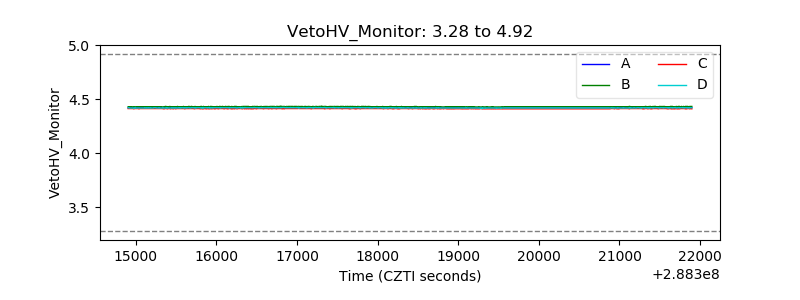 |
| Veto LLD | 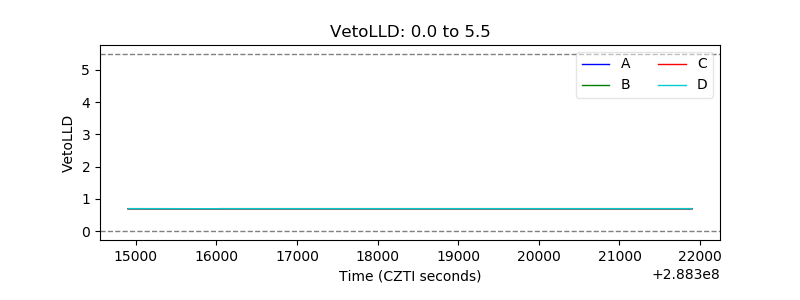 |
| Alpha Counter | 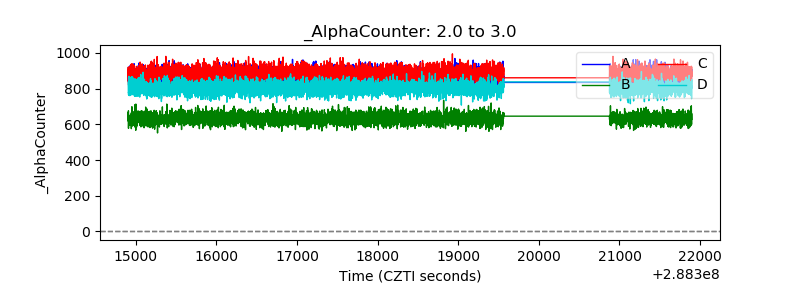 |
| _CPM_Rate | 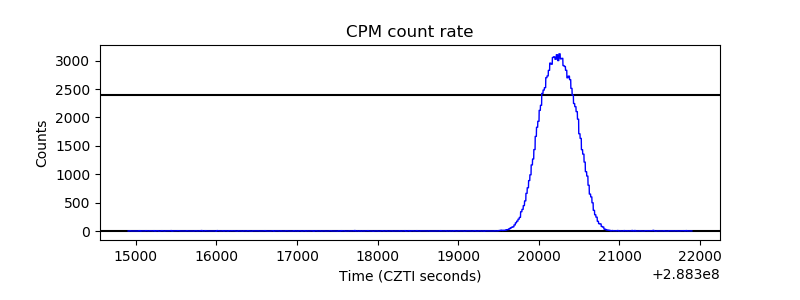 |
| CZT Counter | 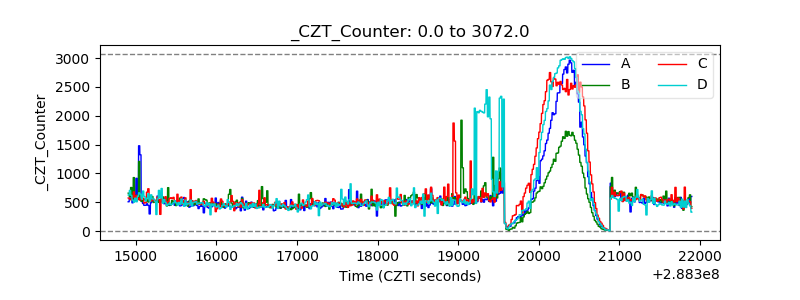 |
| +2.5 Volts monitor |  |
| +5 Volts monitor |  |
| _ROLL_ROT | 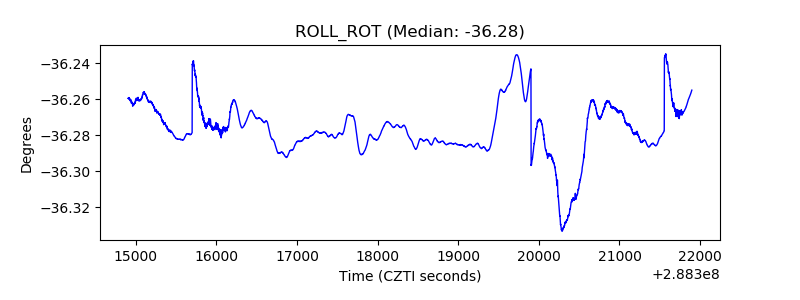 |
| _Roll_DEC | 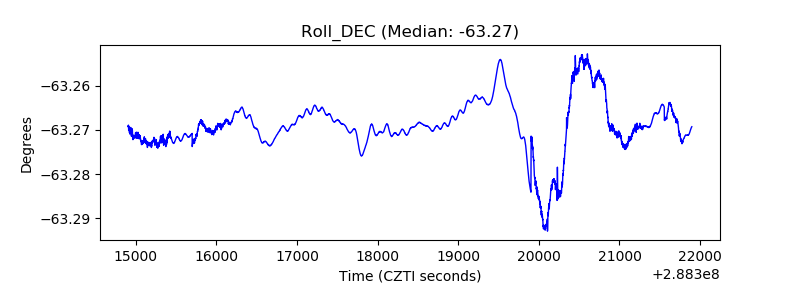 |
| _Roll_RA | 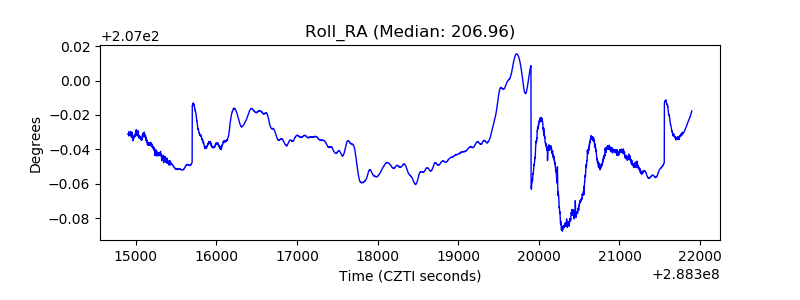 |
| Veto Counter | 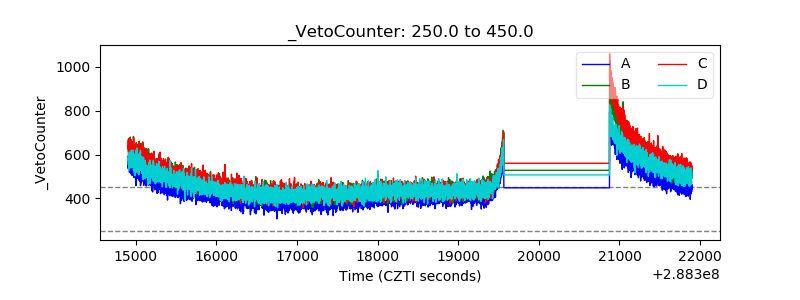 |