| Param | Original file | Final file |
|---|---|---|
| Filename | modeM0/AS1A06_006T01_9000002724_18369cztM0_level2.evt | modeM0/AS1A06_006T01_9000002724_18369cztM0_level2_quad_clean.evt |
| Size (bytes) | 446,976,000 | 66,093,120 |
| Size | 426.3 MB | 63.0 MB |
| Events in quadrant A | 3,142,806 | 395,117 |
| Events in quadrant B | 3,289,936 | 402,382 |
| Events in quadrant C | 3,428,939 | 392,153 |
| Events in quadrant D | 3,259,505 | 384,338 |
| Mode M0 | |||
|---|---|---|---|
| Quadrant | BADHDUFLAG | Total packets | Discarded packets |
| A | 0 | 12824 | 2 |
| B | 0 | 13248 | 2 |
| C | 0 | 13681 | 2 |
| D | 0 | 13245 | 2 |
| Mode SS | |||
|---|---|---|---|
| Quadrant | BADHDUFLAG | Total packets | Discarded packets |
| A | 0 | 124 | 0 |
| B | 0 | 124 | 0 |
| C | 0 | 124 | 0 |
| D | 0 | 124 | 0 |
| Mode M9 | |||
|---|---|---|---|
| Quadrant | BADHDUFLAG | Total packets | Discarded packets |
| A | 0 | 14 | 0 |
| B | 0 | 14 | 0 |
| C | 0 | 14 | 0 |
| D | 0 | 14 | 0 |
| Quadrant | Total seconds | Saturated seconds | Saturation percentage |
|---|---|---|---|
| A | 6119 | 27 | 0.441249% |
| B | 6119 | 35 | 0.571989% |
| C | 6119 | 86 | 1.405458% |
| D | 6119 | 38 | 0.621017% |
Noise dominated data is calculated using 1-second bins in cleaned event files. If a bin has >2000 counts, and if more than 50% of those come from <1% of pixels, then it is considered to be noise-dominated and hence unusable.
| Quadrant | # 1 sec bins | Bins with >0 counts | Bins with >2000 counts | High rate bins dominated by noise | Noise dominated (total time) | Noise dominated (detector-on time) | Marked lightcurve |
|---|---|---|---|---|---|---|---|
| A | 7449 | 6120 | 2 | 2 | 0.03% | 0.03% | 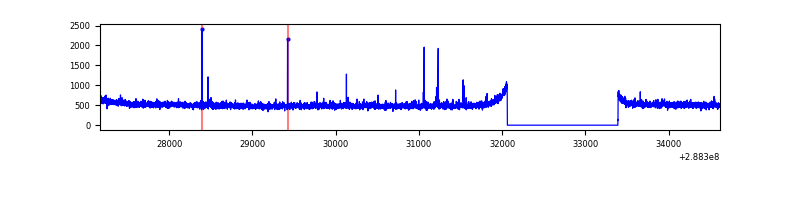 |
| B | 7449 | 6120 | 0 | 0 | 0.00% | 0.00% | 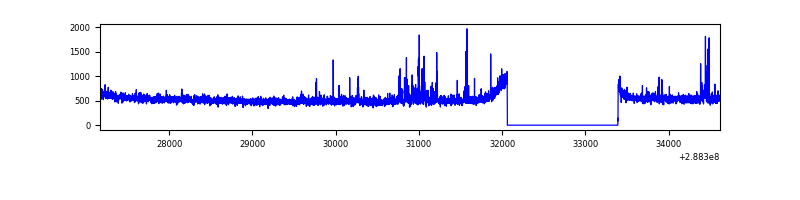 |
| C | 7449 | 6120 | 7 | 7 | 0.09% | 0.11% | 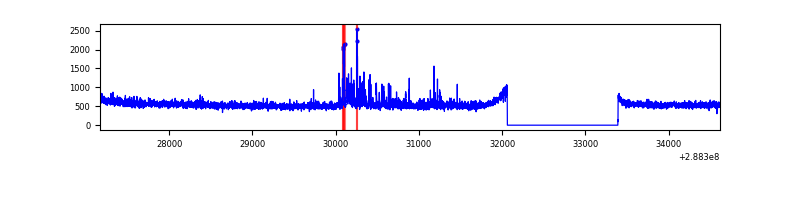 |
| D | 7449 | 6120 | 9 | 9 | 0.12% | 0.15% | 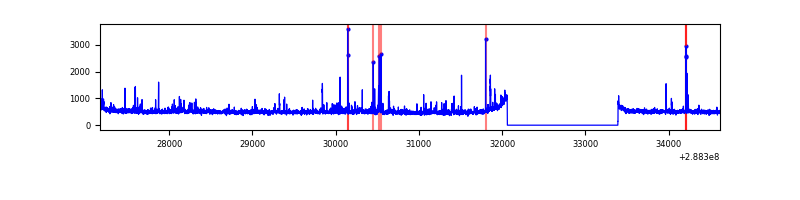 |
Top three noisy pixels from each quadrant. If the there are fewer than three noisy pixels in the level2.evt file, extra rows are filled as -1
| Pixel properties | Quadrant properties | ||||||
|---|---|---|---|---|---|---|---|
| Quadrant | DetID | PixID | Counts | Sigma | Mean | Median | Sigma |
| A | 15 | 174 | 27607 | 165.36 | 805 | 791 | 162.2 |
| A | 4 | 2 | 13858 | 80.58 | 805 | 791 | 162.2 |
| A | 0 | 226 | 7131 | 39.1 | 805 | 791 | 162.2 |
| B | 7 | 220 | 41854 | 270.14 | 809 | 789 | 152.0 |
| B | 0 | 189 | 39683 | 255.85 | 809 | 789 | 152.0 |
| B | 10 | 245 | 22727 | 144.31 | 809 | 789 | 152.0 |
| C | 0 | 207 | 142849 | 786.02 | 780 | 786 | 180.7 |
| C | 3 | 233 | 122731 | 674.71 | 780 | 786 | 180.7 |
| C | 14 | 238 | 121904 | 670.14 | 780 | 786 | 180.7 |
| D | 1 | 52 | 158303 | 830.29 | 786 | 766 | 189.7 |
| D | 14 | 34 | 47911 | 248.47 | 786 | 766 | 189.7 |
| D | 12 | 110 | 27656 | 141.72 | 786 | 766 | 189.7 |
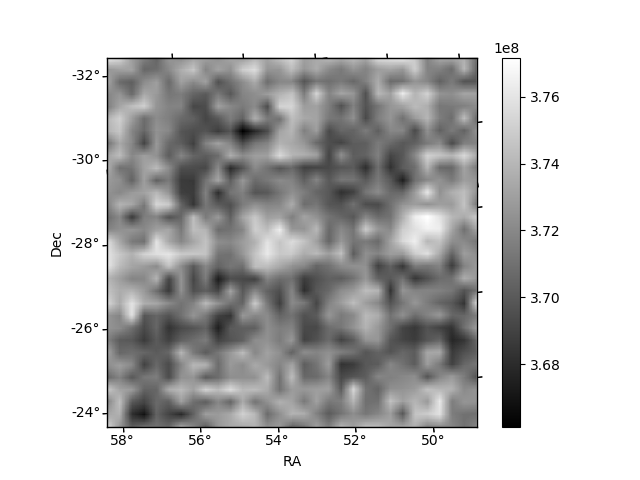
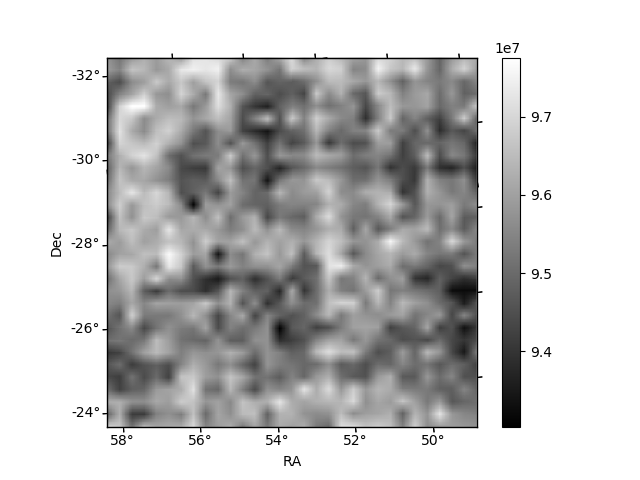
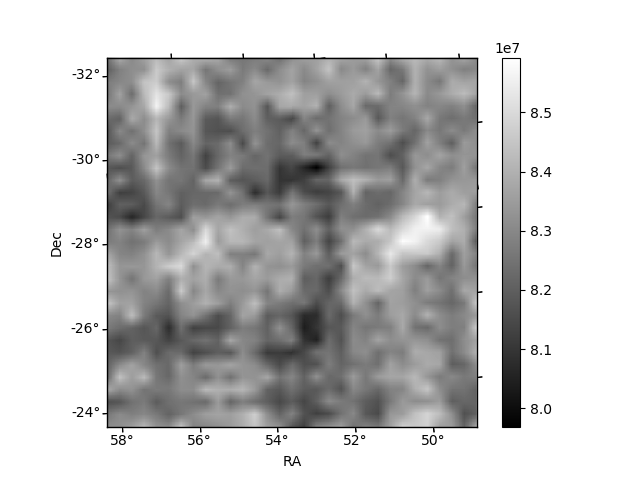
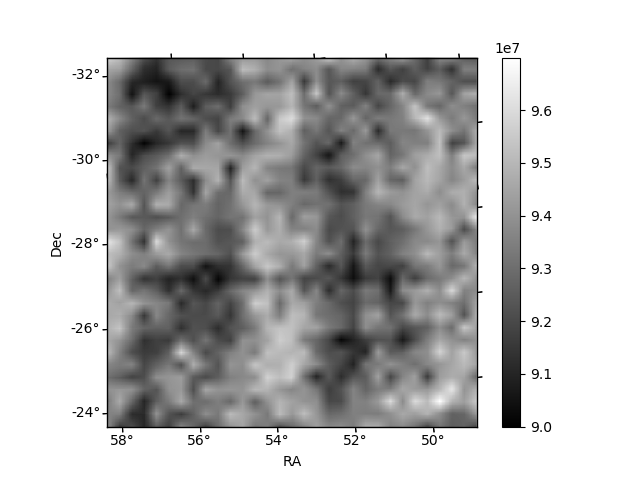
Histogram calculated using DETX and DETY for each event in the final _common_clean file
| Quadrant A | 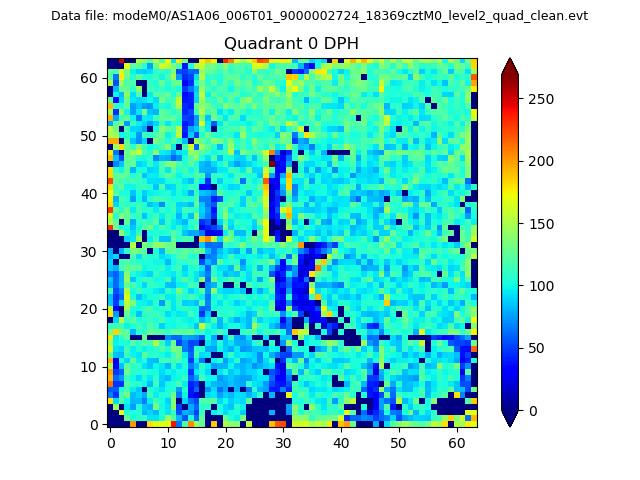 |
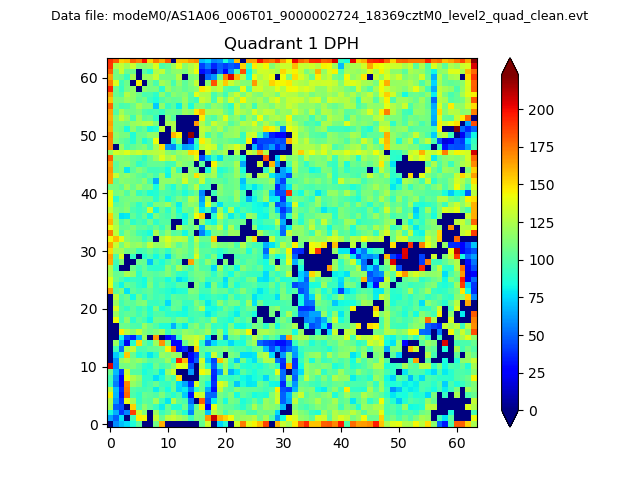 |
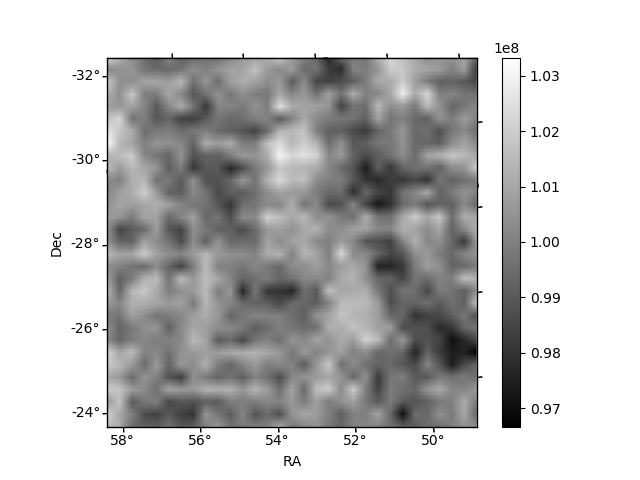
Quadrant B |
|---|---|---|---|
| Quadrant D | 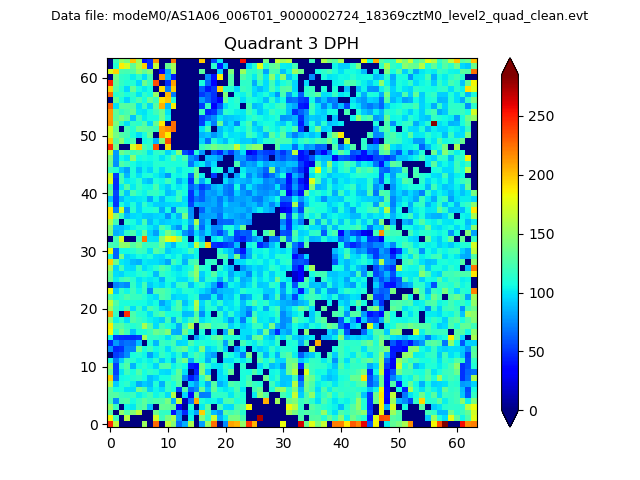 |
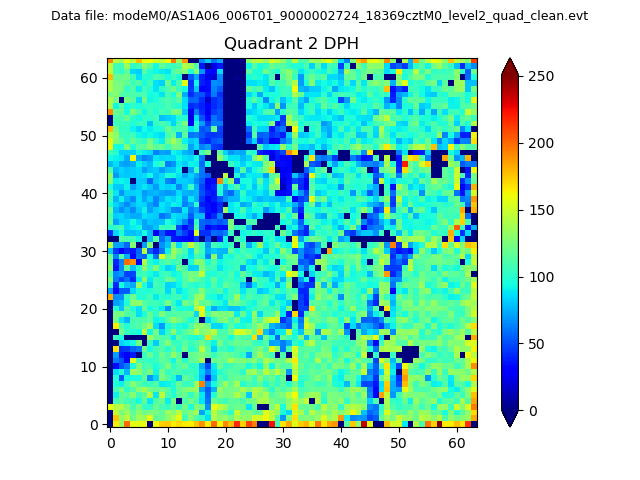 |
Quadrant C |
| Plot type | Count rate plots | Images |
|---|---|---|
| Comparison with Poisson distribution Blue bars denote a histogram of data divided into 1 sec bins. Red curve is a Poisson curve with rate = median count rate of data. |
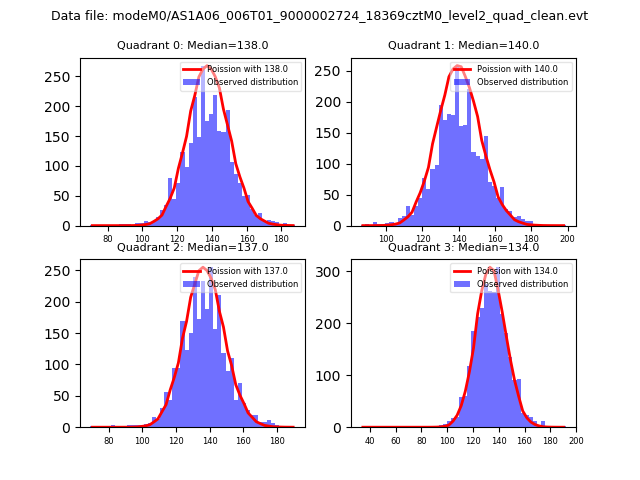 |
 |
| Quadrant-wise count rates Data is divided into 100 sec bins |
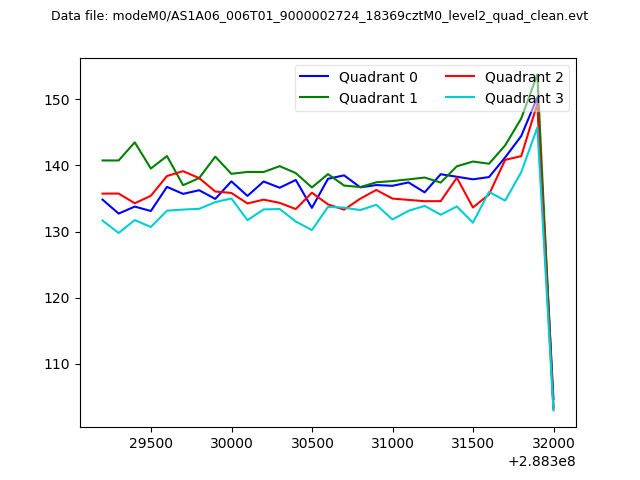 |
|
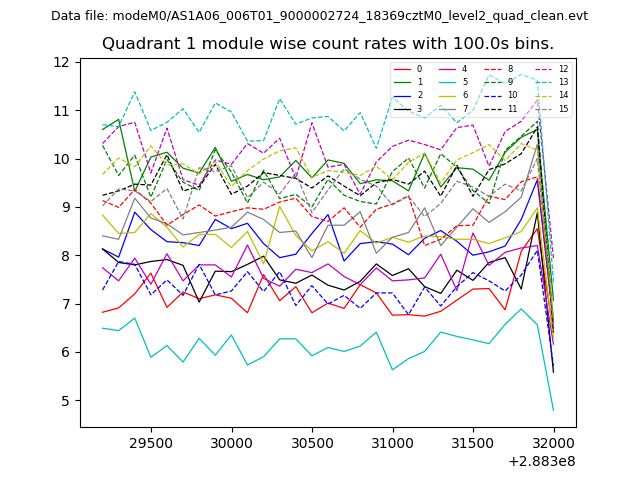
| Module-wise count rates for Quadrant A Data is divided into 100 sec bins |
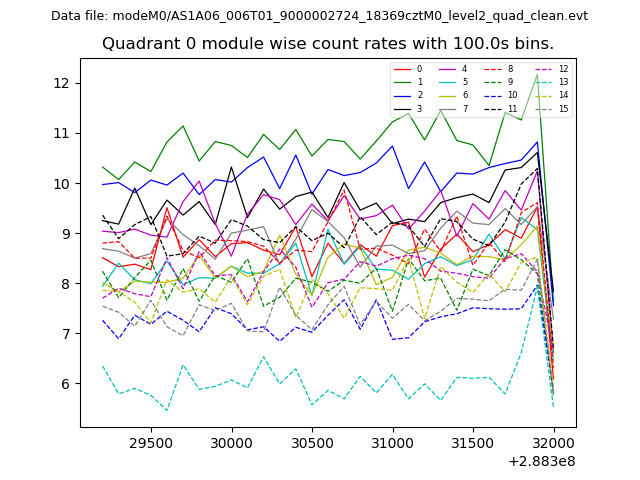 |
 |
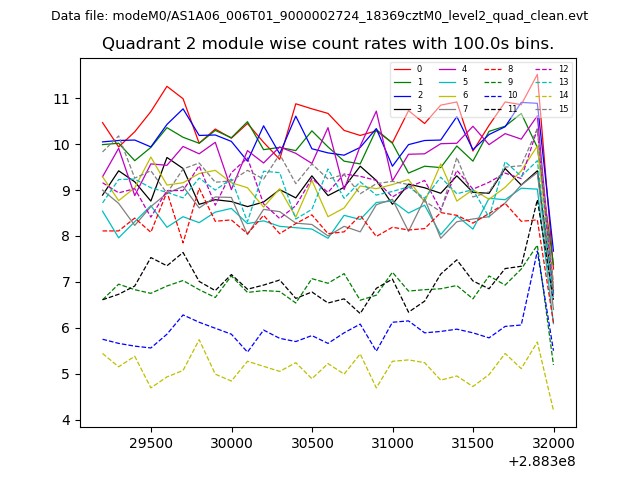
| Module-wise count rates for Quadrant B Data is divided into 100 sec bins |
 |
 |
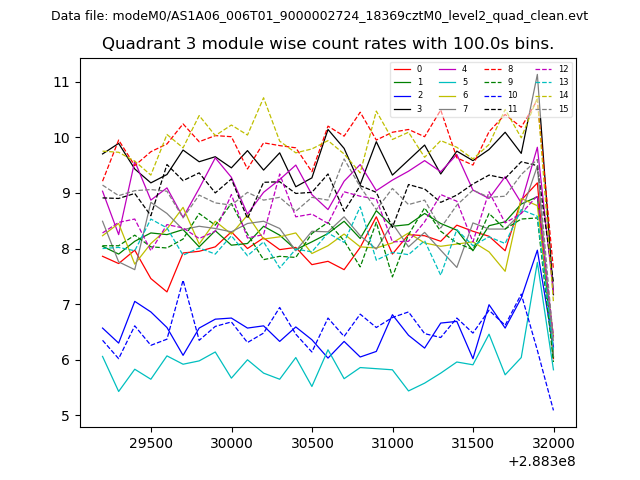
| Module-wise count rates for Quadrant C Data is divided into 100 sec bins |
 |
 |
| Module-wise count rates for Quadrant D Data is divided into 100 sec bins |
 |
 |
| Parameter | Plot |
|---|---|
| CZT HV Monitor | 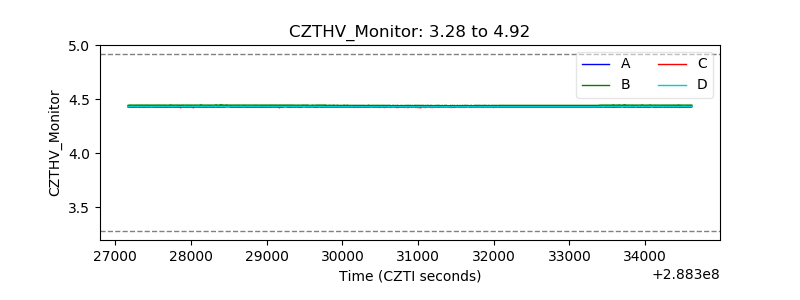 |
| D_VDD | 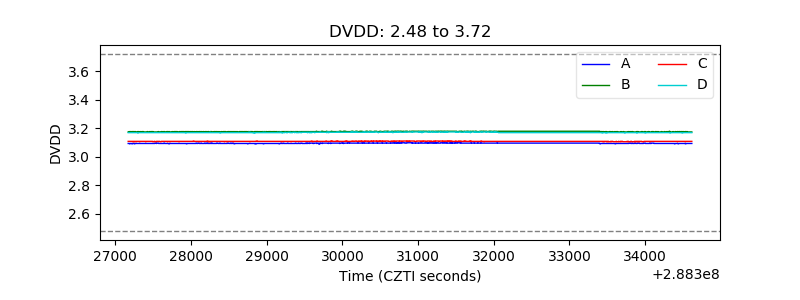 |
| Temperature 1 | 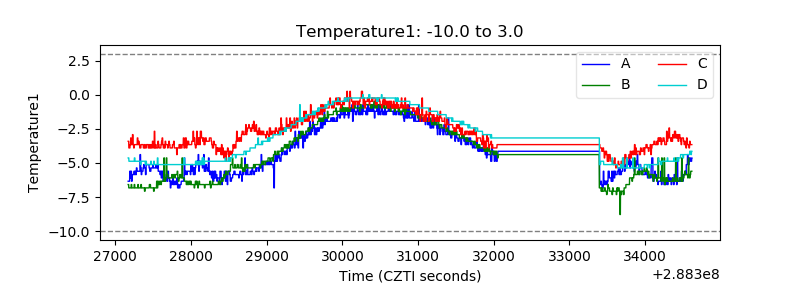 |
| Veto HV Monitor |  |
| Veto LLD | 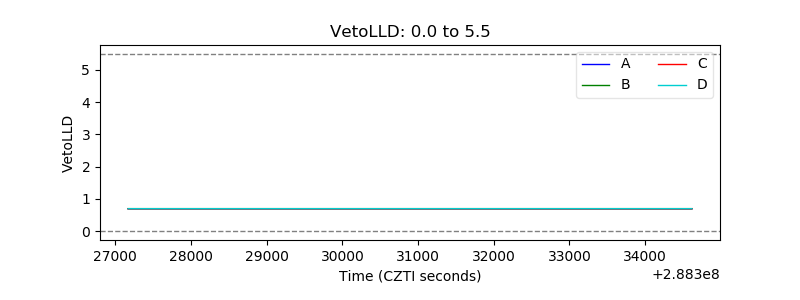 |
| Alpha Counter | 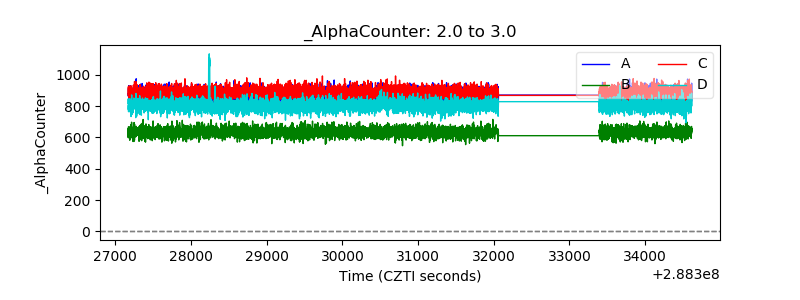 |
| _CPM_Rate | 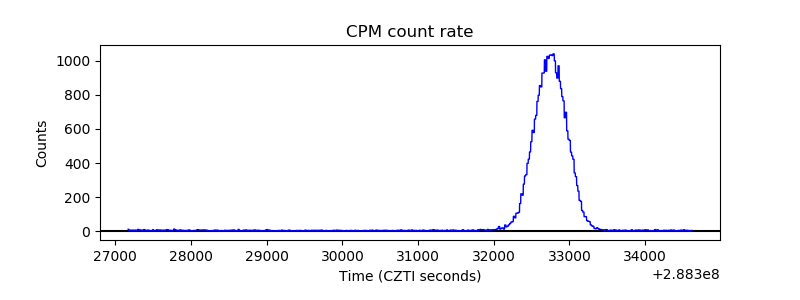 |
| CZT Counter | 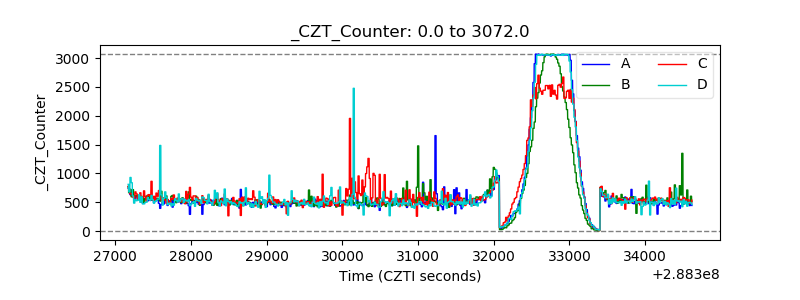 |
| +2.5 Volts monitor |  |
| +5 Volts monitor | 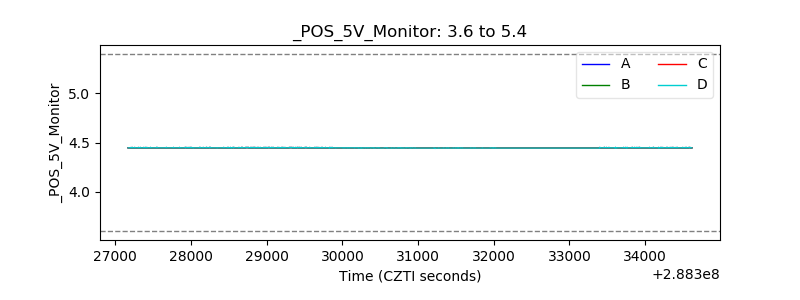 |
| _ROLL_ROT | 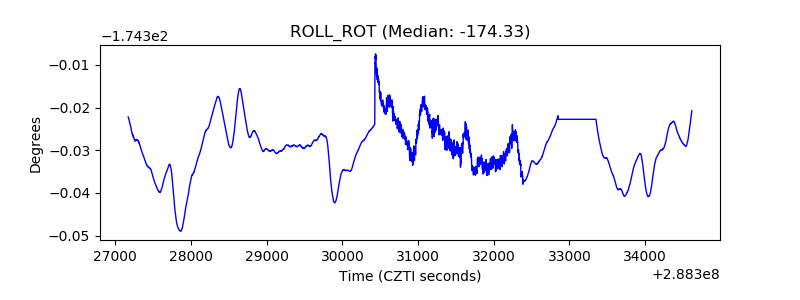 |
| _Roll_DEC | 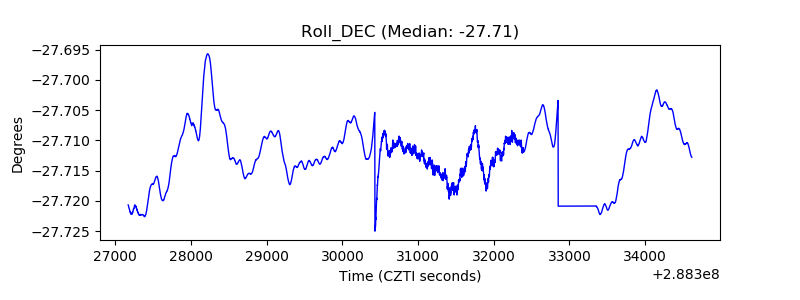 |
| _Roll_RA | 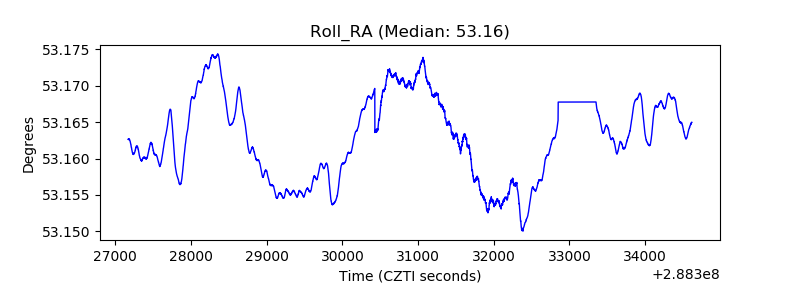 |
| Veto Counter | 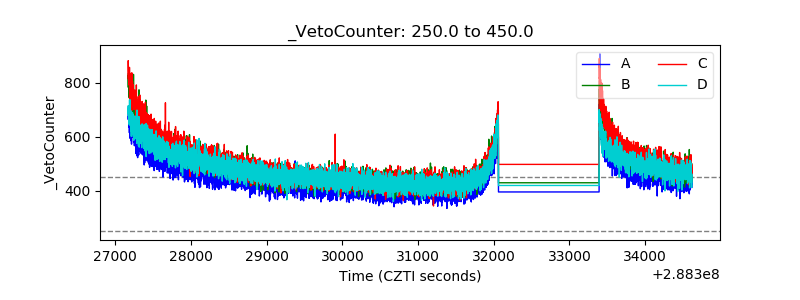 |