| Param | Original file | Final file |
|---|---|---|
| Filename | modeM0/AS1A06_006T01_9000002724_18370cztM0_level2.evt | modeM0/AS1A06_006T01_9000002724_18370cztM0_level2_quad_clean.evt |
| Size (bytes) | 496,468,800 | 78,753,600 |
| Size | 473.5 MB | 75.1 MB |
| Events in quadrant A | 3,287,958 | 488,739 |
| Events in quadrant B | 3,820,367 | 489,013 |
| Events in quadrant C | 3,739,551 | 479,243 |
| Events in quadrant D | 3,742,464 | 470,325 |
| Mode M0 | |||
|---|---|---|---|
| Quadrant | BADHDUFLAG | Total packets | Discarded packets |
| A | 0 | 13646 | 2 |
| B | 0 | 15188 | 2 |
| C | 0 | 14938 | 3 |
| D | 0 | 15259 | 2 |
| Mode SS | |||
|---|---|---|---|
| Quadrant | BADHDUFLAG | Total packets | Discarded packets |
| A | 0 | 132 | 0 |
| B | 0 | 132 | 0 |
| C | 0 | 132 | 0 |
| D | 0 | 132 | 0 |
| Mode M9 | |||
|---|---|---|---|
| Quadrant | BADHDUFLAG | Total packets | Discarded packets |
| A | 0 | 11 | 0 |
| B | 0 | 12 | 0 |
| C | 0 | 12 | 0 |
| D | 0 | 12 | 0 |
| Quadrant | Total seconds | Saturated seconds | Saturation percentage |
|---|---|---|---|
| A | 6562 | 60 | 0.914355% |
| B | 6562 | 162 | 2.468760% |
| C | 6561 | 170 | 2.591068% |
| D | 6561 | 139 | 2.118579% |
Noise dominated data is calculated using 1-second bins in cleaned event files. If a bin has >2000 counts, and if more than 50% of those come from <1% of pixels, then it is considered to be noise-dominated and hence unusable.
| Quadrant | # 1 sec bins | Bins with >0 counts | Bins with >2000 counts | High rate bins dominated by noise | Noise dominated (total time) | Noise dominated (detector-on time) | Marked lightcurve |
|---|---|---|---|---|---|---|---|
| A | 7627 | 6563 | 1 | 1 | 0.01% | 0.02% | 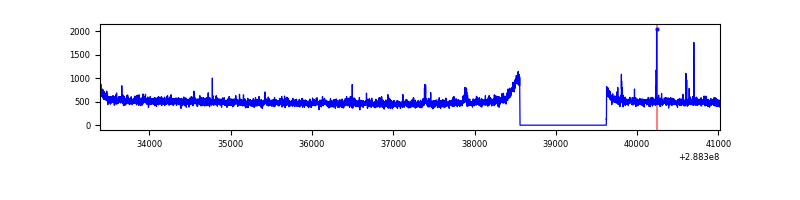 |
| B | 7627 | 6563 | 49 | 49 | 0.64% | 0.75% | 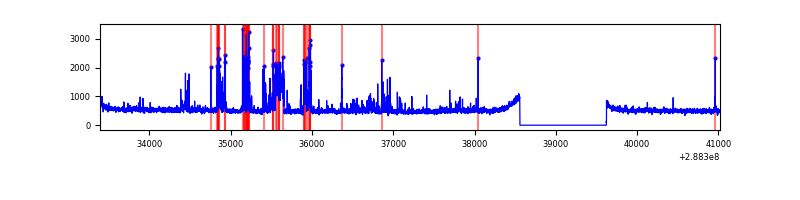 |
| C | 7626 | 6562 | 63 | 63 | 0.83% | 0.96% | 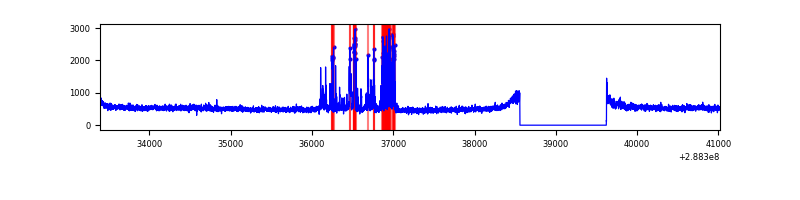 |
| D | 7626 | 6562 | 66 | 66 | 0.87% | 1.01% | 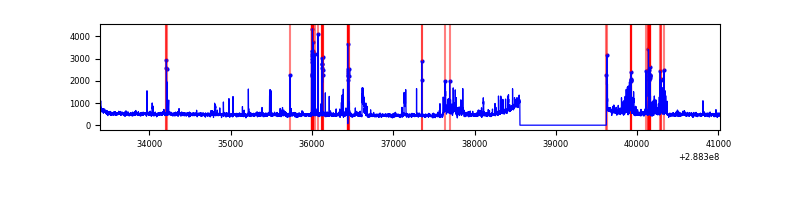 |
Top three noisy pixels from each quadrant. If the there are fewer than three noisy pixels in the level2.evt file, extra rows are filled as -1
| Pixel properties | Quadrant properties | ||||||
|---|---|---|---|---|---|---|---|
| Quadrant | DetID | PixID | Counts | Sigma | Mean | Median | Sigma |
| A | 4 | 2 | 18784 | 105.25 | 843 | 825 | 170.6 |
| A | 15 | 174 | 12772 | 70.02 | 843 | 825 | 170.6 |
| A | 11 | 29 | 12617 | 69.11 | 843 | 825 | 170.6 |
| B | 10 | 245 | 434054 | 2690.26 | 841 | 822 | 161.0 |
| B | 7 | 220 | 46960 | 286.51 | 841 | 822 | 161.0 |
| B | 12 | 111 | 18219 | 108.03 | 841 | 822 | 161.0 |
| C | 0 | 207 | 360131 | 1899.72 | 810 | 817 | 189.1 |
| C | 14 | 238 | 124728 | 655.13 | 810 | 817 | 189.1 |
| C | 3 | 233 | 99476 | 521.62 | 810 | 817 | 189.1 |
| D | 1 | 52 | 563864 | 2821.17 | 819 | 794 | 199.6 |
| D | 14 | 34 | 33624 | 164.49 | 819 | 794 | 199.6 |
| D | 2 | 234 | 28230 | 137.46 | 819 | 794 | 199.6 |
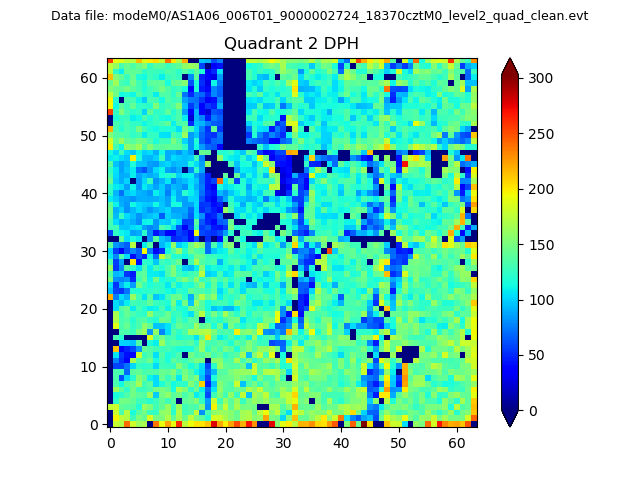
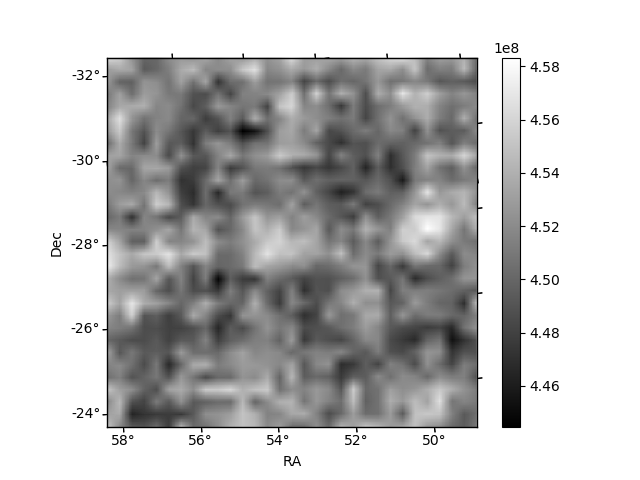
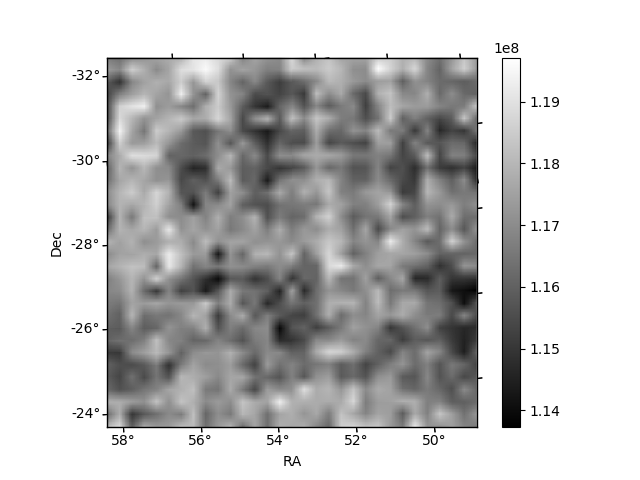
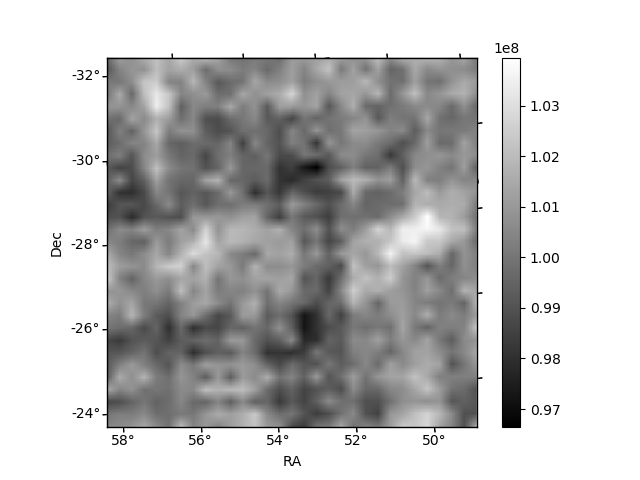
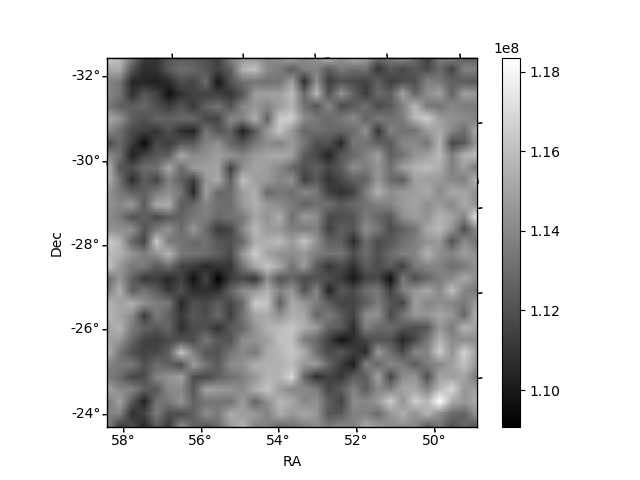
Histogram calculated using DETX and DETY for each event in the final _common_clean file
| Quadrant A | 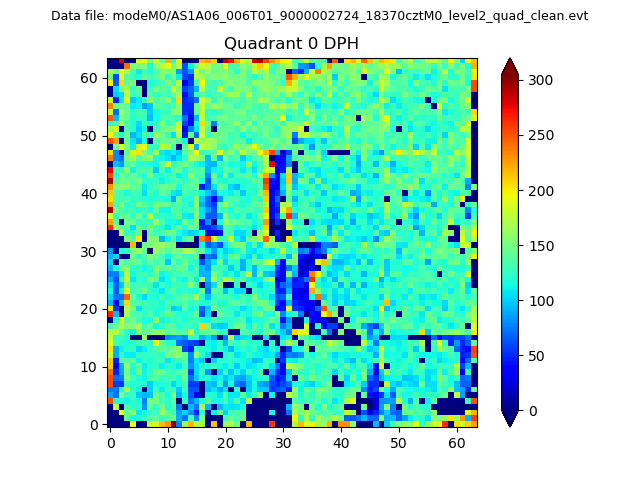 |
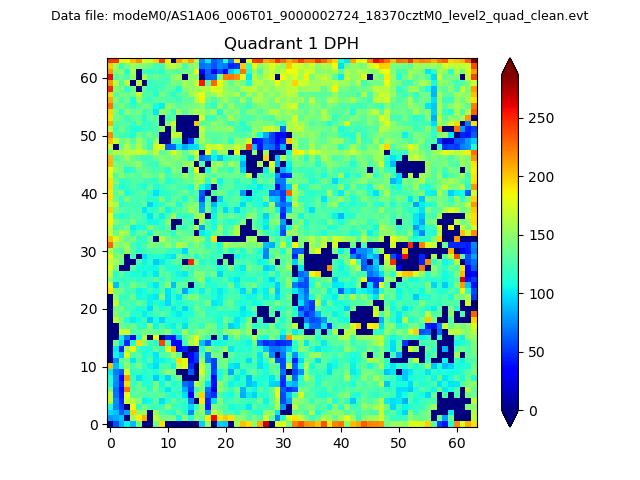 |
Quadrant B |
|---|---|---|---|
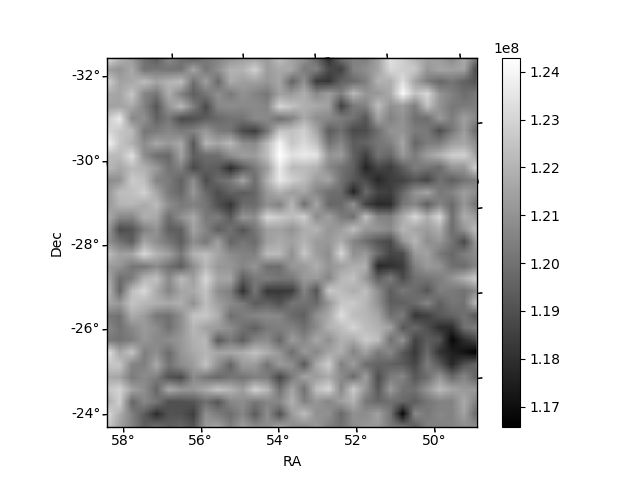
| Quadrant D | 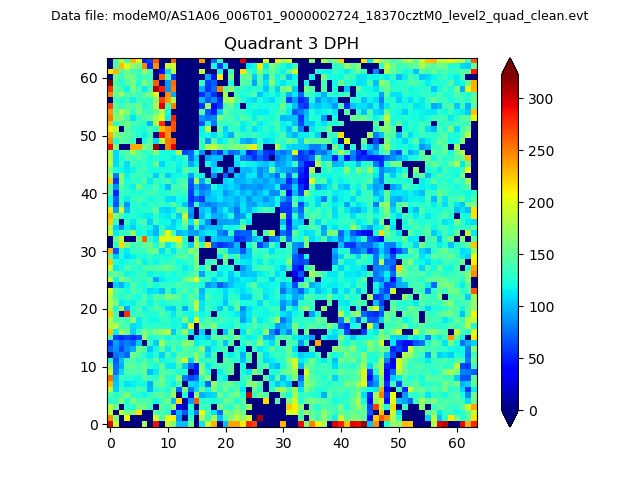 |
 |
Quadrant C |
| Plot type | Count rate plots | Images |
|---|---|---|
| Comparison with Poisson distribution Blue bars denote a histogram of data divided into 1 sec bins. Red curve is a Poisson curve with rate = median count rate of data. |
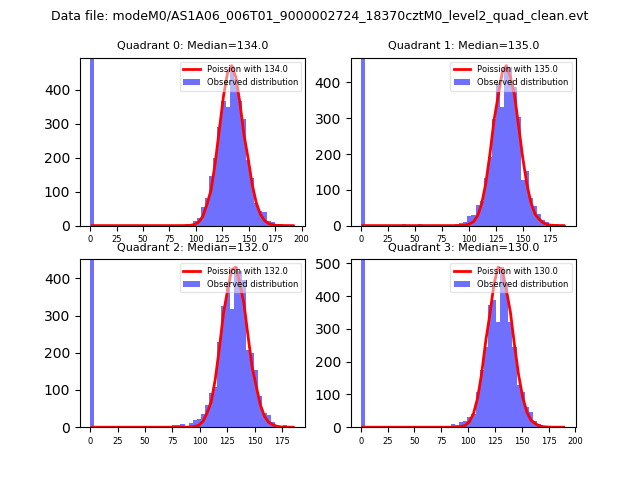 |
 |
| Quadrant-wise count rates Data is divided into 100 sec bins |
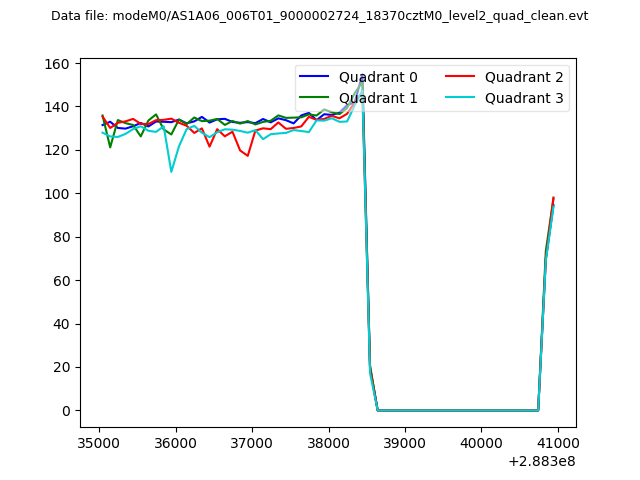 |
|
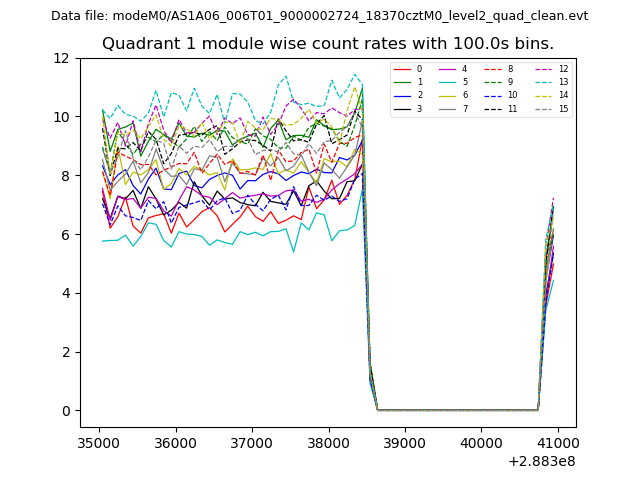
| Module-wise count rates for Quadrant A Data is divided into 100 sec bins |
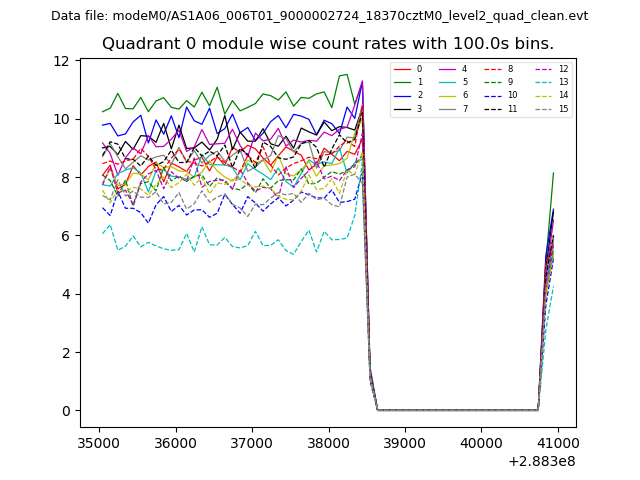 |
 |
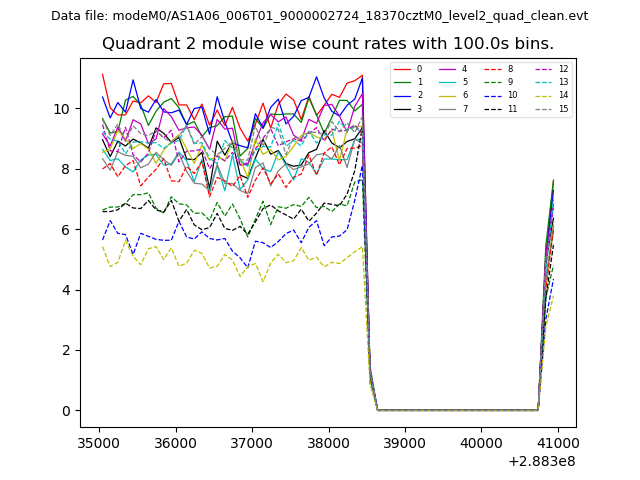
| Module-wise count rates for Quadrant B Data is divided into 100 sec bins |
 |
 |
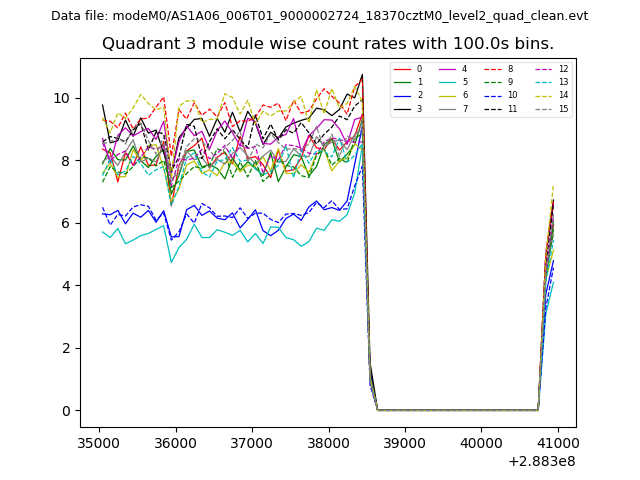
| Module-wise count rates for Quadrant C Data is divided into 100 sec bins |
 |
 |
| Module-wise count rates for Quadrant D Data is divided into 100 sec bins |
 |
 |
| Parameter | Plot |
|---|---|
| CZT HV Monitor | 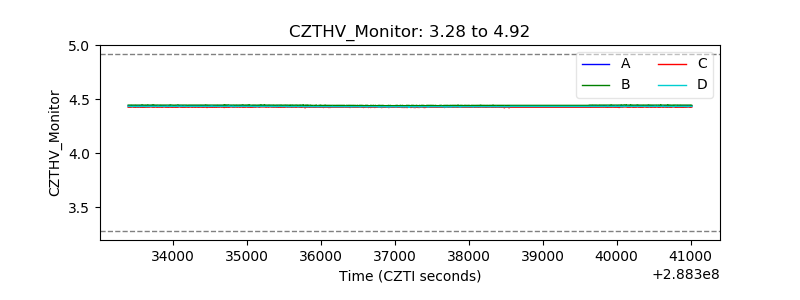 |
| D_VDD | 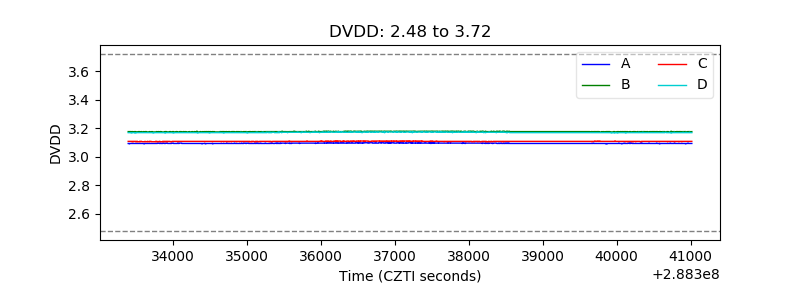 |
| Temperature 1 | 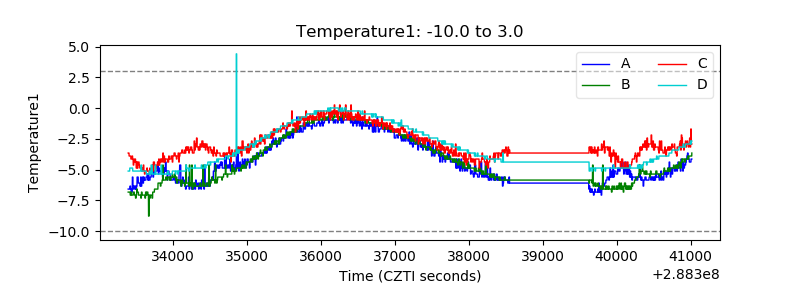 |
| Veto HV Monitor | 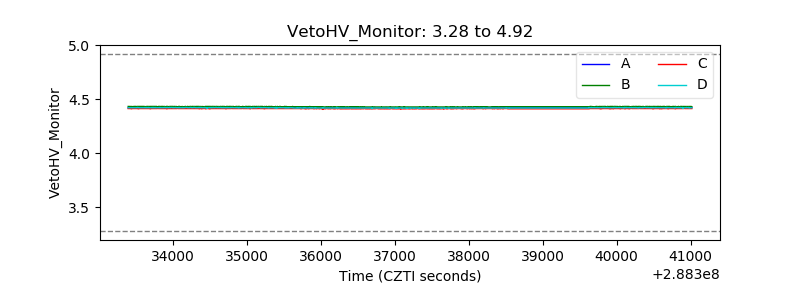 |
| Veto LLD | 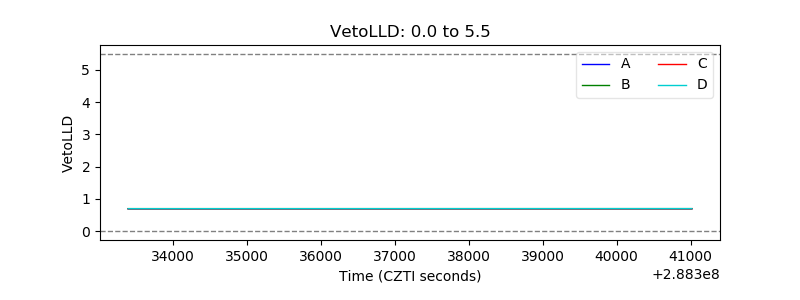 |
| Alpha Counter | 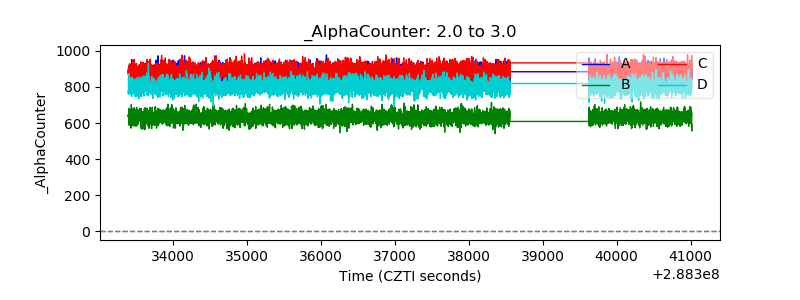 |
| _CPM_Rate | 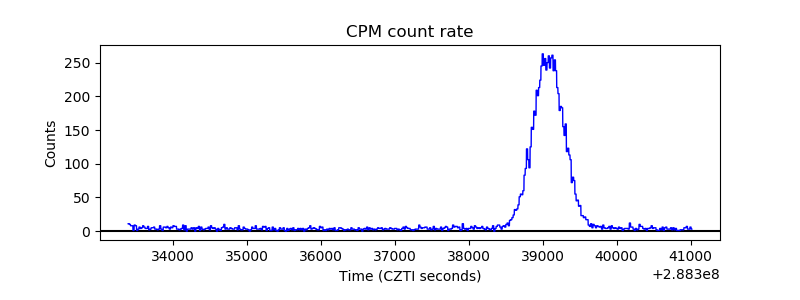 |
| CZT Counter |  |
| +2.5 Volts monitor |  |
| +5 Volts monitor | 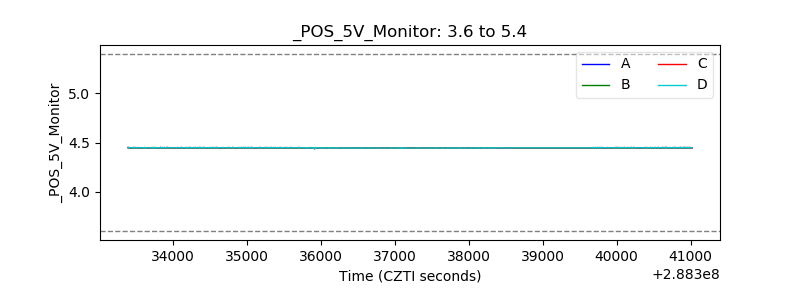 |
| _ROLL_ROT | 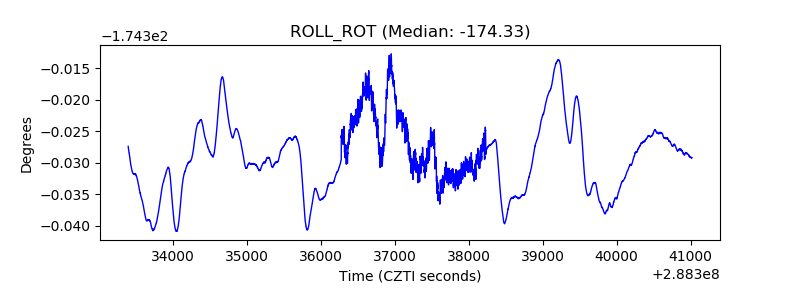 |
| _Roll_DEC | 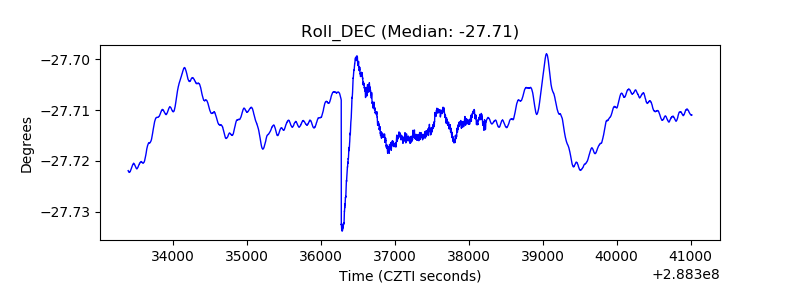 |
| _Roll_RA | 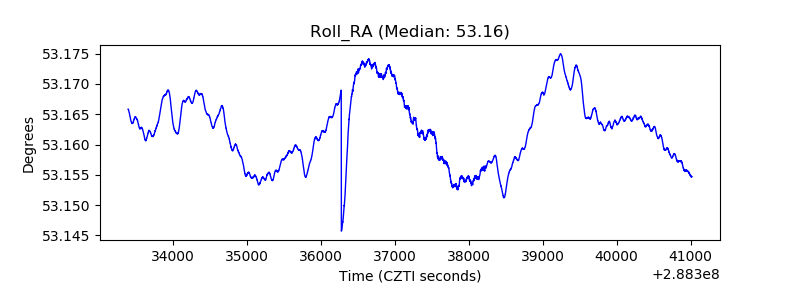 |
| Veto Counter | 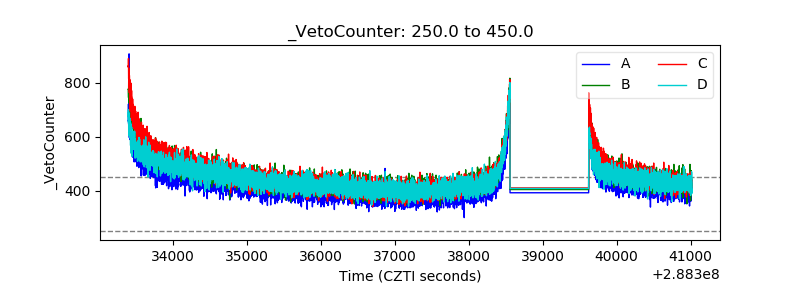 |