| Param | Original file | Final file |
|---|---|---|
| Filename | modeM0/AS1A06_006T01_9000002724_18371cztM0_level2.evt | modeM0/AS1A06_006T01_9000002724_18371cztM0_level2_quad_clean.evt |
| Size (bytes) | 513,002,880 | 85,942,080 |
| Size | 489.2 MB | 82.0 MB |
| Events in quadrant A | 3,411,760 | 533,660 |
| Events in quadrant B | 3,661,070 | 538,617 |
| Events in quadrant C | 4,042,719 | 523,414 |
| Events in quadrant D | 3,943,918 | 517,647 |
| Mode M0 | |||
|---|---|---|---|
| Quadrant | BADHDUFLAG | Total packets | Discarded packets |
| A | 0 | 14517 | 2 |
| B | 0 | 15090 | 2 |
| C | 0 | 16197 | 2 |
| D | 0 | 16277 | 2 |
| Mode SS | |||
|---|---|---|---|
| Quadrant | BADHDUFLAG | Total packets | Discarded packets |
| A | 0 | 142 | 0 |
| B | 0 | 142 | 0 |
| C | 0 | 142 | 0 |
| D | 0 | 142 | 0 |
| Mode M9 | |||
|---|---|---|---|
| Quadrant | BADHDUFLAG | Total packets | Discarded packets |
| A | 0 | 7 | 0 |
| B | 0 | 7 | 0 |
| C | 0 | 7 | 0 |
| D | 0 | 7 | 0 |
| Quadrant | Total seconds | Saturated seconds | Saturation percentage |
|---|---|---|---|
| A | 7024 | 143 | 2.035877% |
| B | 7025 | 195 | 2.775801% |
| C | 7025 | 228 | 3.245552% |
| D | 7025 | 168 | 2.391459% |
Noise dominated data is calculated using 1-second bins in cleaned event files. If a bin has >2000 counts, and if more than 50% of those come from <1% of pixels, then it is considered to be noise-dominated and hence unusable.
| Quadrant | # 1 sec bins | Bins with >0 counts | Bins with >2000 counts | High rate bins dominated by noise | Noise dominated (total time) | Noise dominated (detector-on time) | Marked lightcurve |
|---|---|---|---|---|---|---|---|
| A | 7664 | 7025 | 1 | 1 | 0.01% | 0.01% | 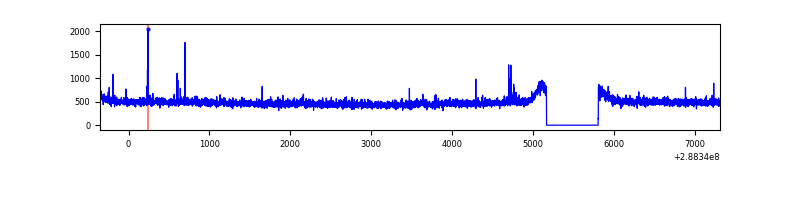 |
| B | 7665 | 7026 | 15 | 15 | 0.20% | 0.21% | 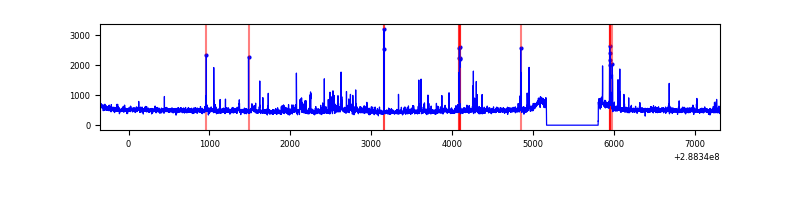 |
| C | 7665 | 7026 | 50 | 50 | 0.65% | 0.71% | 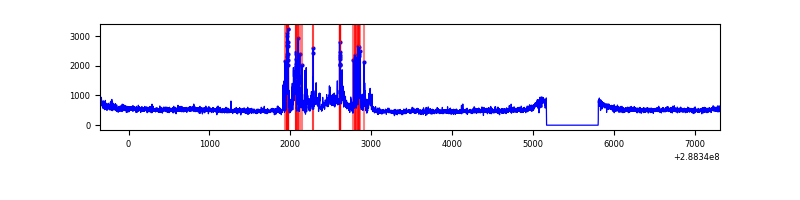 |
| D | 7665 | 7026 | 55 | 55 | 0.72% | 0.78% | 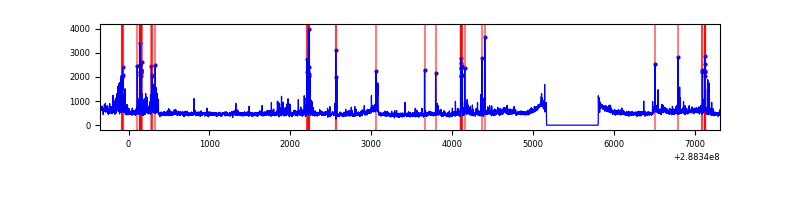 |
Top three noisy pixels from each quadrant. If the there are fewer than three noisy pixels in the level2.evt file, extra rows are filled as -1
| Pixel properties | Quadrant properties | ||||||
|---|---|---|---|---|---|---|---|
| Quadrant | DetID | PixID | Counts | Sigma | Mean | Median | Sigma |
| A | 4 | 2 | 28498 | 156.68 | 876 | 857 | 176.4 |
| A | 8 | 34 | 9259 | 47.62 | 876 | 857 | 176.4 |
| A | 0 | 226 | 7750 | 39.07 | 876 | 857 | 176.4 |
| B | 10 | 245 | 65981 | 390.41 | 874 | 852 | 166.8 |
| B | 3 | 64 | 61639 | 364.38 | 874 | 852 | 166.8 |
| B | 7 | 220 | 28968 | 168.54 | 874 | 852 | 166.8 |
| C | 0 | 207 | 322035 | 1633.68 | 840 | 846 | 196.6 |
| C | 3 | 233 | 314659 | 1596.16 | 840 | 846 | 196.6 |
| C | 14 | 238 | 127712 | 645.29 | 840 | 846 | 196.6 |
| D | 1 | 52 | 363806 | 1711.37 | 856 | 830 | 212.1 |
| D | 12 | 110 | 121126 | 567.18 | 856 | 830 | 212.1 |
| D | 7 | 96 | 80901 | 377.52 | 856 | 830 | 212.1 |
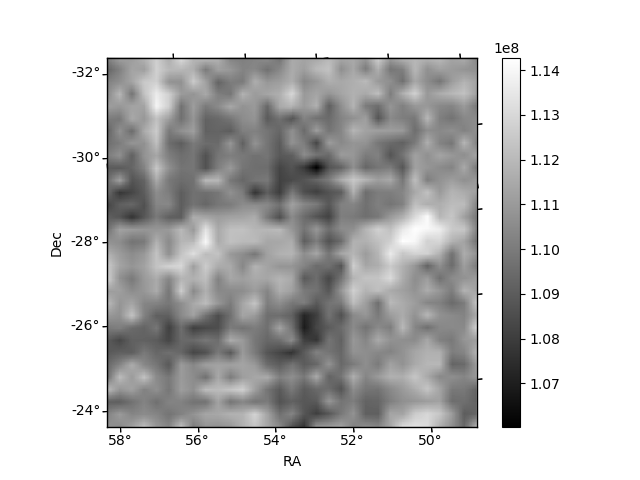
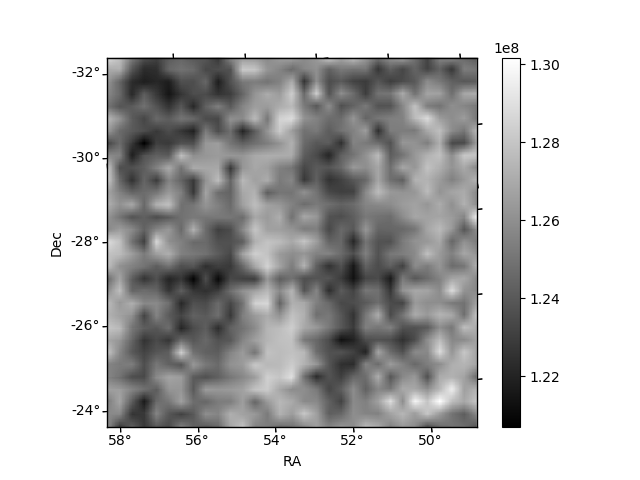
Histogram calculated using DETX and DETY for each event in the final _common_clean file
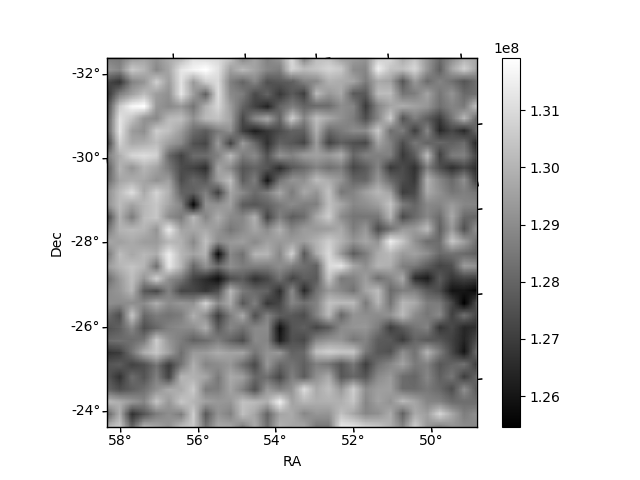
| Quadrant A | 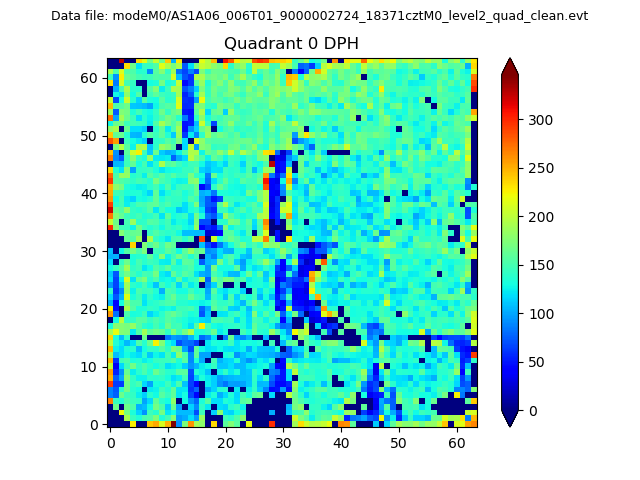 |
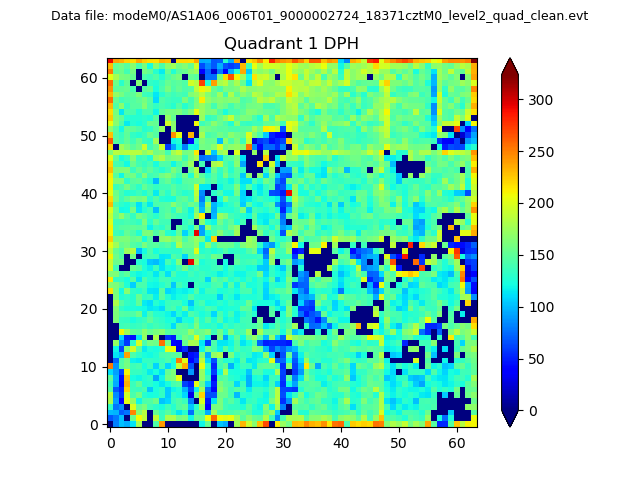 |
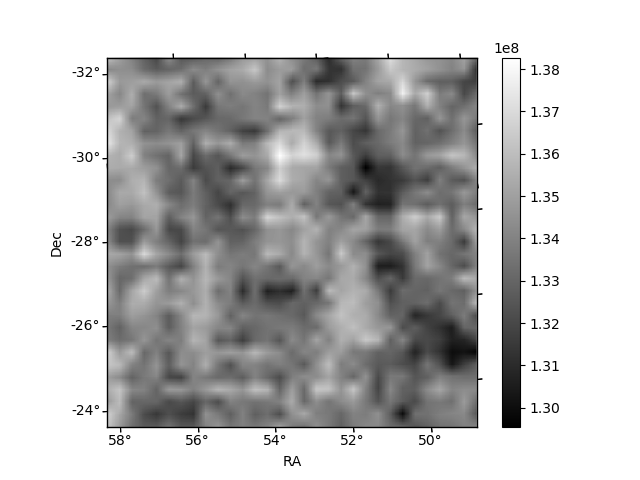
Quadrant B |
|---|---|---|---|
| Quadrant D | 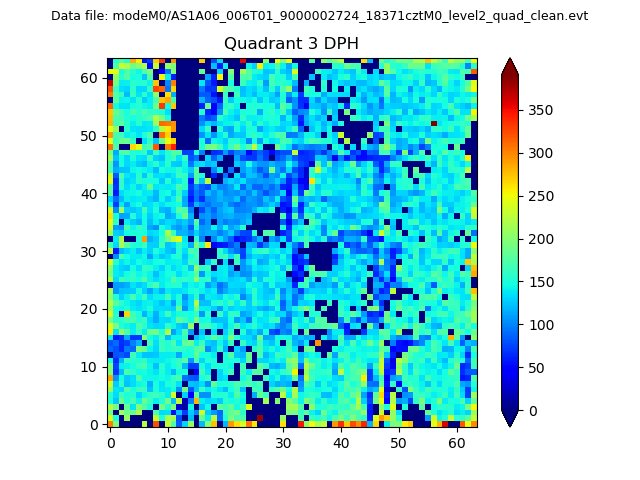 |
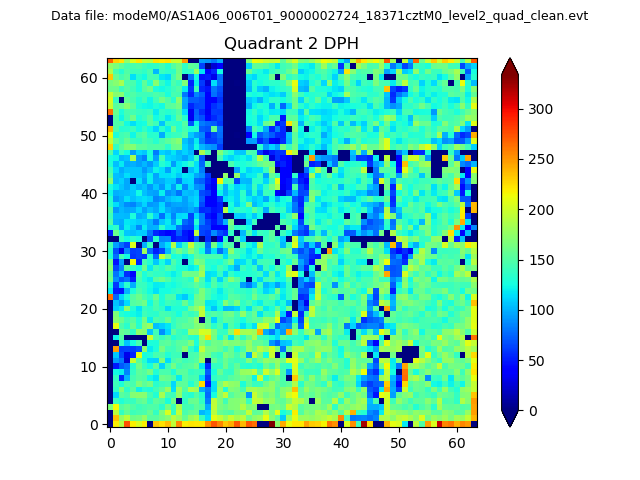 |
Quadrant C |
| Plot type | Count rate plots | Images |
|---|---|---|
| Comparison with Poisson distribution Blue bars denote a histogram of data divided into 1 sec bins. Red curve is a Poisson curve with rate = median count rate of data. |
 |
 |
| Quadrant-wise count rates Data is divided into 100 sec bins |
 |
|
| Module-wise count rates for Quadrant A Data is divided into 100 sec bins |
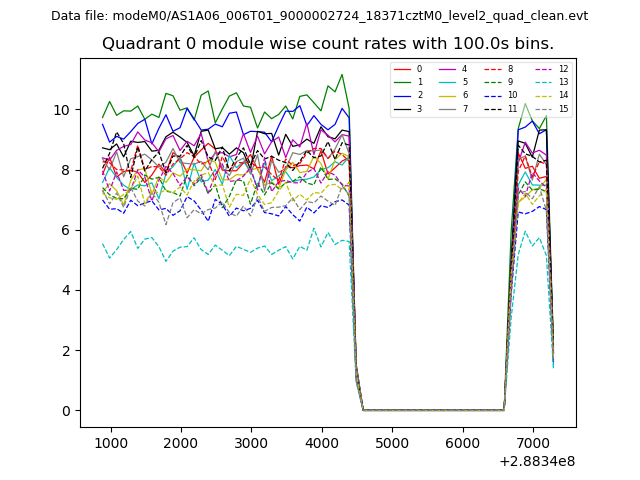 |
 |
| Module-wise count rates for Quadrant B Data is divided into 100 sec bins |
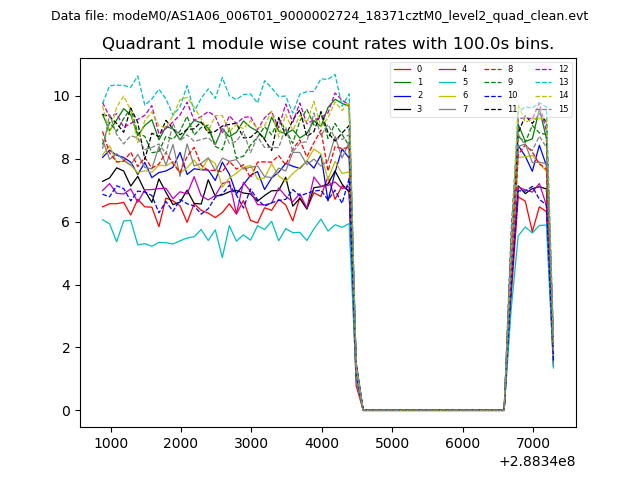 |
 |
| Module-wise count rates for Quadrant C Data is divided into 100 sec bins |
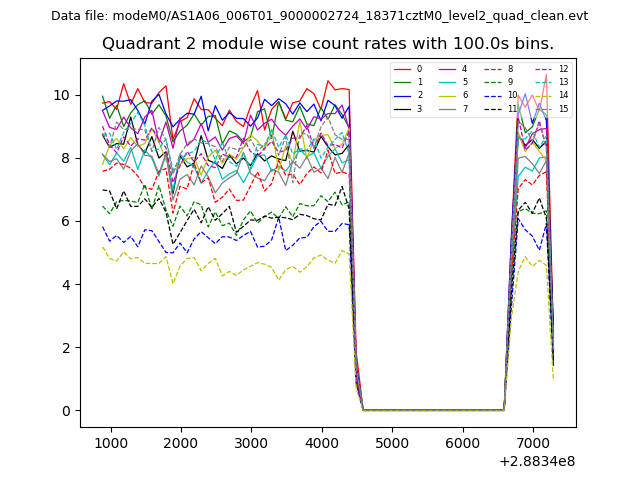 |
 |
| Module-wise count rates for Quadrant D Data is divided into 100 sec bins |
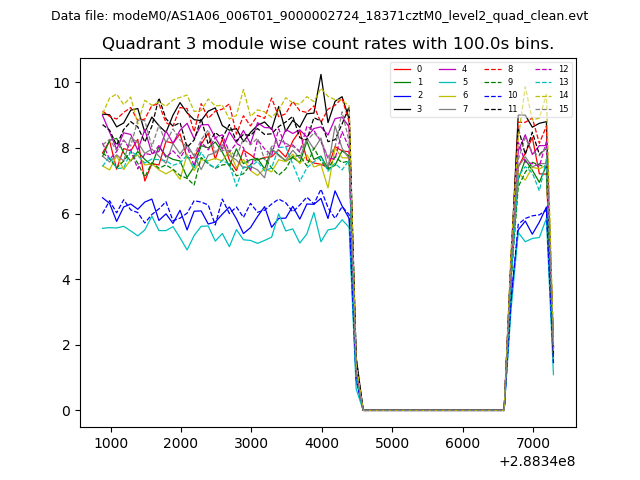 |
 |
| Parameter | Plot |
|---|---|
| CZT HV Monitor | 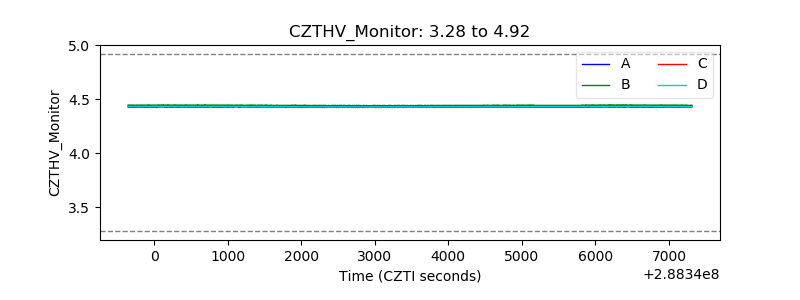 |
| D_VDD | 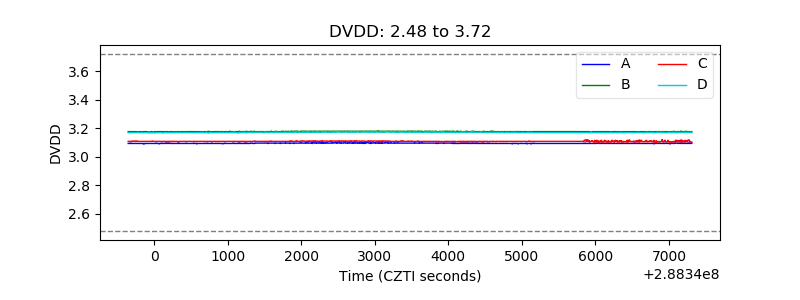 |
| Temperature 1 | 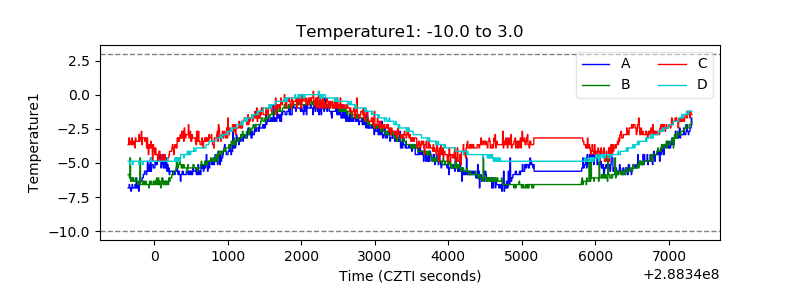 |
| Veto HV Monitor | 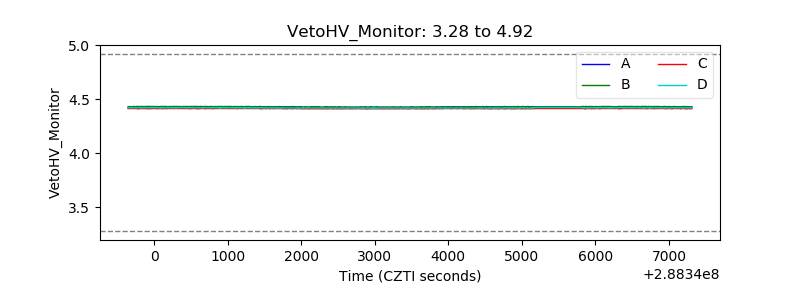 |
| Veto LLD | 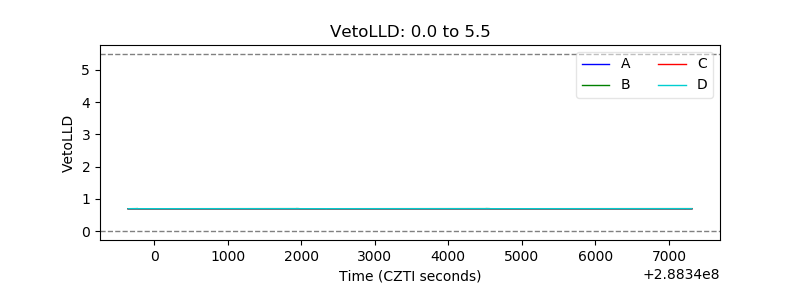 |
| Alpha Counter |  |
| _CPM_Rate | 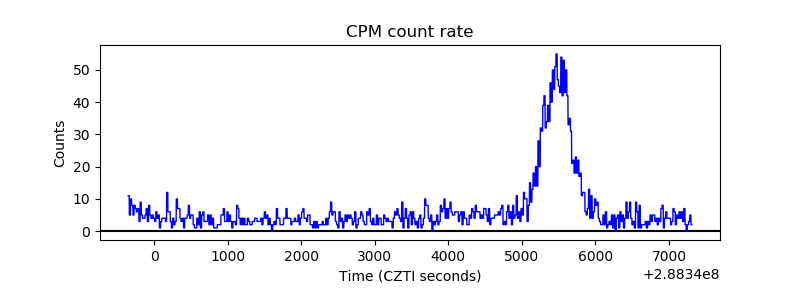 |
| CZT Counter | 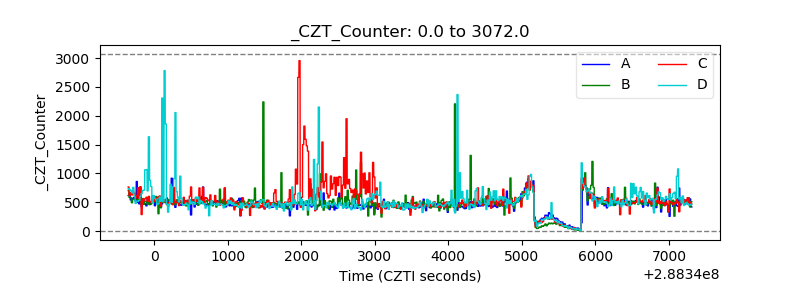 |
| +2.5 Volts monitor |  |
| +5 Volts monitor |  |
| _ROLL_ROT | 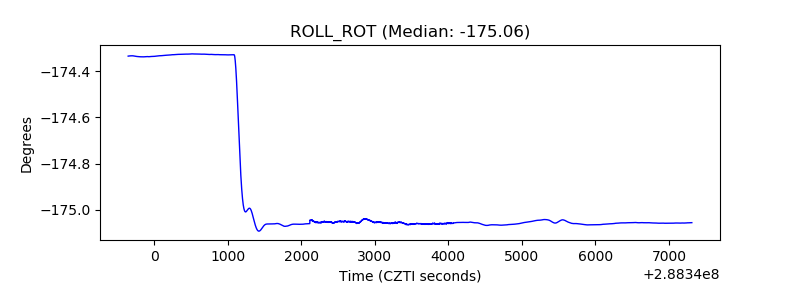 |
| _Roll_DEC | 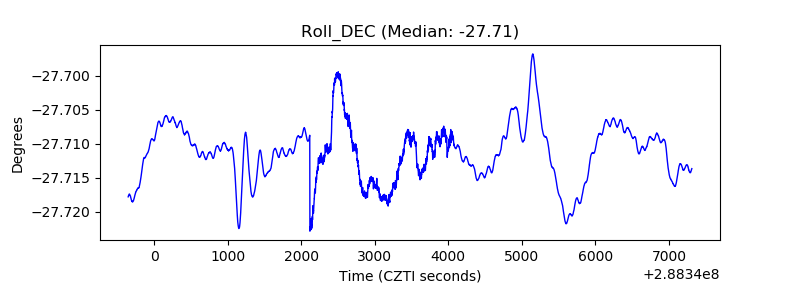 |
| _Roll_RA |  |
| Veto Counter | 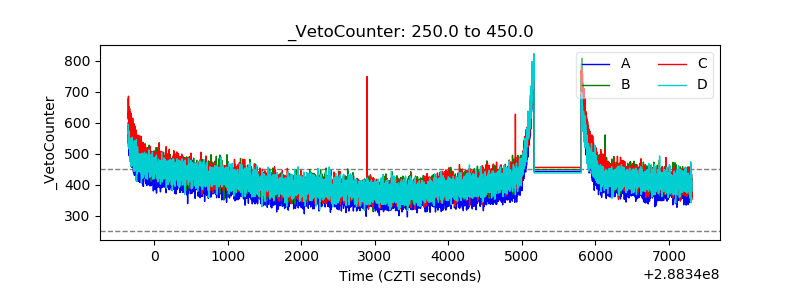 |