| Param | Original file | Final file |
|---|---|---|
| Filename | modeM0/AS1A06_006T01_9000002724_18373cztM0_level2.evt | modeM0/AS1A06_006T01_9000002724_18373cztM0_level2_quad_clean.evt |
| Size (bytes) | 536,397,120 | 98,677,440 |
| Size | 511.5 MB | 94.1 MB |
| Events in quadrant A | 3,598,051 | 625,348 |
| Events in quadrant B | 3,829,920 | 631,813 |
| Events in quadrant C | 3,860,632 | 618,338 |
| Events in quadrant D | 4,455,374 | 599,420 |
| Mode M0 | |||
|---|---|---|---|
| Quadrant | BADHDUFLAG | Total packets | Discarded packets |
| A | 0 | 15446 | 1 |
| B | 0 | 15983 | 1 |
| C | 0 | 16083 | 1 |
| D | 0 | 18122 | 1 |
| Mode SS | |||
|---|---|---|---|
| Quadrant | BADHDUFLAG | Total packets | Discarded packets |
| A | 0 | 150 | 0 |
| B | 0 | 150 | 0 |
| C | 0 | 150 | 0 |
| D | 0 | 150 | 0 |
| Mode M9 | |||
|---|---|---|---|
| Quadrant | BADHDUFLAG | Total packets | Discarded packets |
| A | 0 | 3 | 0 |
| B | 0 | 3 | 0 |
| C | 0 | 3 | 0 |
| D | 0 | 3 | 0 |
| Quadrant | Total seconds | Saturated seconds | Saturation percentage |
|---|---|---|---|
| A | 7373 | 121 | 1.641123% |
| B | 7373 | 124 | 1.681812% |
| C | 7373 | 167 | 2.265021% |
| D | 7373 | 367 | 4.977621% |
Noise dominated data is calculated using 1-second bins in cleaned event files. If a bin has >2000 counts, and if more than 50% of those come from <1% of pixels, then it is considered to be noise-dominated and hence unusable.
| Quadrant | # 1 sec bins | Bins with >0 counts | Bins with >2000 counts | High rate bins dominated by noise | Noise dominated (total time) | Noise dominated (detector-on time) | Marked lightcurve |
|---|---|---|---|---|---|---|---|
| A | 7643 | 7374 | 15 | 15 | 0.20% | 0.20% | 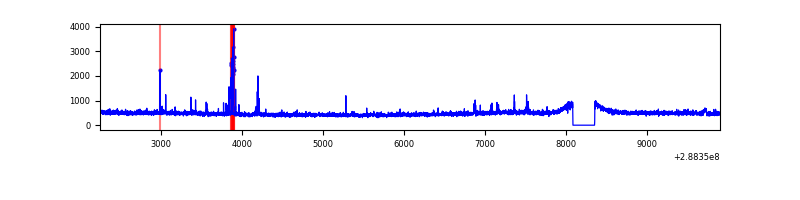 |
| B | 7643 | 7374 | 13 | 13 | 0.17% | 0.18% | 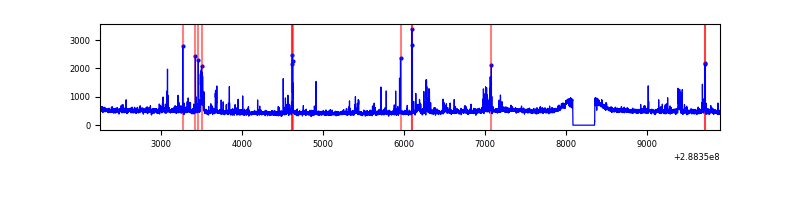 |
| C | 7643 | 7374 | 18 | 18 | 0.24% | 0.24% | 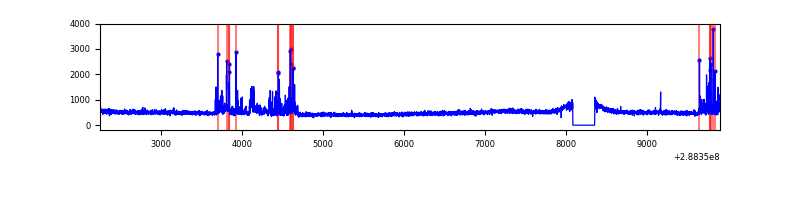 |
| D | 7643 | 7374 | 246 | 246 | 3.22% | 3.34% | 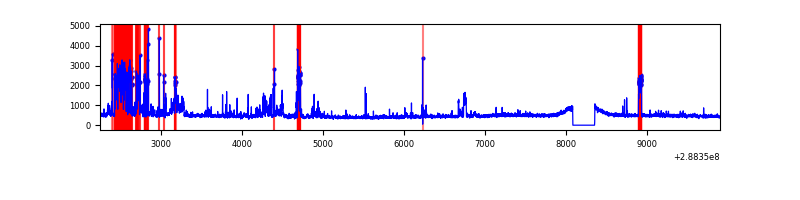 |
Top three noisy pixels from each quadrant. If the there are fewer than three noisy pixels in the level2.evt file, extra rows are filled as -1
| Pixel properties | Quadrant properties | ||||||
|---|---|---|---|---|---|---|---|
| Quadrant | DetID | PixID | Counts | Sigma | Mean | Median | Sigma |
| A | 4 | 2 | 70529 | 378.47 | 903 | 882 | 184.0 |
| A | 15 | 174 | 41926 | 223.04 | 903 | 882 | 184.0 |
| A | 0 | 226 | 8130 | 39.39 | 903 | 882 | 184.0 |
| B | 3 | 64 | 101624 | 578.42 | 900 | 875 | 174.2 |
| B | 10 | 245 | 89080 | 506.4 | 900 | 875 | 174.2 |
| B | 0 | 189 | 35792 | 200.47 | 900 | 875 | 174.2 |
| C | 0 | 207 | 321320 | 1568.05 | 864 | 867 | 204.4 |
| C | 14 | 238 | 131161 | 637.56 | 864 | 867 | 204.4 |
| C | 3 | 233 | 25486 | 120.47 | 864 | 867 | 204.4 |
| D | 1 | 52 | 622265 | 2912.79 | 872 | 845 | 213.3 |
| D | 7 | 238 | 177808 | 829.48 | 872 | 845 | 213.3 |
| D | 14 | 34 | 135284 | 630.16 | 872 | 845 | 213.3 |
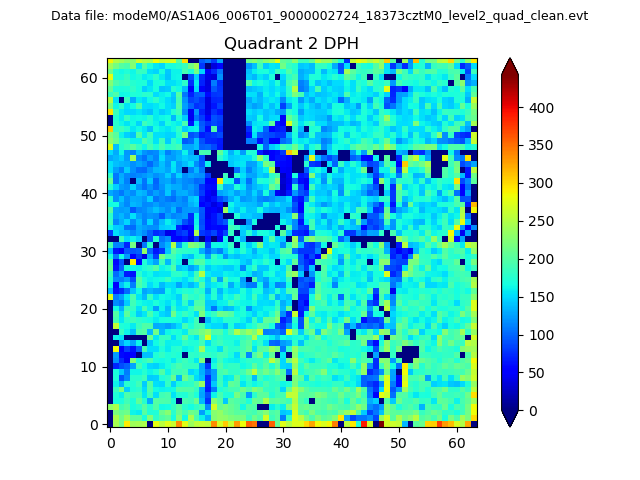
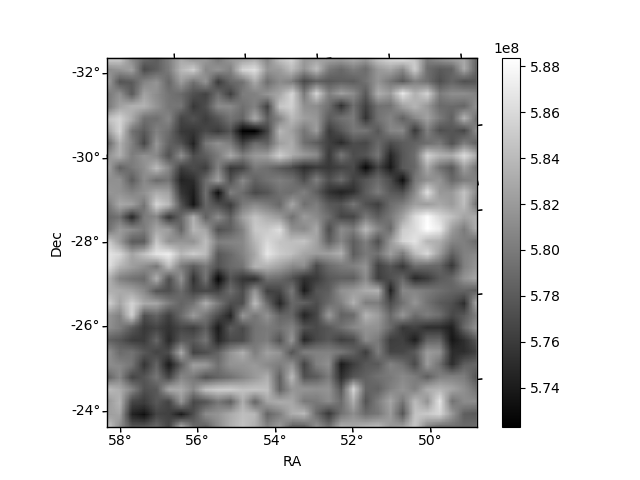
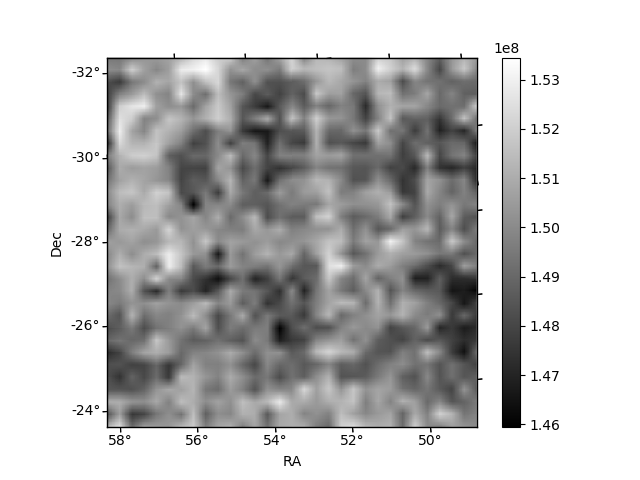
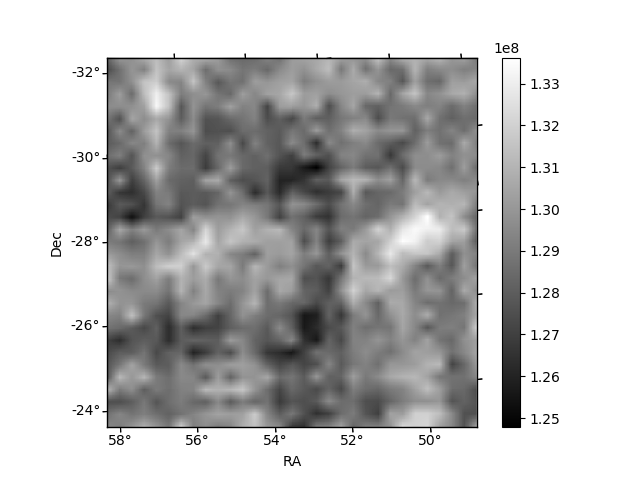
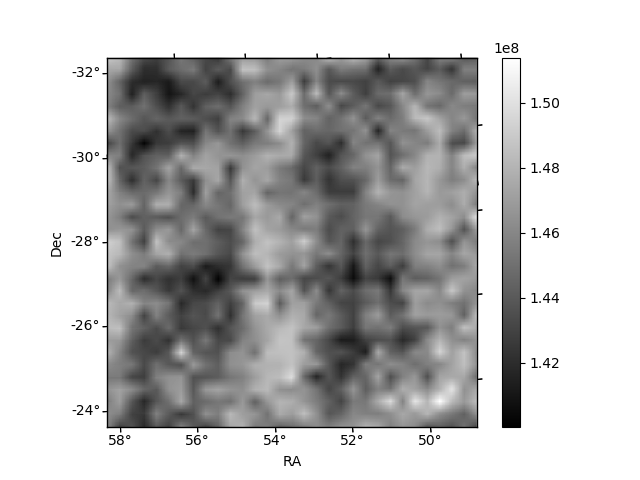
Histogram calculated using DETX and DETY for each event in the final _common_clean file
| Quadrant A | 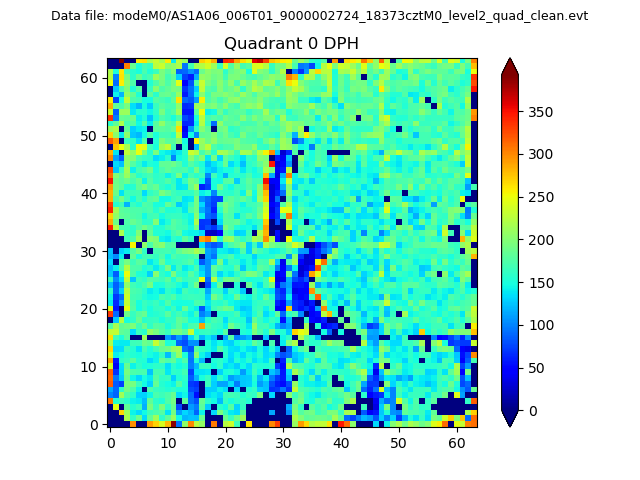 |
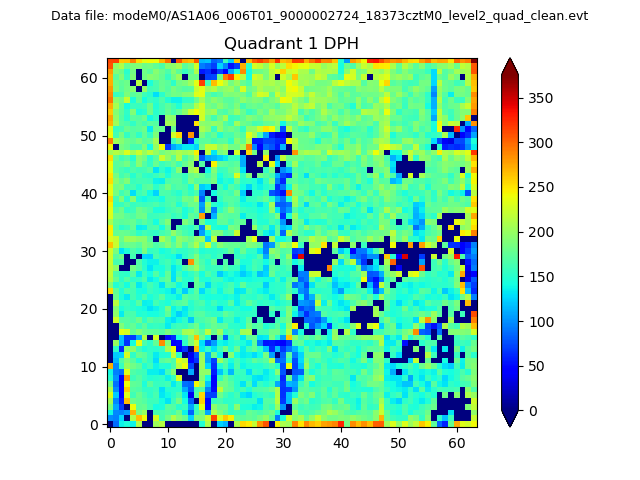 |
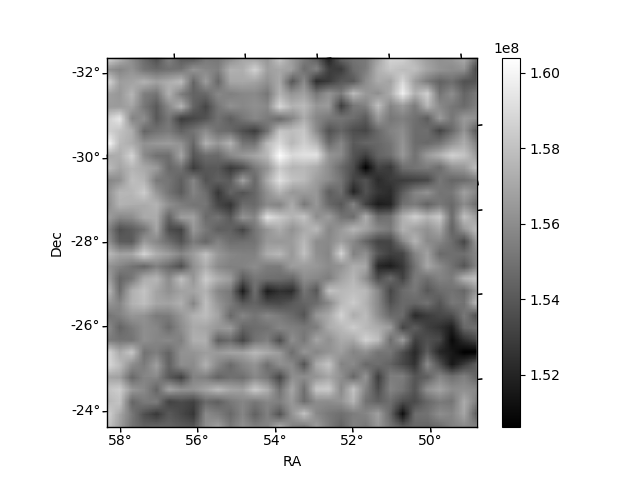
Quadrant B |
|---|---|---|---|
| Quadrant D | 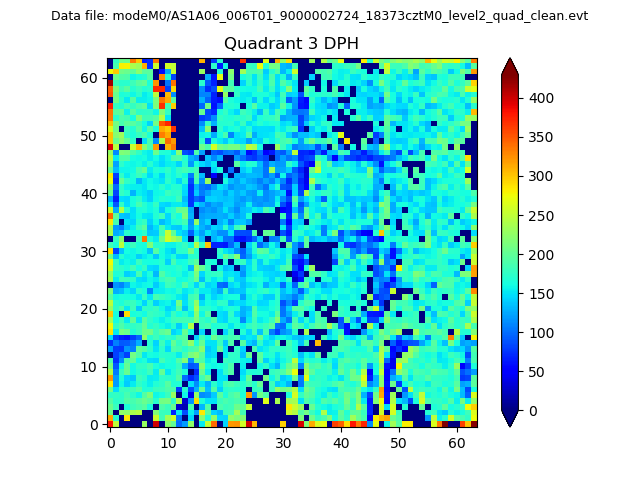 |
 |
Quadrant C |
| Plot type | Count rate plots | Images |
|---|---|---|
| Comparison with Poisson distribution Blue bars denote a histogram of data divided into 1 sec bins. Red curve is a Poisson curve with rate = median count rate of data. |
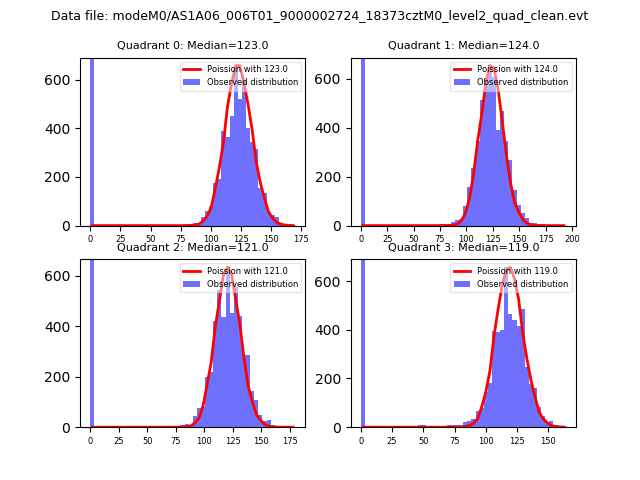 |
 |
| Quadrant-wise count rates Data is divided into 100 sec bins |
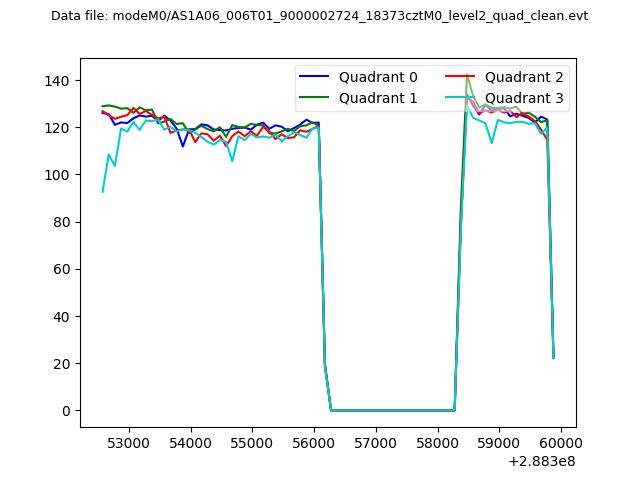 |
|
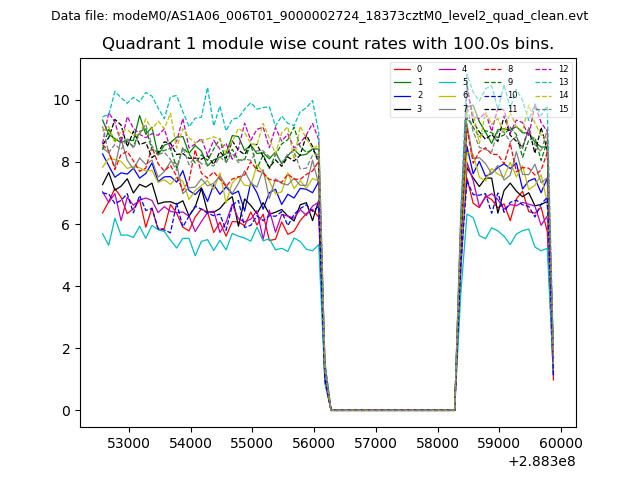
| Module-wise count rates for Quadrant A Data is divided into 100 sec bins |
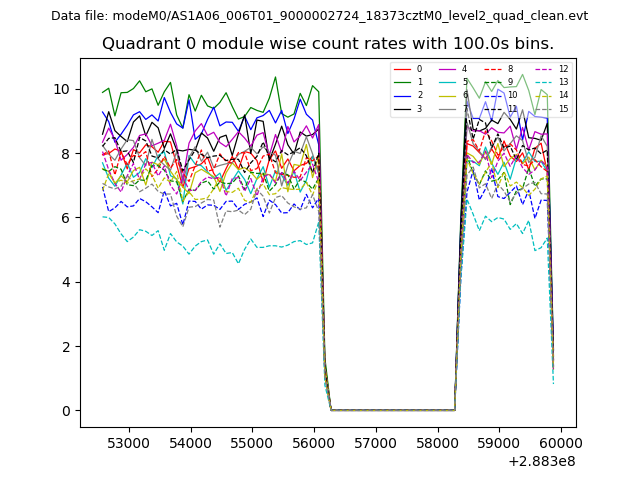 |
 |
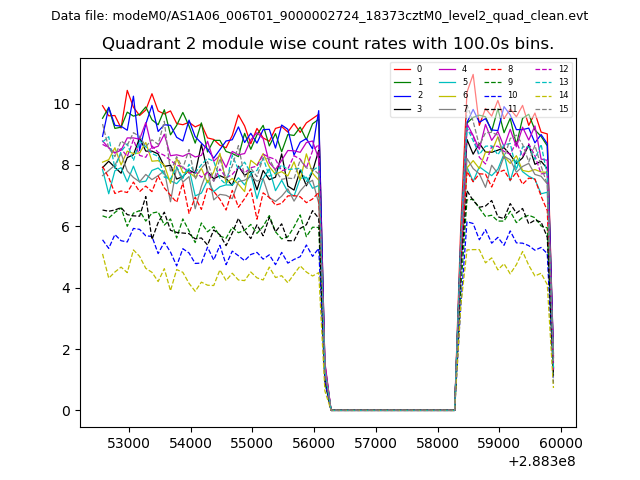
| Module-wise count rates for Quadrant B Data is divided into 100 sec bins |
 |
 |
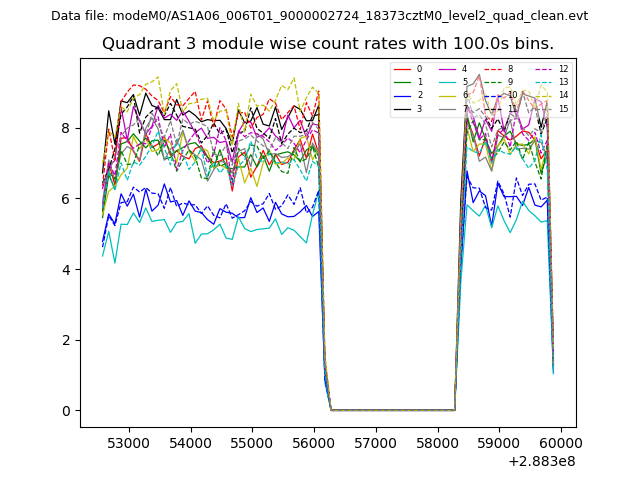
| Module-wise count rates for Quadrant C Data is divided into 100 sec bins |
 |
 |
| Module-wise count rates for Quadrant D Data is divided into 100 sec bins |
 |
 |
| Parameter | Plot |
|---|---|
| CZT HV Monitor | 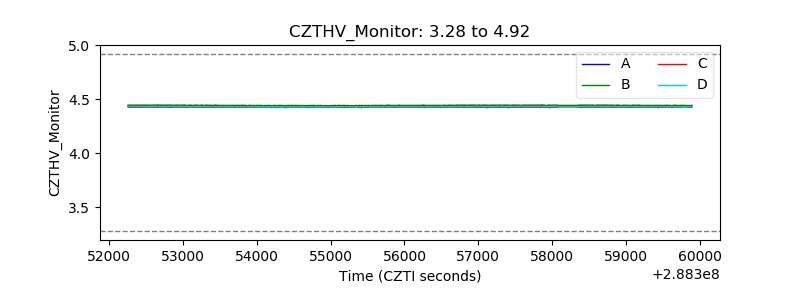 |
| D_VDD | 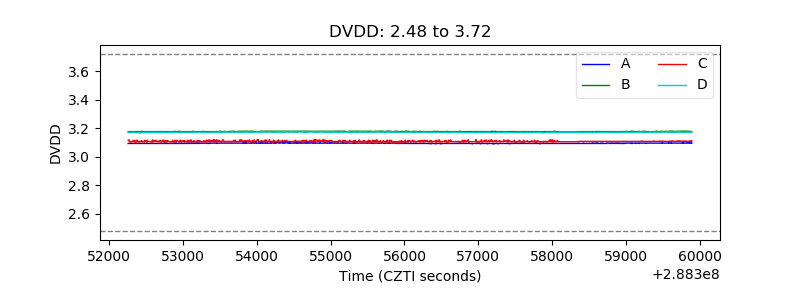 |
| Temperature 1 | 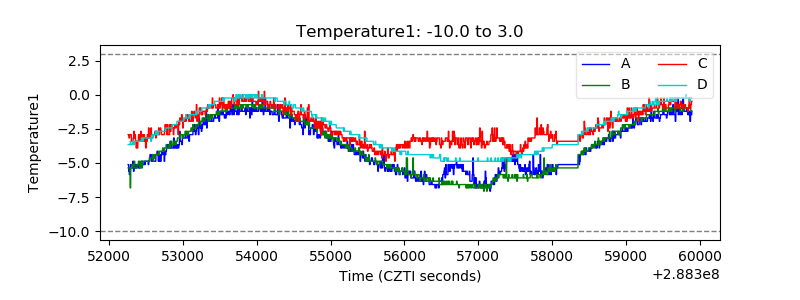 |
| Veto HV Monitor | 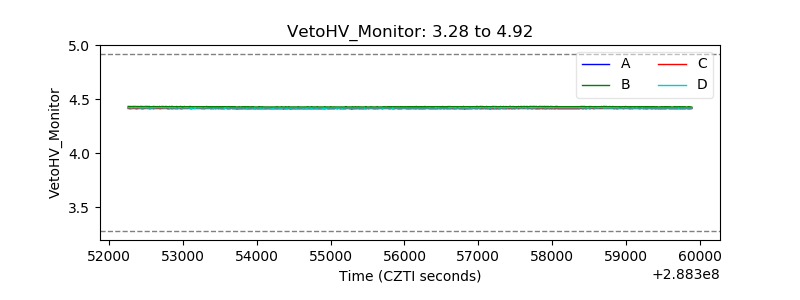 |
| Veto LLD | 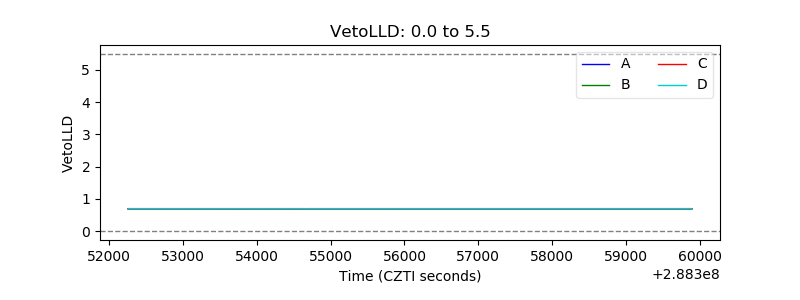 |
| Alpha Counter | 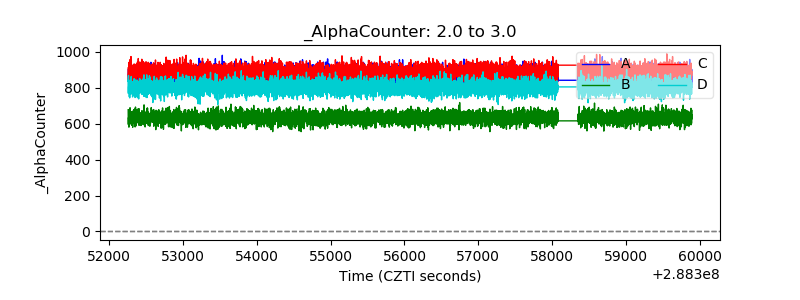 |
| _CPM_Rate | 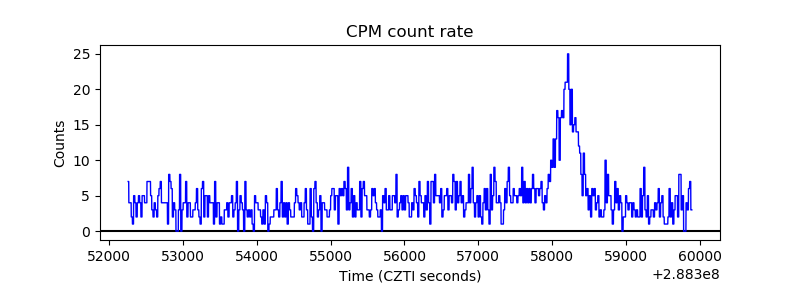 |
| CZT Counter | 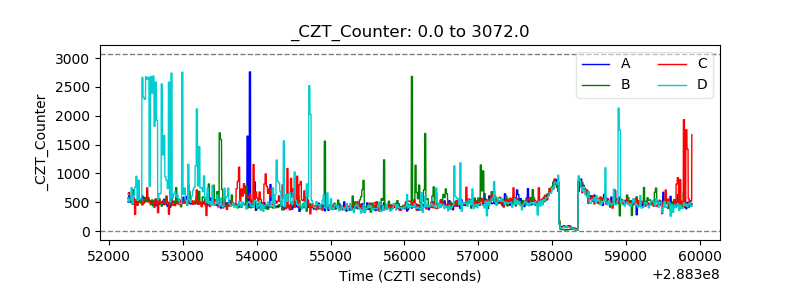 |
| +2.5 Volts monitor |  |
| +5 Volts monitor |  |
| _ROLL_ROT | 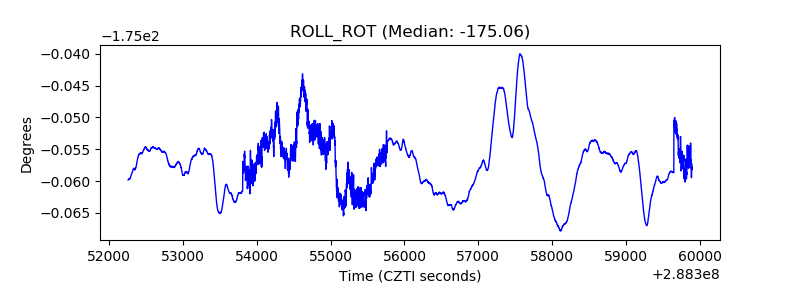 |
| _Roll_DEC | 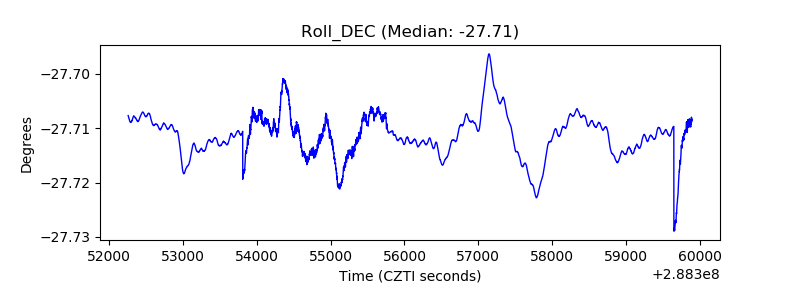 |
| _Roll_RA | 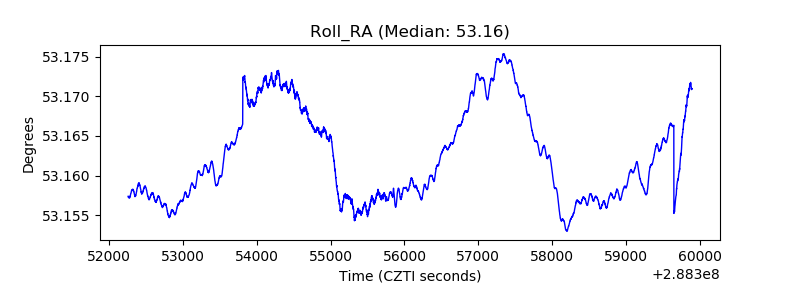 |
| Veto Counter | 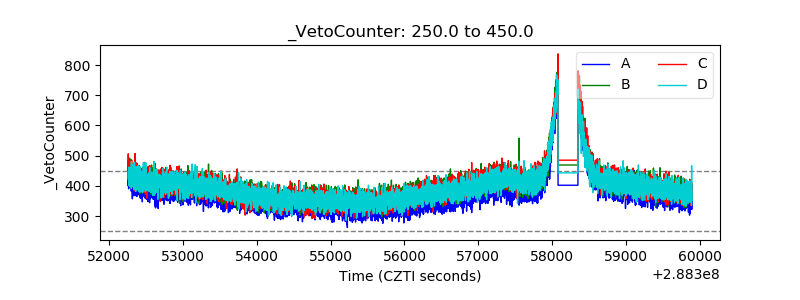 |